Fair Value Gaps BOOSTED [LuxAlgo & mqsxn] Fair Value Gaps BOOSTED
This enhanced version of LuxAlgo’s Fair Value Gap indicator takes market imbalance detection to the next level. Built on the trusted foundation of the original, this extension introduces powerful new features designed for traders who want deeper insight and more control:
Extended Visualization – Fair Value Gaps now stretch farther into the past with customizable bar extensions, so you can easily track unmitigated gaps over longer distances of time.
Intersection Highlights – Automatically identify and shade overlapping bullish/bearish FVGs, giving instant visual clarity on high-confluence zones.
Center Lines & Mitigation Tracking – Optional center lines improve precision, while mitigation markers help confirm when gaps are filled.
Advanced Filtering – Control visibility with minimum gap sizes, custom start dates for gap formations, and per-direction display limits.
Dashboard Stats – On-chart metrics show the number of detected and mitigated gaps, plus percentages, at a glance.
Alerts Ready – Set up alerts for fresh FVG formation or mitigation events, so you never miss a key signal.
Whether you’re scalping, day trading, or swing trading, Fair Value Gaps BOOSTED helps you pinpoint institutional price imbalances and trade around them with confidence.
------
Inputs & Settings
Threshold % / Auto
Defines the minimum gap size as a percentage of price. Enable Auto to let the script automatically adapt thresholding based on volatility.
Unmitigated Lines (combined)
Draws guide lines for a set number of the most recent unmitigated gaps.
Mitigation Levels
Shows dashed lines where gaps have been fully mitigated (filled).
Timeframe
Lets you calculate Fair Value Gaps on a higher or lower timeframe than the chart you’re viewing.
Style
Dynamic Mode
Keeps the most recent gap area actively updating with price as long as it remains unmitigated.
Extend Right (bars)
Controls how many bars into the future each gap visualization will project.
Bullish / Bearish Colors
Customize the fill colors of bullish and bearish gaps.
Center Line & Width
Adds a dotted line through the midpoint of each gap for visual precision.
Filter
Min Gap Size (ticks)
Only display gaps greater than or equal to this size.
Min Formation Date (days ago)
Show gaps formed within a given lookback window (e.g., only last 4 days).
Display
Show Last Bullish / Bearish (unmitigated)
Limit how many recent bullish or bearish gaps appear at once (set to 0 for unlimited).
Intersections
Show Intersections
Highlight overlapping bullish and bearish gaps as shaded zones.
Show Intersections Only
Hide individual gaps and show only the overlapping regions.
Intersection Color
Customize the fill for overlap areas.
Intersection Center Line / Width
Optionally plot a midpoint line through the overlap zone.
Dashboard
Show Dashboard
Display a compact on-chart table of bullish vs bearish counts and mitigation percentages.
Location
Choose where the dashboard sits (top right, bottom right, bottom left).
Size
Adjust text size (Tiny, Small, Normal).
在腳本中搜尋"fvg"

Fractal Suite: MTF Fractals + BOS/CHOCH + OB + FVG + Targets Kese Way
Fractals (Multi-Timeframe): Automatically detects both current-timeframe and higher-timeframe Bill Williams fractals, with customizable left/right bar settings.
Break of Structure (BOS) & CHoCH: Marks structural breaks and changes of character in real time.
Liquidity Sweeps: Identifies sweep patterns where price takes out a previous swing high/low but closes back within range.
Order Blocks (OB): Highlights the last opposite candle before a BOS, with customizable extension bars.
Fair Value Gaps (FVG): Finds 3-bar inefficiencies with a minimum size filter.
Confluence Zones: Optionally require OB–FVG overlap for high-probability setups.
Entry, Stop, and Targets: Automatically calculates entry price, stop loss, and up to three take-profit targets based on risk-reward ratios.
Visual Dashboard: Mini on-chart table summarizing structure, last swing points, and settings.
Alerts: Set alerts for new fractals, BOS events, and confluence-based trade setups.

Price Action Levels By VIPIN (RSI, MACD, BOS/CHoCH, FVG)Title:
VT Price Action Levels + Optional RSI, MACD, BOS, CHoCH, FVG
Description:
This multi-tool indicator combines price action key levels with optional confluence tools for advanced trade analysis.
Core Features:
• Previous Day & Today High/Low: Automatically plots yesterday’s and today’s high/low with customizable colors & widths.
• Strong Support/Resistance: Detects high-probability S/R zones based on swing structure, ATR-based swing filtering, and minimum gap distance.
• Trend Filters: Optional EMA50 & VWAP to visually confirm bias.
• RSI Module: Shows bias (overbought/oversold zones) with optional candle coloring.
• MACD Module: Plots bullish/bearish MACD cross markers directly on chart.
• Structure Analysis: BOS (Break of Structure) & CHoCH (Change of Character) labels to help identify market shifts.
• Fair Value Gaps: Highlights recent bullish/bearish FVGs for potential imbalance zones.
• Fully Customizable: Every feature can be toggled ON/OFF from settings panel.
Usage Idea:
Enable only the modules you need to keep charts clean and focused. For example, keep PDH/PDL and Strong S/R always on, and switch on RSI/MACD/BOS only when looking for trade confirmation.
This script is designed for traders who combine price action + SMC concepts for intraday or swing setups.
Notes:
• Works on all timeframes and markets (forex, crypto, stocks, indices).
• All elements are customizable in the settings panel.
• This script does not generate buy/sell signals — it is a tool for manual analysis.

UT Bot + Cooldown + Visual FVGSynopsis – UT Bot + Cooldown + Visual FVG
This TradingView script combines:
✅ UT Bot Reversal Signals
Based on ATR and volatility logic
BUY when trend flips from bearish to bullish
SELL when trend flips from bullish to bearish
✅ Cooldown Filter
Limits signals to 1 per X bars (default 30)
Prevents overtrading during choppy price action
✅ Optional FVG Markers (Fair Value Gaps)
Visually shows bullish or bearish imbalances (3-bar gaps)
Does not affect signal generation — only for confluence
🔍 Ideal for traders who want clean, time-filtered signals with visual price-action context. Suitable for futures, crypto, or forex on intraday charts.

Fair Value Gap (FVG) Detector Fair Value Gap (FVG) is an imbalance in price action that occurs when there is a strong displacement (big movement) in the market, leaving a gap between wicks. This gap represents an area where price moved too quickly, and liquidity was not fully filled.
Traders use FVGs as potential areas where price might retrace and react before continuing in the original direction.

ICT Candle Block (fadi)ICT Candle Block
When trading using ICT concepts, it is often beneficial to treat consecutive candles of the same color as a single entity. This approach helps traders identify Order Blocks, liquidity voids, and other key trading signals more effectively.
However, in situations where the market becomes choppy or moves slowly, recognizing continuous price movement can be challenging.
The ICT Candle Block indicator addresses these challenges by combining consecutive candles of the same color into a single entity. It redraws the resulting candles, making price visualization much easier and helping traders quickly identify key trading signals.
FVGs and Blocks
In the above snapshot, FVGs/Liquidity Voids, Order Blocks, and Breaker Blocks are easily identified. By analyzing the combined candles, traders can quickly determine the draw on liquidity and potential price targets using ICT concepts.
Unlike traditional higher timeframes that rigidly combine lower timeframe candles based on specific start and stop times, this indicator operates as a "mixed timeframe." It combines all buying and all selling activities into a single candle, regardless of when the transactions started and ended.
Limitations
There are currently TradingView limitations that affect the functionality of this indicator:
TradingView does not have a Candle object; therefore, this indicator relies on using boxes and lines to mimic the candles. This results in wider candles than expected, leading to misalignment with the time axis below (plotcandle is not the answer).
There is a limit on the number of objects that can be drawn on a chart. A maximum of 500 candles has been set.
A rendering issue may cause a sideways box to appear across the chart. This is a display bug in TradingView; scroll to the left until it clears.

Imbalance FVG SIBI BISIImbalance Detection Script
Author: © teshmi9z
Script Name: Imbalance FVG
Version: Pine Script® v5
Description:
This script detects and highlights imbalances on the chart, areas where price movement has created a gap without immediate return, signaling potential zones of future support or resistance.
The script identifies two types of imbalances:
Bullish Imbalance: Occurs when the low of two bars ago is less than or equal to the previous bar's open, and the current bar's high is greater than or equal to the previous bar's close.
Bearish Imbalance: Occurs when the high of two bars ago is greater than or equal to the previous bar's open, and the current bar's low is less than or equal to the previous bar's close.
These imbalances are visualized as semi-transparent yellow boxes on the chart, which can be adjusted for transparency.
Parameters:
Transparency (FVG): Adjust the transparency of the yellow boxes, from 0 (opaque) to 100 (fully transparent).
Usage:
This script helps traders quickly identify and visualize potential reversal zones or areas of interest on the chart. It’s a useful tool for pinpointing where significant price reactions may occur.

Volumetric Fair Value Gaps [AlgoAlpha]🎯 Introducing the Volumetric Fair Value Gaps by AlgoAlpha 🎯
Embrace the power of volume and price action with the Volumetric Fair Value Gaps (VFVG) indicator, designed meticulously by AlgoAlpha. This innovative tool enhances your charting capabilities by highlighting fair value gaps in real-time, facilitating superior market entry and exit decisions. 🚀📈
🔍 Key Features:
🔹 Fair Value Gap Detection: Utilizes price action and volume to identify significant fair value gaps, offering potential high-probability trading opportunities.
🔹 Adjustability: Customize the sensitivity with 'FVG Noise Reduction Length' and 'Noise Reduction Factor' to match the volatility and characteristics of the asset being traded.
🔹 Visual Appeal: Displays bullish gaps in a soothing Bullish Color and bearish gaps in a striking Bearish Color, making it easy to spot and analyze trends on the fly.
🔹 Overlay Feature: Plots directly on the price chart for seamless integration and analysis.
🌟 Quick Guide to Using the Volumetric Fair Value Gaps Indicator:
🛠 Add the Indicator: Add the indicator to favourites and set it up with your desired settings.
📊 Market Analysis: Watch for the appearance of colored boxes (blue for bearish, gray for bullish) which represent the fair value gaps. These are high-probability areas for reversals or continuations. FVGs with higher volume are implied to induce a stronger reaction on price.
🔔 Alerts: Set up alerts to notify you when new gaps are detected, ensuring you never miss out on potential trades!
🛠 How It Works:
The Volumetric Fair Value Gaps (VFVG) indicator identifies significant price gaps that are not just based on price action but are also substantiated by volume, which are often overlooked in typical analyses. It operates by comparing the current candle’s price range against historical averages and is calculated over a user-defined period, displayed with volume for further insights. For a gap to be recognized as significant (either bullish or bearish), it must exceed a certain size relative to these averages, which can be adjusted for sensitivity using the provided settings. Bullish gaps are identified when the current low is higher than the second previous high after surpassing the threshold, and bearish gaps are marked when the current high is below the second previous low, similarly surpassing the threshold. This dual-confirmation (volume and price deviation) approach minimizes false signals and enhances the reliability of identified gaps.
Maximize your trading strategy with the VFVG Indicator by AlgoAlpha and turn those gaps into opportunities! 🌈✨

Order-Block Detector ICT/SMT + FVG + SignalsOrderBlock-Finder
This script shows order-blocks (OB) and fair-value-gaps (FVG). Additionaly there are entry signals for OB and FVG. The Dist-Parameter tell how many candles should exist between the beginning of the OB or FVG and the pullback.
Order-Blocks
An order block in trading typically refers to a significant grouping of buy or sell orders at a particular price level within a financial market. These blocks of orders can influence price movement when they are executed. Here's a breakdown:
Buy Order Block: This occurs when there's a large concentration of buy orders at a specific price level. It indicates a significant interest among traders to purchase the asset if the price reaches that level.
Sell Order Block: Conversely, a sell order block happens when there's a notable accumulation of sell orders at a particular price level. This suggests that many traders are willing to sell the asset if the price reaches that level.
Impact on Price: Order blocks can influence price movement because when the market approaches these levels, the orders within the block may be triggered, leading to increased buying or selling pressure, depending on the type of block. This surge in trading activity can cause the price to either bounce off the level or break through it.
Support and Resistance: Order blocks are often associated with support and resistance levels. A buy order block may act as support, preventing the price from falling further, while a sell order block may serve as resistance, hindering upward price movement.
Fair-Value-Gap
The fair value gap in trading refers to the difference between the current market price of an asset and its calculated fair value. This concept is often used in financial markets, especially in the context of stocks and other securities. Here's a breakdown:
Market Price: The market price is the price at which an asset is currently trading in the market. It is determined by the interaction of supply and demand forces, as well as various other factors such as news, sentiment, and economic conditions.
Fair Value: Fair value represents the estimated intrinsic value of an asset based on fundamental analysis, which includes factors such as earnings, dividends, cash flow, growth prospects, and prevailing interest rates. It's essentially what an asset should be worth based on its fundamentals.
Fair Value Calculation: Analysts and investors use various methods to calculate the fair value of an asset. Common approaches include discounted cash flow (DCF) analysis, comparable company analysis (CCA), and dividend discount models (DDM), among others.
Fair Value Gap: The fair value gap is the numerical difference between the calculated fair value of an asset and its current market price. If the market price is higher than the fair value, it suggests that the asset may be overvalued. Conversely, if the market price is lower than the fair value, it indicates that the asset may be undervalued.
Trading Implications: Traders and investors often pay attention to the fair value gap to identify potential trading opportunities. If the market price deviates significantly from the fair value, it may present opportunities to buy or sell the asset with the expectation that the market price will eventually converge towards its fair value.

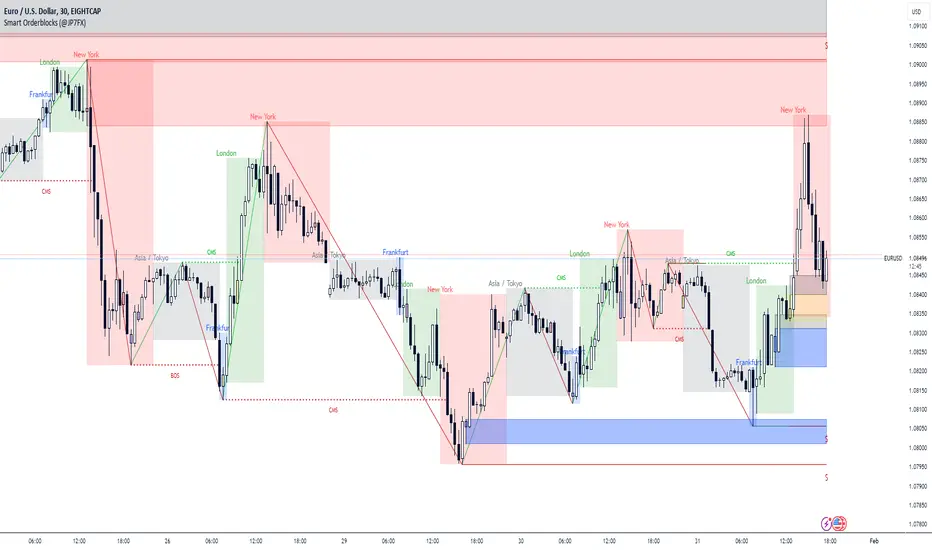
Smart Orderblocks / Supply and Demand (@JP7FX)
"Smart" Order Block Supply and Demand Indicator – a tool inspired by Smart Money Concepts and designed to complement your trading style.
It's not about perfection, but rather about enhancing your trading insights and catching things you might have missed.
Keep in mind that the structural representation here is subjective, just like many other indicators. It's more of a guide to help you navigate the market.
While it doesn't explicitly include Imbalance / FVG, you have the flexibility to use additional Imbalance /FVG indicators, including my own, to complement the insights drawn from Supply and Demand zones.
This indicator offers customisation options like trading ranges, allowing you to mark Killzones and tailor it to your preferences. Explore liquidity levels, 50% retracement lines, and personalize the colors and lines to match your unique chart setup.
Guide below on how the "Hidden" Zones are created!
Trade Safe :)
Daily Gaps & Trapped PositionsThis script builds substantially upon the default Gaps script provided by Tradingview. Functionality was added to allow users to decide what price from the previous session is used to determine a daily gap, added support for showing gaps across all timeframes up to the daily time frame, and also allow gaps to be shown even with ETH enabled on the chart. This script provides support across normal securities, futures, and also crypto.
Users can decide between the following selections to determine if a daily gap has formed:
- Previous Session Close
- Previous Session High/Low
- Last RTH Candle High/Low
The other larger piece that was added is something called trapped positions or what some folks familiar with Market Profile would call "single prints". They could also be considered FVGs but they are a specific subset of FVGs as these must from above or below the current session's high/low.
Single prints form above or below a current session's high/low and can be considered an area where price has moved too fast in that area and price will most likely return to these areas at a later point in time. In some teachings, these are also looked at as "trapped shorts" (lighter blue box color) or "trapped supply" (yellow orange box color) which creates an area where there will be potential support (trapped shorts) or resistance (trapped supply) when this area is revisited in the future. Adding these to your chart will simply provide additional areas of interest where you may see buying or selling.
Both gaps and trapped positions have the following options:
- Show only active gaps/trapped positions. Selecting this will only show areas where price has not completely traded through the box.
- Close gaps/trapped positions partially. If this is selected, it will reduce the box size as price is traded through the area. If it is not selected, the box will only disappear once price has traded through the entire box completely.
There are some additional settings that allow you to tailor how many boxes show up on the chart. These settings are as follows:
- Max number of boxes. This setting will only plot up to this number of gaps/trapped positions.
- Minimum Deviation. This will prevent gaps/trapped positions from showing if they are too small relative to average across that last 14 periods.
- Limit Max Box Trail Length (bars). If checkbox is selected, the box will stop being extended after X number of bars given in this input.

ICT HTF Candles (fadi)Plotting a configurable higher timeframe on current chart's timeframe helps visualize price movement without changing timeframes. It also plots FVG and Volume Imbalance on the higher timeframe for easier visualization.
With ICT concepts, we usually wait for HTF break of structure and then find an entry on a lower timeframe. With this indicator, we can set it to the HTF and watch the develop of price action until the break of structure happens. We can then take an entry on the current timeframe.
Settings
HTF Higher timeframe to plot
Number of candles to display The number of higher timeframe candles to display to the right of current price action
Body/Border/Wick The candle colors for the body, border, and wick
Padding from current candles The distance from current timeframe's candles
Space between candles Increase / decrease the candle spacing
Candle width The size of the candles
Imbalance
Fair Value Gap Show / Hide FVG on the higher timeframe
Volume Imbalance Show / Hide Volume Imbalance on the higher timeframe
Trace
Trace lines Extend the OHLC lines of the higher timeframe and the source of each
Label Show/Hide the price levels of the OHLC

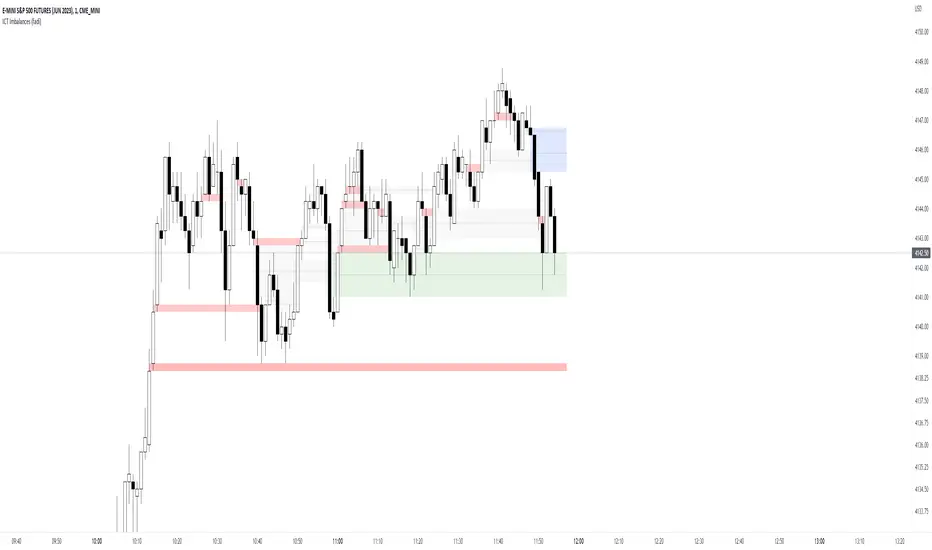
ICT Imbalances (fadi)ICT Imbalances focuses on highlighting the imbalances described by ICT Se imbalances usually act as a price magnet where price tend to revisit to mitigate the imbalance and can act as support and resistance.
It is important to understand that, while they do act as price magnet, they are not all places for entries. What they do provide, is a price understanding and possible areas of reversal based on the bigger picture and trading strategy.
There are four types of imbalances covered by this indicator:
Fair Value Gap (FVG)
Fair value is when, at any given price, both buy and sell sides are offered. For every up move, there is a down move. Fair value Gap is an imbalance where price moved too quickly before offering both buy side and sell side at a given price.
Implied Fair Value Gap (IFVG)
Implied Fair Value Gap is when the first and third candle have overlapping large wicks. The IFVG is the area between the half point of first and third candles.
Volume Imbalance (V.I.)
Volume imbalance is when the price creates a gap between the close of one candle and the open of the following candle with overlapping wicks.
Gap
An area where price gaps up or down leaving a void where price did not trade in. This is most common on higher timeframes and when one day ends and the next day begins.
Settings
ICT Imbalances provides the following options
- Show or hide specific imbalance to keep the chart clean
- Background color of the box highlighting the imbalance
- Box width in the form of how many candles the box extends to
- Show or Hide the Half Mark of the box, only applies to FVG and IFVG
- Show or hide a Legend that explains which colors represents which imbalance
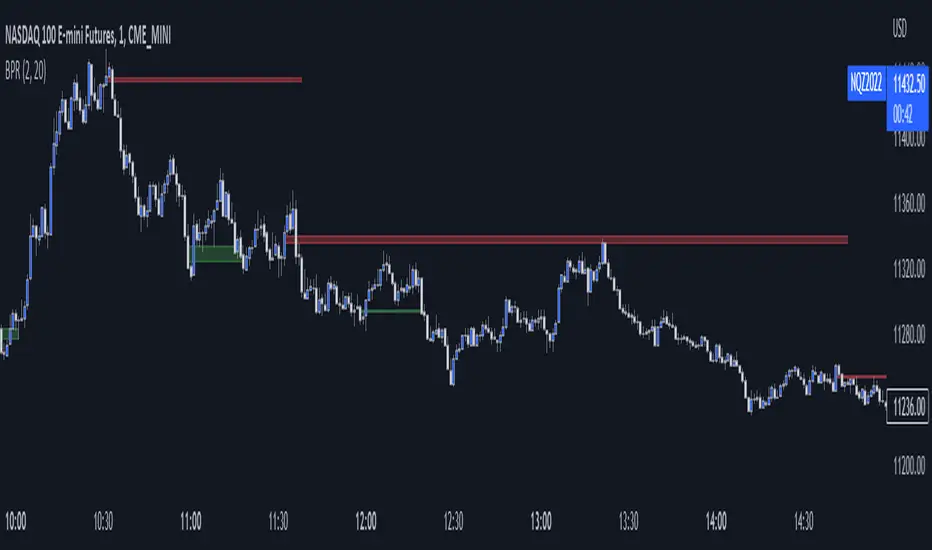
Balanced Price Range (BPR)This script finds BPR's, which some simply refer to as a "double Fair Value Gap" (FVG). In a BPR, there is an overlapping vertical area between a recent bullish and bearish FVG. You may tune the parameters to filter out smaller FVG's or BPR's, as well as how far back the indicator must look to find a matching pair.
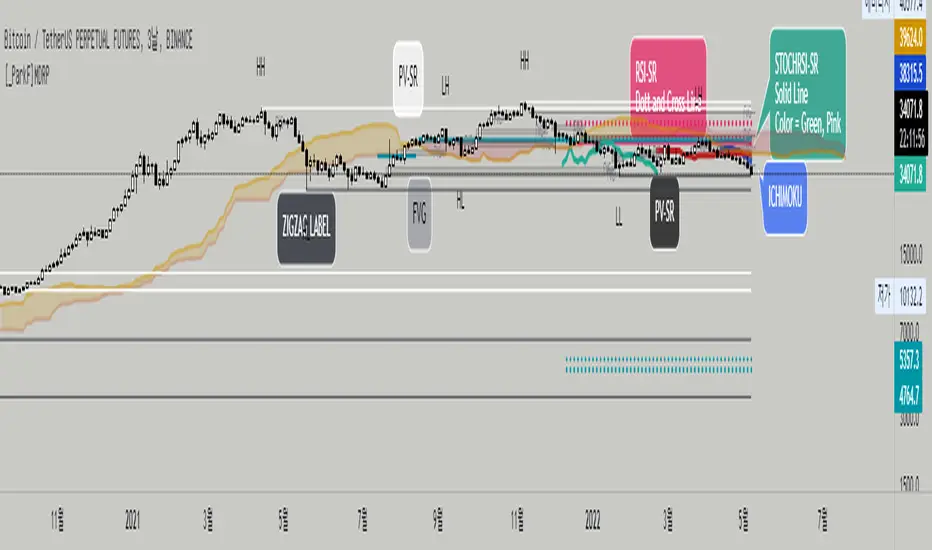
[_ParkF]MDRPThis indicator indicates that 'Momentum Discrepancy Reversal Point' = 'MDRP'.
Mixing and modifying several general indicators to find support and resistance
It is created to predict the change point of the trend by overlaying it on the chart.
The 4 support and resistance lines are drawn live, and the changed support and resistance lines are
It erases the line and overlays it again with a new line.
For each support and resistance, you can modify the color or line thickness, number of expressions, etc. in the input menu.
1. _____RSI-SR
Based on Wilder's RSI formula, overbought and oversold
Changes are detected and overlaid on the chart in the form of 2 resistances and 2 supports.
2. _____STOCHRSI-SR
Using the general stochastic and Wilder's RSI calculations,
Detect changes in overbought and oversold areas
It overlays the chart in the form of 1 resistance and 1 support.
3. _____PV-SR
Pivot-based support and resistance will be overlaid on the chart,
By default, 10 pivot lines are drawn, but by modifying the count in the input menu,
You can modify the number of overlays.
4. _____FVG
'Fair value gaps' refers to gaps within consecutive candles.
This section is overlaid in the form of a box,
The default is to draw 10 FVG boxes, but set count in the input menu.
You can modify the number of overlays by editing.
5. _____ZIGZAG
This is to find MDRP by overlaying the low and high prices of the current trend on the chart.
ZIGZAG labels near supports and resistances of 1, 2, 3 and 4 can increase the reliability of the MDRP.
The default value of live in the input menu is true, but if it is false, the closing price is checked and drawn.
Reduce false signals.
6. _____ICHIMOKU
The 5 lines of ICHIMOKU were overlaid with the default values of 9, 26, 52, 26,
Lines other than LeadLine A and B that are overlaid on the chart are overlaid on the chart only as much as the period value of each line.
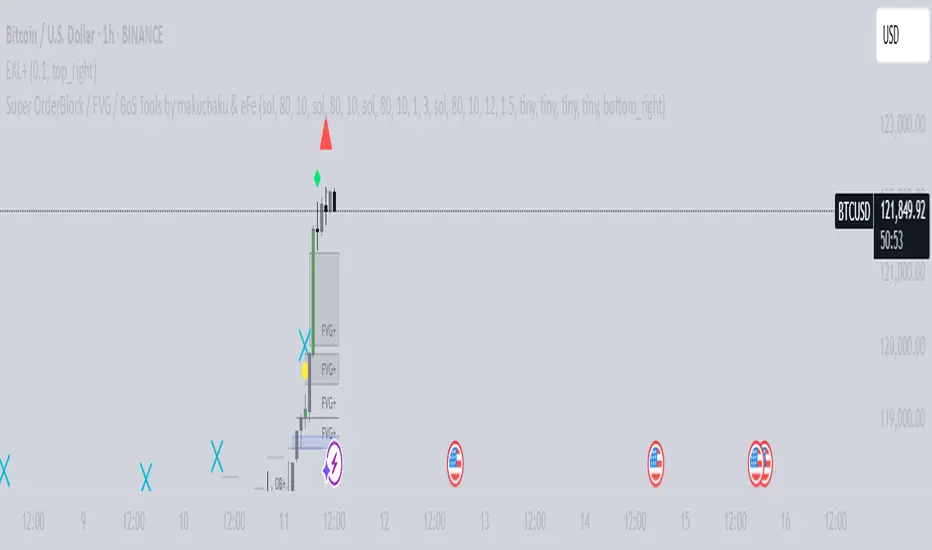
* The _____FVG indicator cited the source of 'makuchaku'.
------------------------------------------------------------------------------------------------------------------------------------------------------------------------
이 지표는 'Momentum Discrepancy Reversal Point' = 'MDRP'를
찾기 위해 여러개의 일반적 지표들을 혼합, 수정하여 지지와 저항의 형태로
차트에 overlay 시켜 트렌드의 변화 지점을 예측 하기 위해 만들어졌습니다.
4개의 지지와 저항선은 실시간으로 그려지게 되며, 변화된 지지와 저항은 기존의
선을 지우고 새로운 선으로 다시 표시 됩니다.
각 지지와 저항은 input 메뉴에서 색 또는 선의 두께, 표현할 개수 등을 수정할 수 있습니다.
1. _____RSI-SR
Wilder's RSI 계산식을 기반으로 과매수, 과매도 영역에서의
변화를 감지하여 2개의 저항과 2개의 지지의 형태로 차트에 표시 됩니다.
2. _____STOCHRSI-SR
일반적 스토캐스틱과 Wilder's RSI의 계산식을 이용하여
과매수, 과매도 영역에서의 변화를 감지하여
1개의 저항과 1개의 지지의 형태로 차트에 표시됩니다.
3. _____PV-SR
Pivot을 기반으로 한 지지와 저항을 차트에 표시 하게 되며,
기본값은 10개의 Pivot선이 그려지게 되지만 input 메뉴에서 count를 수정하여
표시할 개수를 수정할 수 있습니다.
4. _____FVG
'Fair value gaps'는 연속된 캔들 안에서의 갭 구간을 말합니다.
이 구간을 박스의 형태로 표시한 것이며,
기본값은 10개의 FVG 박스가 그려지게 되지만 input 메뉴에서 count를
수정하여 표시할 개수를 수정할 수 있습니다.
5. _____ZIGZAG
현재 트렌드의 저가와 고가를 차트에 표시하여 MDRP를 찾기 위한 것으로
1, 2, 3, 4의 지지와 저항 부근에서의 ZIGZAG 라벨은 MDRP의 신뢰도를 높혀줄 수 있습니다.
input 메뉴에서의 live 기본값은 체크되어 있지만 체크를 해제하면 종가를 확인하고 그려지기에
거짓 신호를 줄일 수 있습니다.
6. _____ICHIMOKU
ICHIMOKU의 5개의 선은 기본값인 9, 26, 52, 26으로 표시하였으며,
차트에 표시되는 선행스팬 1과 2를 제외한 전환선, 기준선, 후행스팬은 각 선의 기간값만큼만 차트에 표시 되게 하였습니다.
FairValueGap FVGWhat is a Fair Value Gap or a Gap?
There may be different explanation or reasons of gaps In Forex, my knowledge says that gaps are not very common and they are filled when ever market gets an opportunity to fill. I am trying to figure out the fair Value gap through this indicator.
Gaps are sharp breaks in price with no trading occurring in between. Gaps can happen moving up or moving down. In the forex
market, gaps primarily occur over the weekend because it is the only time the forex market closes. Gaps may also occur on very
short timeframes such as a one-minute chart or immediately following a major news announcement.
How I calculated the gaps Value?
Calculation Method of Gap used is when (low_bar(current bar)-high_bar(two bars back))>0 and (low_bar(two bars back)-high_bar(current bar))>0
The gaps are represented by the Orange and Lime color Bar height.
Do the gaps need to be filtered?
This is the most important part according to me.
Yes, the gaps need to be filtered, Since there are may gaps one after another ,In This Indicator i have used a logic to filter out unnecessary Gaps.
you will be seeing only major Important gaps which you need to focus on.
How gaps Helps?
Gaps sometimes result in corrective price action. In other words, after the gap occurs prices have a tendency to reverse and “fill” the gap.
This is what is look for.
How to use the setting of the indicator and what do they represent?
This indicator setting has 4 options
1.plot major Filtered FVG of Bullish Candles
When you check this option all major FGV will be filtered based on my logic of filtering the gaps
2.plot major Filtered FVG of Bearish Candles
When you check this option all major FGV will be filtered based on my logic of filtering the gaps
3.Plot Bar size representing the GAPS
The bars(lime and orange color) in front of candle bars are the size of the gap.
4.Plot Lines representing the GAPS
You can also visualize the recent gaps through lines , you will be able to see only 3 to 5 recent gaps through line.(not able to plot
all gaps through line because of the limit, so gaps are represented by the orange and lime color bars)
You can also change the resolution in setting of the indicator to get different time frame FGV.
Thanks to mickey1984 for guiding and helping for this concept idea.
Have any question Feel free to ask?

OB/FVG Precision Overlap ZonesThis indicator highlights only the zones where Order Blocks (OBs) and Fair Value Gaps (FVGs) overlap, filtering out weaker signals. By focusing on these confluence areas, it helps identify higher-probability entries and cleaner risk to reward setups.

NQ Liquidity + Inverse FVG Strategy Alertsuses inversion FVG's and targets NQ liquidity
hhsajdhds
d
d
d
d
sa
s
a
s
dgasjjekkje
j
k

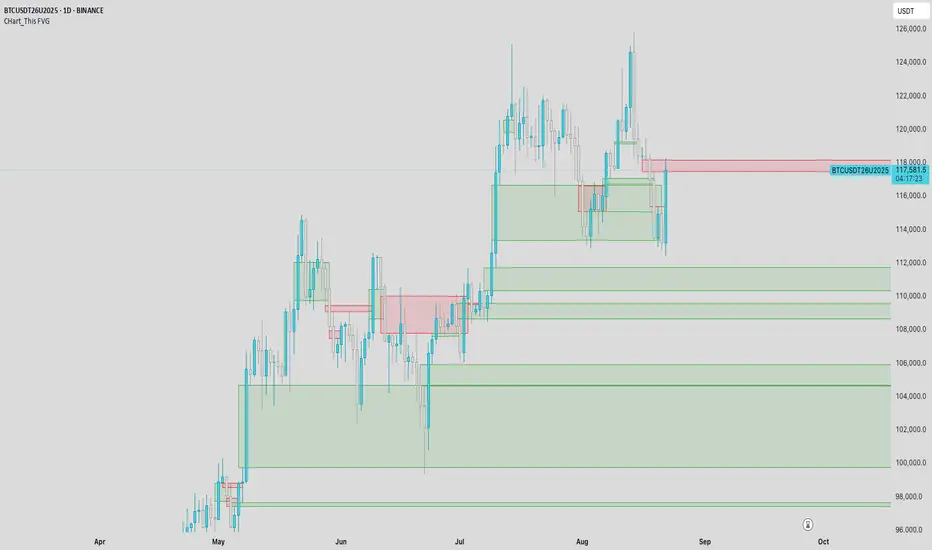
CHart_This FVGThis script will work on any time frame, and auto plots the classic ICT "fair value gaps", or imbalances, that result from a three candle formation wherein the middle candle body extends beyond the highs and lows of the end candles, leaving no overlap of the first and last candle wicks. Bullish imbalances are green, and bearish are red. Plotted zones will automatically close once a candle closure fully violates the imbalance zone with a close beyond its borders.

SB - FVGThis indicator shows structure breaking FVGs and other interesting staff like OB and pivot levels.