XAU 1H Clean Confluence — Micro Table v2XAU 1H Clean Confluence — Micro Table
What it is
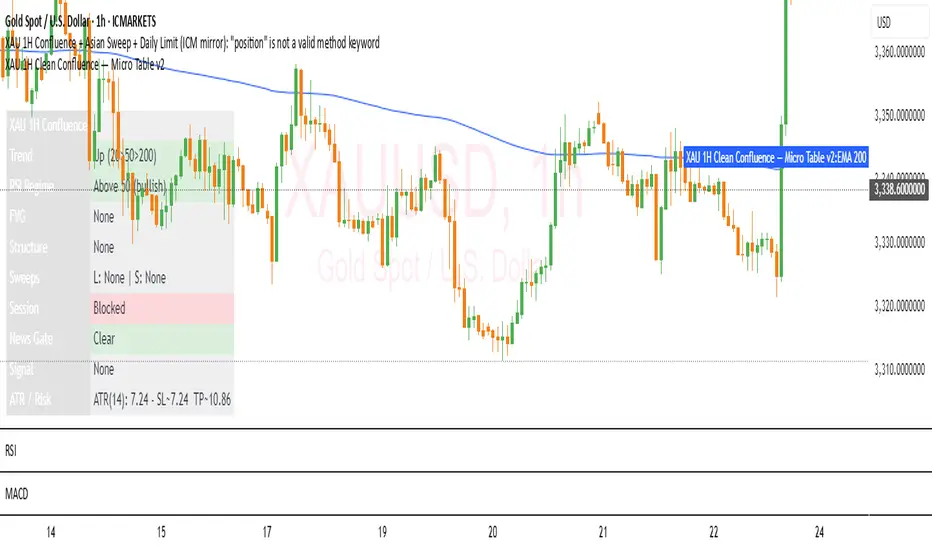
A clean, low-clutter 1-hour XAUUSD indicator that summarizes confluences in a compact on-chart table. It’s designed for traders who want structure + momentum + location without covering the chart in drawings.
Best used on: ICMARKETS:XAUUSD or your broker’s XAUUSD feed, 1H timeframe.
Style: Table-only by default (optional EMA200 line and tiny signal markers).
How signals are built (long example; shorts mirror)
A Long Confluence is printed when all of the below are true:
Trend alignment: EMA20 > EMA50 > EMA200
Pullback & re-engage: price crossed back above EMA20 after a pullback
RSI regime: RSI(14) crosses up through 50 (trend confirmation)
Displacement/imbalance: a 3-candle Bull FVG exists (low > high )
Structure: either a BOS up or CHOCH up via swing pivots (pivotLen input)
Sweep (optional): if enabled, require a sweep of Asian Low and/or PDL first
Time gating (optional): only during London/NY windows and outside news windows
Short signals use the mirrored conditions (EMA stack down, cross back below EMA20, RSI cross down through 50, Bear FVG, BOS/CHOCH down, optional Asian High/PDH sweep).
在腳本中搜尋"fvg"
QAIS Advanced Liquidity Hunter [HYBRID ALERT]I Qais Shah from Kalmeshwar, Nagpur. Have Unlock Institutional-Grade Strategies with the Advanced Liquidity Hunter
This powerful indicator is designed for serious traders seeking to capitalize on the same market mechanics used by institutional players. The Advanced Liquidity Hunter identifies high-probability reversal setups by detecting key market events: Liquidity Sweeps, Fair Value Gaps (FVG), and RSI Divergence, all filtered through a multi-timeframe analysis for maximum confluence.
🔍 What This Indicator Does:
Detects Liquidity Sweeps: Finds precise moments where price aggressively sweeps beyond a recent swing high or low to trigger stop orders (liquidity) and then rejects back into the range—a classic sign of institutional activity.
Identifies Fair Value Gaps (FVG): Highlights imbalanced areas on the chart where price is likely to return, providing excellent entry zones.
Multi-Timeframe RSI Divergence: Confirms momentum shifts by analyzing divergence not just on your current chart, but also on the higher 1-hour timeframe for stronger, more reliable signals.
Volume Spike Confirmation: Ensures the move is validated by a significant increase in trading volume, separating genuine moves from false breakouts.
Smart Alert System: Sends direct alerts to your phone or email when a perfect confluence of conditions is met, so you never miss a setup.
⚙️ How to Use It:
This is a Hybrid Quant-Discretionary tool. It does the heavy lifting of scanning the markets 24/7, but it requires your expert discretion for final execution.
Wait for the Alert: The indicator will send an alert when a high-quality setup is detected.
Confirm on Higher Timeframe (HTF): Open the chart. Check that the signal aligns with a major HTF support/resistance level, trend, or order block.
Execute Your Plan: Manually enter the trade using the provided logic, ensuring you implement strict risk management (1-2% of capital per trade).
🎯 Ideal For:
Swing Traders and Day Traders looking for high-quality, high-probability entries.
Those who understand and trade based on market structure, liquidity, and order flow.
Traders who prefer a disciplined, alert-based system over emotional decision-making.
📊 Key Features:
Fully Customizable: Adjust all parameters (ATR multiplier, RSI length, volume spike) to fit your trading style and the current market volatility.
Clear Visuals: Easy-to-see triangles and crosses plot the exact entry points and liquidity sweeps directly on your chart.
Non-Repainting: The logic uses confirmed closing prices to ensure signals do not repaint.
Disclaimer: This tool is designed to identify high-probability opportunities, not guaranteed wins. Always practice proper risk management and backtest the strategy before using real capital. Past performance is not indicative of future results.
XAUUSD Strength Dashboard with VolumeXAUUSD Strength Dashboard with Volume Analysis
📌 Description
This advanced Pine Script indicator provides a multi-timeframe dashboard for XAUUSD (Gold vs. USD), combining price action analysis with volume confirmation to generate high-probability trading signals. It detects:
✅ Break of Structure (BOS)
✅ Fair Value Gaps (FVG)
✅ Change of Character (CHOCH)
✅ Trendline Breaks (9/21 SMA Crossover)
✅ Volume Spikes (Confirmation of Strength)
The dashboard displays strength scores (0-100%) and action recommendations (Strong Buy/Buy/Neutral/Sell/Strong Sell) across multiple timeframes, helping traders identify confluences for better trade decisions.
🎯 How It Works
1. Multi-Timeframe Analysis
Fetches data from 1m, 5m, 15m, 30m, 1h, 4h, Daily, and Weekly timeframes.
Compares trend direction, BOS, FVG, CHOCH, and volume spikes across all timeframes.
2. Volume-Confirmed Strength Score
The Strength Score (0-100%) is calculated using:
Trend Direction (25 points) → 9 SMA vs. 21 SMA
Break of Structure (20 points) → New highs/lows with momentum
Fair Value Gaps (10 points) → Imbalance zones
Change of Character (10 points) → Shift in market structure
Trendline Break (20 points) → SMA crossover confirmation
Volume Spike (15 points) → High volume confirms moves
Score Interpretation:
≥75% → Strong Buy (High confidence bullish move)
60-74% → Buy (Bullish but weaker confirmation)
40-59% → Neutral (No strong bias)
25-39% → Sell (Bearish but weaker confirmation)
≤25% → Strong Sell (High confidence bearish move)
3. Dashboard & Chart Markers
Dashboard Table: Shows Trend, BOS, Volume, CHOCH, TL Break, Strength %, Key Level, and Action for each timeframe.
Chart Markers:
🟢 Green Triangles → Bullish BOS
🔴 Red Triangles → Bearish BOS
🟢 Green Circles → Bullish CHOCH
🔴 Red Circles → Bearish CHOCH
📈 Green Arrows → Bullish Trendline Break
📉 Red Arrows → Bearish Trendline Break
"Vol↑" (Lime) → Bullish Volume Spike
"Vol↓" (Maroon) → Bearish Volume Spike
🚀 How to Use
1. Dashboard Interpretation
Higher Timeframes (D/W) → Show the dominant trend.
Lower Timeframes (1m-4h) → Help with entry timing.
Strength Score ≥75% or ≤25% → Look for high-confidence trades.
Volume Spikes → Confirm breakouts/reversals.
2. Trading Strategy
📈 Long (Buy) Setup:
Higher TFs (D/W/4h) show bullish trend (↑).
Current TF has BOS & Volume Spike.
Strength Score ≥60%.
Key Level (Low) holds as support.
📉 Short (Sell) Setup:
Higher TFs (D/W/4h) show bearish trend (↓).
Current TF has BOS & Volume Spike.
Strength Score ≤40%.
Key Level (High) holds as resistance.
3. Customization
Adjust Volume Spike Multiplier (Default: 1.5x) → Controls sensitivity to volume spikes.
Toggle Timeframes → Enable/disable higher/lower timeframes.
🔑 Key Benefits
✔ Multi-Timeframe Confluence → Avoids false signals.
✔ Volume Confirmation → Filters low-quality breakouts.
✔ Clear Strength Scoring → Removes emotional bias.
✔ Visual Chart Markers → Easy to spot key signals.
This indicator is ideal for gold traders who follow institutional order flow, market structure, and volume analysis to improve their trading decisions.
🎯 Best Used With:
Support/Resistance Levels
Fibonacci Retracements
Price Action Confirmation
🚀 Happy Trading! 🚀

smcCore Positioning
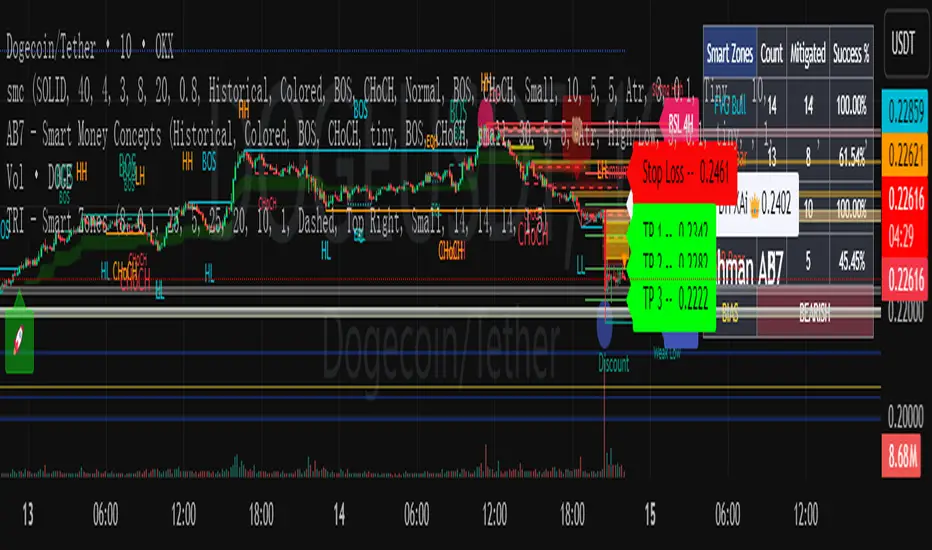
A comprehensive trading tool integrating trend tracking, price action, and Smart Money Concepts (SMC). Suitable for multiple assets like cryptocurrencies and forex, it specializes in scalping and swing trading, directly usable on the TradingView platform.
Key Features
Trend Identification
Supertrend: Generates buy/sell signals (🚀 for long, 🐻 for short) when price crosses the trend channel, indicating trend direction.
Cirrus Cloud: Green denotes bullish trends, red for bearish trends, visually reflecting trend strength.
Market Structure Analysis
Identifies BOS (Break of Structure) and CHoCH (Change of Character) to mark short-term (internal structure) and long-term (swing structure) price turning points.
Order Blocks (OB) & Fair Value Gaps (FVG): Highlights institutional capital concentration zones and price gaps, signaling potential support/resistance levels.
Risk Management
Automatically calculates 3 take-profit levels (TP1-TP3) and 1 stop-loss (SL), dynamically adjusted based on ATR. Specific prices and lines are displayed on the chart.
Auxiliary Tools
ADX Indicator: Judges trend strength; purple marks sideways ranges (low signal reliability).
Multi-timeframe compatibility: Optimized for 15-minute charts to adapt to high volatility in cryptocurrencies, with adjustable parameters to filter noise.
Use Cases
Scalping: Combine 15-minute FVG fills and order block breakouts for quick entries/exits.
Swing Trading: Leverage trend cloud + structure breakout signals to capture medium-term trends.
Suitability: Ideal for traders comfortable with short-term volatility and basic technical analysis.
MistaB SMC Navigation ToolkitMistaB SMC Navigation Toolkit
A complete Smart Money Concepts (SMC) toolkit designed for precision navigation of market structure, order flow, and premium/discount trading zones. Perfect for traders following ICT-style concepts and multi-timeframe confluence.
Features
✅ Order Blocks (OBs)
• Automatic bullish & bearish OB detection
• Optional displacement & high-volume filters
• Midline display for quick equilibrium view
• Auto-expiry and broken OB cleanup
✅ Fair Value Gaps (FVGs)
• Bullish & bearish gap detection
• HTF bias filtering for higher accuracy
• Compact boxes with labels
• Automatic removal when filled
✅ Market Structure (BoS / CHoCH)
• Fractal-based swing detection
• Break of Structure & Change of Character labeling
• Dynamic HTF bias dimming
✅ Premium / Discount Zones
• Auto-calculated mid-level
• Highlighted zones for optimal trade placement
✅ Higher Timeframe (HTF) Confirmation
• Configurable confirmation timeframe
• On-chart HTF status label (Bullish / Bearish / Not Required)
✅ Automatic Cleanup System
• Fast or delayed cleanup for expired/broken zones
• Dimmed colors for invalidated levels
How to Use
Set your preferred HTF in the settings.
Look for OB/FVGs aligned with HTF bias.
Enter in discount zones for longs or premium zones for shorts.
Confirm with BoS / CHoCH signals before entry.
Manage trades towards opposing liquidity zones or HTF levels.
Disclaimer
This indicator is for educational purposes only. It does not provide financial advice or guarantee future results. Always practice proper risk management and test thoroughly before live trading.

MistaB SMC Navigation Toolkit MistaB SMC Navigation Toolkit
A complete Smart Money Concepts (SMC) toolkit designed for precision navigation of market structure, order flow, and premium/discount trading zones. Perfect for traders following ICT-style concepts and multi-timeframe confluence.
Features
✅ Order Blocks (OBs)
• Automatic bullish & bearish OB detection
• Optional displacement & high-volume filters
• Midline display for quick equilibrium view
• Auto-expiry and broken OB cleanup
✅ Fair Value Gaps (FVGs)
• Bullish & bearish gap detection
• HTF bias filtering for higher accuracy
• Compact boxes with labels
• Automatic removal when filled
✅ Market Structure (BoS / CHoCH)
• Fractal-based swing detection
• Break of Structure & Change of Character labeling
• Dynamic HTF bias dimming
✅ Premium / Discount Zones
• Auto-calculated mid-level
• Highlighted zones for optimal trade placement
✅ Higher Timeframe (HTF) Confirmation
• Configurable confirmation timeframe
• On-chart HTF status label (Bullish / Bearish / Not Required)
✅ Automatic Cleanup System
• Fast or delayed cleanup for expired/broken zones
• Dimmed colors for invalidated levels
How to Use
Set your preferred HTF in the settings.
Look for OB/FVGs aligned with HTF bias.
Enter in discount zones for longs or premium zones for shorts.
Confirm with BoS / CHoCH signals before entry.
Manage trades towards opposing liquidity zones or HTF levels.
Disclaimer
This indicator is for educational purposes only. It does not provide financial advice or guarantee future results. Always practice proper risk management and test thoroughly before live trading.

PA Buy Sell : By Josh Sniper Laos – PROPA Buy : Sell : By Josh Sniper Laos
อินดี้วิเคราะห์พฤติกรรมราคา (Price Action) และรูปแบบแท่งเทียน (Candlestick Patterns) พร้อมสัญญาณ Buy/Sell และคำอธิบายแนวโน้มภาษาไทย
💡 แนวคิดการทำงาน
อินดี้นี้ออกแบบมาเพื่อให้เทรดเดอร์สามารถ อ่านพฤติกรรมราคาได้อย่างรวดเร็ว ผ่านการตรวจจับแท่งเทียนสำคัญ และให้สัญญาณพร้อมคำอธิบายแนวโน้มทันที โดยสามารถเลือกได้ว่าจะรอให้แท่งปิดก่อน หรือให้สัญญาณทันทีแบบ Real-time
🔍 ฟีเจอร์หลัก
ตรวจจับ Candlestick Patterns ครอบคลุมกว่า 15 แบบ
Bullish Engulfing, Bearish Engulfing
Hammer, Inverted Hammer
Morning Star, Evening Star
Bullish Harami, Bearish Harami
Three White Soldiers, Three Black Crows
Piercing Pattern, Dark Cloud Cover
Belt Hold (Bull/Bear)
Kicker Pattern (Bull/Bear)
Tweezer Top, Tweezer Bottom
และแพทเทิร์นสำคัญอื่น ๆ
คำอธิบายแนวโน้มเป็นภาษาไทย
เช่น “แนวโน้มขาขึ้น – มีแรงซื้อชัดเจน” หรือ “แนวโน้มขาลง – มีแรงขายกดดัน”
เหมาะสำหรับมือใหม่ที่ยังไม่ชำนาญการอ่านแท่งเทียน
ปรับแต่งสีของตัวหนังสือได้
สามารถตั้งสีสัญญาณ Buy/Sell ให้เข้ากับธีมกราฟของคุณได้ทันที
เลือกโหมดสัญญาณ
รอปิดแท่งก่อน เพื่อความแม่นยำ
ไม่รอปิดแท่ง เพื่อรับสัญญาณเร็ว (เหมาะกับสาย Scalping)
โหมดแสดงผล
แสดงเป็นไอคอน Buy/Sell บนกราฟ
หรือแสดงพร้อมคำอธิบายประกอบ
🧠 วิธีใช้
Buy: ใช้เมื่อขึ้นสัญญาณ Bullish พร้อมคำอธิบายแนวโน้มสนับสนุน เช่น Bullish Engulfing หรือ Morning Star ในโซนสนับสนุน (Support)
Sell: ใช้เมื่อขึ้นสัญญาณ Bearish พร้อมคำอธิบายแนวโน้มสนับสนุน เช่น Bearish Engulfing หรือ Evening Star ในโซนต้าน (Resistance)
ใช้ร่วมกับเครื่องมืออื่น ๆ เช่น เส้นแนวโน้ม, OB/FVG, หรือ RSI เพื่อเพิ่มความแม่นยำ
📌 Indicator Name
PA Buy : Sell : By Josh Sniper Laos
Price Action & Candlestick Pattern Analyzer with Buy/Sell Signals + Trend Description in English & Thai.
💡 Concept
This indicator is designed to help traders read price action instantly by detecting key candlestick patterns and providing clear Buy/Sell signals along with trend descriptions.
You can choose between waiting for bar close for higher accuracy or real-time alerts for faster reactions.
🔍 Key Features
Covers 15+ Major Candlestick Patterns
Bullish Engulfing, Bearish Engulfing
Hammer, Inverted Hammer
Morning Star, Evening Star
Bullish Harami, Bearish Harami
Three White Soldiers, Three Black Crows
Piercing Pattern, Dark Cloud Cover
Bull/Bear Belt Hold
Bull/Bear Kicker Pattern
Tweezer Top, Tweezer Bottom
And more…
Bilingual Trend Descriptions (English + Thai)
Example: “Bullish Trend – Strong Buying Pressure”
Example: “แนวโน้มขาขึ้น – มีแรงซื้อชัดเจน”
Perfect for both beginners and advanced traders.
Customizable Text Colors
Easily match your chart theme for better visibility.
Signal Mode Options
Wait for Candle Close – Higher accuracy, reduced false signals.
No Wait (Real-Time) – Faster entry signals, great for scalping.
Flexible Display Modes
Icons only (Buy/Sell)
Icons + Text description for more context
🧠 How to Use
Buy: When a Bullish signal appears along with a supportive trend description, e.g., Bullish Engulfing or Morning Star at a key Support zone.
Sell: When a Bearish signal appears along with a supportive trend description, e.g., Bearish Engulfing or Evening Star at a Resistance zone.
Combine with market structure, Support/Resistance, OB/FVG, or RSI for better precision.

Estrategia de NY ORB por CPThis strategy marks the New York market opening range during the first 15 minutes and confirms a buy or sell entry once the price returns and retests that range. It’s designed to capture trades of 60 points or more after the range has been retested. I suggest complementing the strategy with an indicator that highlights FVGs (Fair Value Gaps) or order blocks to better understand what price is doing and where it’s heading.
esta estrategia te marca el rango de apertura del mercado de ny de los primeros 15 minutos y te confirma entrada en venta o compra una vez que el precio regrese y retestee el rango. esta diseñada para tener trades de 60 puntos o mas una vez que el rango sea retesteado. sugiero acompañar la estrategia con algun indicador que marque fvg o order blocks para tener una mejor de lo que el precio esta haciendo y hacia donde se dirige.

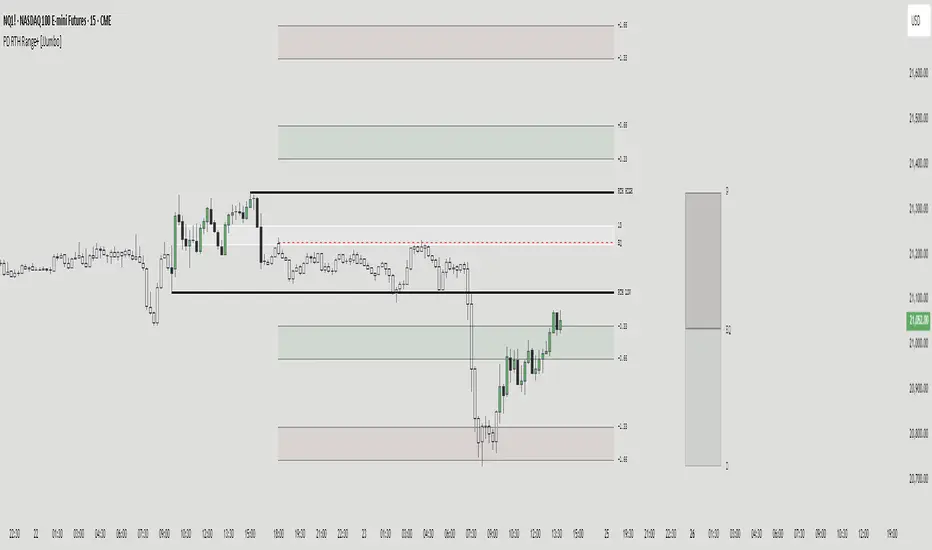
PD RTH Range+ [JJumbo]Introduction:
The PD RTH Range+ indicator is a powerful tool designed to visualize and track previous day and previous day's Regular Trading Hours (RTH) ranges for futures markets. This indicator identifies and plots automatically key price levels established during standard US trading hours (9:30 AM - 4:15 PM ET "RTH") and Globex hours, helping traders identify important key levels and fair value zones.
Just like my other time based range indicator "SDRange+" it works around the same idea but with a different context and different ranges in use, range deviations are still a big part in this framework.
Key features:
Range functions and plot modes:
This tool is equipped with two modes "RTH" range and "Previous day" range, which help you visualize previous day's points of interest and swing high and low essentially helping you framing the current day's daily candle in relation to previous day ranges both RTH and previous day.
Projections feature:
The projection feature in the tool also has two plot modes "Fixed" and "Custom", the Fixed mode projections make use of the rule of thirds (just like the SDRange+) but with two areas 0.33-0.66 and 1.33-1.66, here is where most deviations happen and price exhausts above/below the range.
These are your actionable areas to expect price lose momentum and retrace back into the range.
Dynamic Premium&Discount visualization:
This feature will allow you to identify fair value and equilibrium at current price dynamically updating until out projections or levels have been met and and swing high/low has formed, helping you identify the equilibrium of the market at the current state and where premium or discounted prices are.
Automatic First presentation Fair Value Gap:
A concept idea originated from The Inner Circle Trader (ICT), the feature in the indicator will automatically plot the first presented fair value gap (first FVG present of Regular trading hours) dynamically changing time-frame as well, showing the first presented FVG in any time frame you are visualizing.
This can be used as you area of action as well or targets (during RTH hours).
ETH (Eletronic Trading Hours) candles transparency:
This feature is important for define ETH and RTH hours, removing the color out of the the ETH hours candles helping visualize better the RTH hours, which is where you want base your trading day on.
Customizable inputs:
Fully customizable aesthetics in the input menu
How can traders use this framework and tool effectively in their trading:
Trading range sequences:
This framework is based on IF-THEN statements sequences, it will generate your daily bias by following the sequences.
Sequences: EQ > high/low, high/low > EQ,EQ > fixed projections, fixed projections >EQ.
When following these sequences, you will easily find you daily direction, which are also data-backed by statistics (you can see about it in my X profile, you will find the link in my Trading View profile)
Trading retracements/reversals:
Retracements are often taken from the projections areas until Equilibrium of the dynamic premium and discount feature in the indicator, often participating in the moves to fair value from the deviation of the range.
Reversals are often taken from the projections areas until opposing levels of the range (EQ or high/low)
Terms & Conditions
Our charting tools are products provided for informational and educational purposes only and do not constitute financial, investment, or trading advice. Our charting tools are not designed to predict market movements or provide specific recommendations. Users should be aware that past performance is not indicative of future results and should not be relied upon for making financial decisions. By using our charting tools, the purchaser agrees that the seller and the creator are not responsible for any decisions made based on the information provided by these charting tools. The purchaser assumes full responsibility and liability for any actions taken and the consequences thereof, including any loss of money or investments that may occur as a result of using these products. Hence, by purchasing these charting tools, the customer accepts and acknowledges that the seller and the creator are not liable nor responsible for any unwanted outcome that arises from the development, the sale, or the use of these products. We hold no reimbursement, refund, or chargeback policy. Once these Terms and Conditions are accepted by the Customer, before purchase, no reimbursements, refunds or chargebacks will be provided under any circumstances.
By continuing to use these charting tools, the user acknowledges and agrees to the Terms and Conditions outlined in this legal disclaimer.
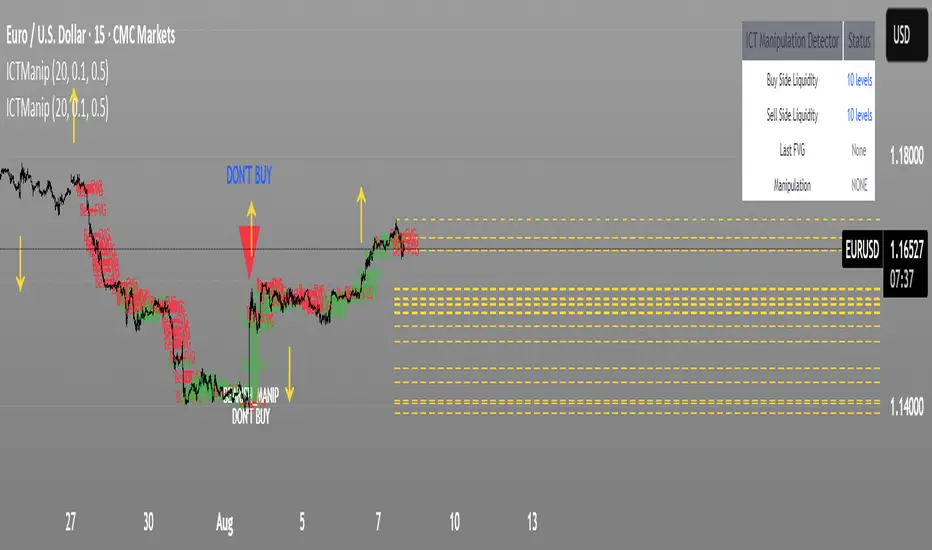
ICT Manipulation DetectorThis indicator detects ICT-style manipulations, liquidity sweeps (stop hunts), and Fair Value Gaps (FVG) automatically on the chart.
🔍 What It Does:
Identifies key highs and lows as liquidity zones.
Detects stop hunts above highs or below lows.
If the price move is large enough, marks it as a manipulation.
Highlights Fair Value Gaps (FVGs) where price might return.
Shows all events visually with boxes, lines, and alerts.
📌 Visuals:
🟩 Green box = Bullish manipulation → “DON’T SELL”
🟥 Red box = Bearish manipulation → “DON’T BUY”
🟨 Yellow dashed lines = Liquidity levels
🔼 / 🔽 Arrows = Sweeps without full manipulation
In short: It automatically detects and warns you of smart money manipulation based on ICT concepts.
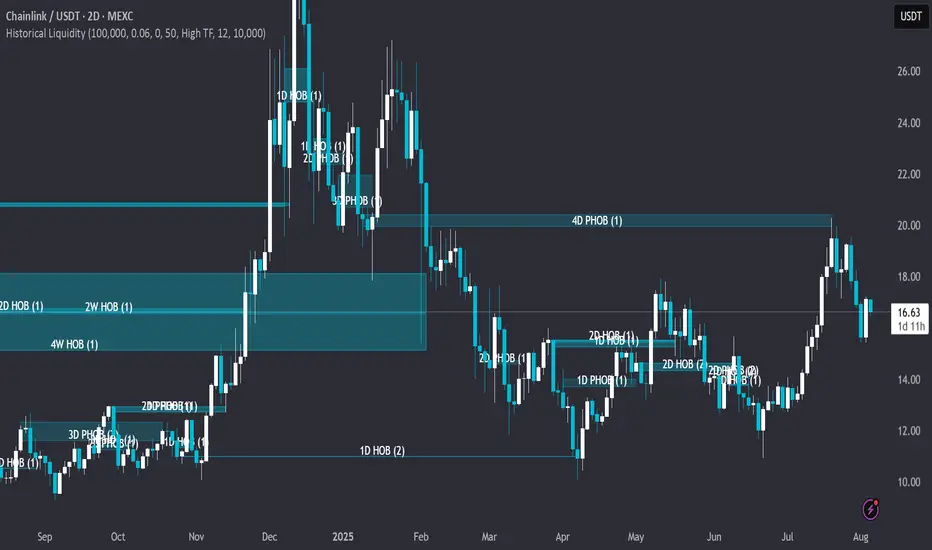
Historical LiquidityHistorical Liquidity Indicator – Backtesting Mitigated Hidden Order Blocks
🟠OVERVIEW: Historical Liquidity Indicator This script is a powerful backtesting tool and companion to our "Hidden Liquidity Indicator." It visualizes mitigated liquidity zones that have already been touched by price action. By showing a historical record of these events, it allows traders to systematically analyze past market structure, evaluate the effectiveness of liquidity zones, and refine their mitigation-based trading strategies.
🟠CORE LOGIC: The Connection to Hidden Liquidity The indicator's core logic is built upon the same proprietary methodology as our "Hidden Liquidity Indicator," which focuses on the relationship between Fair Value Gaps (FVGs) and candle bodies. The central idea is to identify institutional footprints—specifically, where hidden order blocks form—before the price revisits and "mitigates" them.
The process involves two main steps:
1. Detection of Liquidity Zones: The script identifies and classifies a liquidity zone based on specific, rule-based criteria:
o Hidden Order Block (HOB): A strong zone where a candle body fits 100% inside a Fair Value Gap, and is untouched by any wicks. For an HOB to be considered valid, its equilibrium (midpoint) must be crossed by the FVG.
o Partial Hidden Order Block (PHOB): A weaker, but still significant, zone where a candle body fits at least 50% inside the FVG.
2. Tracking Mitigation: The indicator then continuously tracks these detected zones. A zone is considered mitigated when a subsequent candle's wick or body touches or enters at least 50% of that zone.
Once a zone is detected and subsequently mitigated according to these rules, the indicator stores this information and visualizes it historically on the chart. This allows traders to see exactly where and how these hidden liquidity zones influenced past price action.
🟠SETTINGS & CUSTOMIZATION The indicator offers extensive customization to adapt to various trading styles and analysis needs.
• General & Candle Settings:
o Show Partial HOB: Toggle the visibility of Partial Hidden Order Blocks (PHOBs).
o Candle back count: Determines the number of historical bars to be analyzed.
o BB Deviation / BB Min Size Perc: These settings allow for fine-tuning the underlying volatility calculation, which helps in identifying the specific conditions for HOB formation.
o Partial Min Size in FVG Perc: Customizes the percentage (default 50%) required for a candle body to be considered a PHOB.
• Multi-Timeframe (MTF) Analysis: The indicator can check for liquidity zones on different timeframes. Users can select from pre-defined Low, Mid, or High Timeframe sets, or customize which specific timeframes are checked for analysis (e.g., 5m, 15m, 1h, 4h, 1D).
• Color & Visualization:
o HOBs and PHOBs: Users can customize the distinct colors for each type of liquidity zone.
o Box Border: Option to display or hide the border around the detected zones.
o Labels: Customize the color and text size of the labels describing each zone.
🟠PURPOSE & USAGE This indicator is specifically designed for systematic backtesting and strategic development. It is not intended to provide live trading signals. Its value lies in:
• Quantifying Success: It enables traders to measure the success rate of different HOB types across various timeframes and market conditions.
• Post-Mitigation Analysis: Users can analyze price behavior after a mitigation event, e.g., whether it led to continuation, reversal, or a retest.
• Identifying Support/Resistance: It helps to identify historical support and resistance levels that were formed by previously respected liquidity blocks, offering a data-driven alternative to traditional S/R methods.
🟠WHY IT MATTERS This indicator transforms subjective order block analysis into an objective, data-driven process. By providing a clear, visual history of which liquidity zones were actually respected or invalidated by the market, it empowers traders to build and validate their strategies on a foundation of empirical evidence rather than on intuition alone.
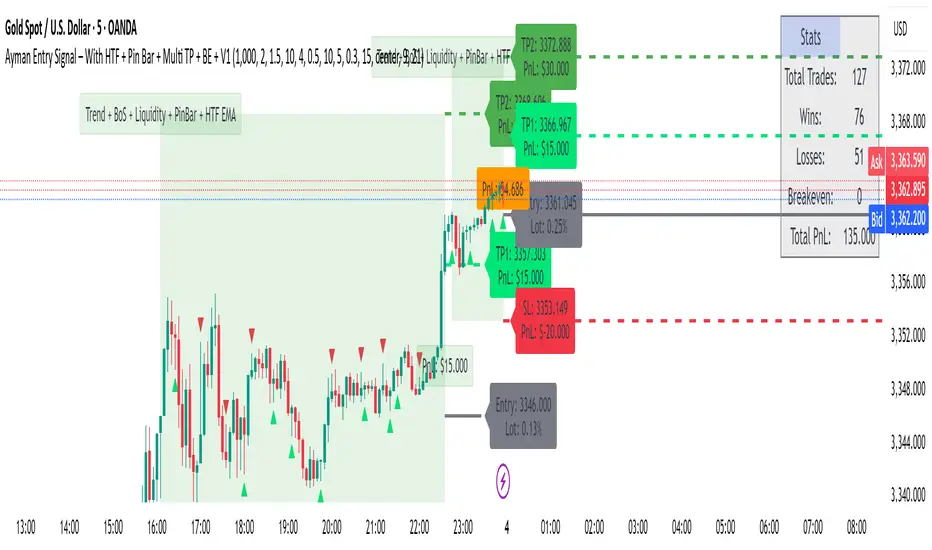
AymaN Entry Signal – With HTF + Pin Bar + Multi TP + BE + V1Ayman Entry Signal – Indicator Description
Overview
Ayman Entry Signal – With HTF + Pin Bar + Multi TP + BE + Stats Panel (V1)
This is a professional-grade Pine Script indicator designed for scalping and intraday trading, with full trade management, multi-confirmation logic, and advanced visualization. The tool is ideal for traders focused on XAUUSD (Gold), Forex, and other volatile instruments who seek both precision entries and structured exits with dynamic risk control.
Main Features
Advanced Entry Logic:
- EMA fast/slow crossovers (configurable)
- Optional conditions: Break of Structure (BoS), Order Block (OB), Fair Value Gap (FVG), Liquidity sweeps, Pin Bars
- HTF confirmation using EMA or BoS
- Real-time entry condition display
Trade Management:
- Dynamic calculation of Entry, SL (with ATR buffer), TP1, TP2
- Supports Partial Close and Break Even logic after TP1
- Visual PnL label (dynamic and color-coded)
Statistics Panel:
- Shows total trades, win/loss/breakeven count, cumulative PnL
- Filter by custom date or session
- Fully customizable panel appearance
Trade Visualization:
- Trade box includes all trade levels (Entry, SL, TP1, TP2)
- Visual display of trade conditions and PnL result
- Option to keep previous trades on chart
Alert System:
- Alerts for Buy and Sell entries
- Compatible with webhook automation systems like MT5/MT4
Customization & Inputs
- Capital & risk per trade
- Value per pip/point
- SL buffer (ATR-based)
- Manual EMA override
- Enable/disable: EMA, BoS, OB, FVG, Liquidity, Pin Bars
- HTF: timeframe + confirmation logic
- Trade box/labels visibility
- Full color customization
- PnL label position: top, center, or bottom
Recommended Use
- Ideal for Gold scalping (XAUUSD), also effective for Forex
- Best on 1m–15m charts; use HTF confirmation from 15m–4H
- Pairs well with semi-automated systems using alerts and webhooks
Disclaimer
Note: This is a non-executing indicator. It does not place trades but provides visual and statistical guidance for professional manual or semi-automated trading.

EURUSD Kill Zone [Plazo Sullivan Roche Capital]EUR/USD Kil Zone
Core Logic: Navigating the New‑York Kill‑Zone
The EUR/USD Killzone is designed to exploit repeatable patterns that occur during the overlap of the London and New‑York trading sessions. Research shows that the New‑York “kill zone”—roughly 07:00–09:00 EST—produces the most dramatic moves in EUR‑ and USD‑linked currency pairs
During this window, large institutions often sweep out liquidity resting above or below the Asian and early‑London session extremes , triggering sharp reversals before a new intraday trend emerges. This is in contrast to the single pre-market sweeps occuring for GOLD/
This modeul uses ICT/Smart Money Concepts to read these patterns and waits for three confirmations before signalling a trade:
Liquidity Sweep & Rejection. Price must spike beyond the combined Asian and early‑London range and then reject that area (a sharp wick and opposite‑coloured candle), signalling that stops have been cleared. The module defines the Asian range from 00:00–05:00 EST and the London range from 02:00–05:00 EST, following the guideline that overlapping sessions produce the greatest volatility
Market Structure Break. It then waits for the 5‑minute price to close beyond the most recent swing high/low (pivot), confirming that a genuine shift in order flow has occurred rather than a simple stop‑run.
Fair‑Value‑Gap (FVG) Re‑Test. Upon the break, the script records the high and low of that 5‑minute “displacement” candle and defines a fair‑value gap—the imbalance between buyers and sellers. Rather than entering immediately, it sets a virtual limit order at the 50 % level of this gap. A trade is only triggered once price retraces to this mid‑point, providing a high‑probability, high‑reward entry.
These three filters help avoid common pitfalls when trading kill zones, such as false breakouts and news‑driven whipsaws. The indicator also monitors higher‑timeframe bias (4‑hour and daily charts) using 50‑ and 200‑period moving averages to gauge whether the intraday signal aligns with the broader trend.
Feature Set
The indicator provides a suite of visual and analytical tools to support disciplined trading:
Session Range Mapping: automatically draws the Asian (00:00–05:00 EST) and London (02:00–05:00 EST) session highs and lows, making it easy to see when price sweeps these levels.
Kill‑Zone Monitoring: a built‑in timer isolates the 07:30–09:00 EST window and limits the indicator to one trade per session to avoid over‑trading.
Pivot‑Break Detection: uses 5‑minute swing highs/lows to confirm that order flow has shifted before looking for entries.
Fair‑Value‑Gap Re‑test: defines an FVG from the displacement candle and waits for a 50 % retrace before triggering a signal. This improves risk‑to‑reward by entering at a discount (for longs) or premium (for shorts).
Higher‑Timeframe Dashboard: displays bullish/bearish/neutral biases on the 4‑hour and daily charts, plus a confidence rating (0–2) indicating how many of these timeframes agree with the signal direction.
Alerts: optional alerts can be configured for buy‑only, sell‑only or either‑direction signals.
Best Practices for Use
Align with Major Volatility Windows. The indicator is most effective during the New‑York kill zone. Avoid trading outside this window, and be aware of high‑impact news (e.g., FOMC announcements) that can distort price action
Check Higher‑Timeframe Bias. Use the dashboard to ensure the intraday signal aligns with the 4‑hour and daily trends. For instance, a long signal that aligns with a bullish daily bias carries higher conviction than one going against it.
Manage Risk Responsibly. Even with multiple filters, no strategy is foolproof. Use stop‑loss orders just beyond the liquidity sweep and size positions appropriately.
Combine with Fundamental Awareness. Check your economic calendar for European and U.S. data releases. If an important release occurs during the kill zone, consider standing aside or reducing risk.
Back‑test and Forward‑Test. Always validate the strategy across different market conditions and broker feeds. Pay attention to how spreads, volatility and news events influence the indicator.
Use as Part of a Toolkit. Consider combining the indicator with other confirmation tools such as momentum oscillators, volume analysis or price‑action patterns to refine entries further. Smart‑Money Concepts often use confluence, not a single signal.
What's in It for You?
The EUR/USD Liquidity Sweep Indicator distils institutional concepts—liquidity hunts, market‑structure shifts and fair‑value gaps—into an intuitive, automated tool. By waiting for a retrace into the displacement candle’s imbalance, it helps capture trades where risk‑to‑reward is skewed strongly in your favour. The dashboard encourages you to trade with the higher‑timeframe trend, and built‑in alerts ensure you never miss an opportunity.
In volatile kill‑zone environments, discipline and patience are vital. This indicator enforces both: it tracks session ranges, confirms structure, waits for a retrace, and triggers only when multiple conditions align. Coupled with sound risk management and your own judgement, it can become a cornerstone of a high‑probability trading plan.
Always remember that markets evolve. Continue to refine the indicator and your strategy as you gather more experience and data. The learning journey never ends, but this tool is designed to accelerate it.

Ayman Entry Signal – With HTF + Pin Bar
A professional and versatile trading indicator combining classic technical analysis with Smart Money Concepts to detect high-probability entry points.
Designed especially for scalping gold and forex pairs on lower timeframes. Fully customizable to suit any trading style.
✅ Key Features:
EMA Trend Confirmation
Break of Structure (BoS) Detection
Order Block Zone Recognition
Fair Value Gap (FVG) Confirmation
Liquidity Sweep Detection
Pin Bar Candlestick Confirmation
Higher Timeframe Confirmation (HTF EMA + HTF BoS)
🎯 Smart Risk Management:
Automatically calculates Stop Loss (SL) and Take Profit (TP) based on the selected timeframe.
Dynamically adjusts lot size based on account capital and risk percentage.
📈 How It Works:
The indicator triggers a Buy or Sell signal only when a selected set of conditions are met, including:
Trend direction (EMA crossover)
Break of structure
Presence within strong supply/demand zones
Confirmation from higher timeframe
Reversal Pin Bar pattern
🛎 Alerts:
Built-in alert system notifies you instantly when a valid Buy or Sell signal is triggered.
⚙️ Customizable Settings:
Risk Percentage
Capital Size
HTF timeframe
Enable/Disable individual filters (EMA, BoS, OB, FVG, Liquidity, Pin Bar, HTF)
📌 Best Timeframes:
1-min, 5-min, and 15-min – especially during high-volume sessions like London or New York.
🔸 Note:
This is not financial advice. Always backtest and use manual confirmations before live trading.
Midnight 30min High/LowMidnight 30min High/Low — Overnight Liquidity Range Tracker
Capture the Overnight Session: A Strategic Level Identification Tool from Professional Trading Methodology
This indicator captures the high and low prices during the critical 30-minute midnight session (12:00-12:30 AM EST) and projects these levels forward as key support and resistance zones. These overnight ranges often contain significant liquidity and serve as crucial reference points for intraday price action, representing areas where institutional activity may have established important levels.
🔍 What This Script Does:
Identifies Critical Overnight Session Levels
- Automatically detects the 12:00-12:30 AM EST session window
- Captures the highest and lowest prices during this 30-minute period
- Projects these levels forward for multiple trading days
Creates Dynamic Support/Resistance Zones
- Extends midnight high/low levels as horizontal lines with customizable projection periods
- Fills the area between high and low to create a visual trading range
- Updates automatically each trading day with new overnight levels
Provides Clear Visual Reference Points
- Optional session start markers (●) highlight when the midnight session begins
- Color-coded lines distinguish between high and low levels
- Transparent fill area creates an easy-to-identify trading zone
Real-Time Level Tracking
- Updates levels in real-time during the active midnight session
- Maintains historical levels for reference and backtesting
- Compatible with data window for precise level values
⚙️ Customization Options:
Extend Days (1-30):** Control how many days forward the levels are projected (default: 5 days)
High Line Color:** Customize the midnight high line color (default: blue)
Low Line Color:** Customize the midnight low line color (default: orange)
Fill Color:** Adjust the transparency and color of the range area (default: light aqua, 80% transparency)
Show Session Markers:** Toggle yellow session start indicators on/off (default: enabled)
💡 How to Use:
Deploy on lower timeframes (1m-15m) for precise level identification and reaction monitoring**
Watch for key price interactions:
- Rejection at midnight high levels (potential resistance)
- Bounce from midnight low levels (potential support)
- Range-bound trading between the high and low levels
Combine with liquidity concepts:
- Monitor for stop hunts above/below these levels
- Look for false breakouts that snap back into the range
- Use as confluence with other ICT concepts like FVGs and Order Blocks
Strategic Applications:
- Range trading between midnight levels
- Breakout confirmation when price closes decisively outside the range
- Support/resistance validation for entry and exit planning
🔗 Combine With These Tools for Complete Market Structure Analysis:
✅ First FVG — Opening Range Fair Value Gap Detector.
✅ ICT Turtle Soup (Liquidity Reversal)— Spot stop hunts and false breakout scenarios
✅ ICT Macro Zones (Grey Box Version)- It tracks real-time highs and lows for each Silver Bullet session
✅ ICT SMC Liquidity Grabs and OBs- Liquidity Grabs, Order Block Zones, and Fibonacci OTE Levels, allowing traders to identify institutional entry models with clean, rule-based visual signals.
Together, these tools create a comprehensive Smart Money Concepts (SMC) framework — helping traders identify, anticipate, and capitalize on institutional-level price movements with precision and confidence during critical overnight sessions.

Mohammad - OBs, BOS, S/R, Elliott Waves & Trend LinesProfessional Trading Indicator System - Technical Analysis Suite
Overview
Advanced technical analysis system integrating ICT/SMC methodologies with classical analysis tools. Features seven analytical components for comprehensive market structure analysis.
Components
1. Order Blocks (ICT/SMC)
Identifies institutional accumulation/distribution zones acting as future support/resistance.
Detection: Automatic identification based on price rejection patterns
Management: Dynamic updates and removal of invalidated blocks
Configuration: Sensitivity levels (High/Medium/Low), ATR-based parameters
Visual: Green support, red resistance with transparency
2. Break of Structure (BOS)
Detects significant structural breaks indicating trend changes.
Method: 5-bar swing point formation
Display: White horizontal lines with labels
Range: 50-bar maximum lookback
3. Support & Resistance
Classical horizontal levels from significant price pivots.
Analysis: 300-bar historical scan
Filter: 10-point duplicate tolerance
Display: Maximum 15 levels within 5% of current price
4. Fair Value Gaps (FVG)
Price inefficiencies that often get filled on return.
Types: Bullish gaps (up) and bearish gaps (down)
Size: Minimum 0.1 ATR or 5 points
Management: Auto-removal when filled
5. Elliott Wave Analysis
Advanced pattern recognition for impulse and corrective waves.
Patterns: 5-wave impulse (1-2-3-4-5), 3-wave corrective (A-B-C)
Adaptive: Auto-adjusts to timeframe (3-10 depth range)
Display: Small dots with large numbers, starts from hidden point 0
6. 45-Degree Momentum Lines
Revolutionary projection system based on consecutive candle sequences.
Bearish Lines (Red):
Trigger: 5+ consecutive red candles
Start: HIGH of first red candle
Labels: B1-B5
Bullish Lines (Green):
Trigger: 5+ consecutive green candles
Start: LOW of first green candle
Labels: T1-T5
Specifications:
Angle: 45° using ATR * 0.15
Extension: 30 bars forward
Display: 5 most recent patterns
7. Classical Trend Lines
Multi-touch diagonal support/resistance detection.
Validation: Minimum touch requirements
Tolerance: ATR-based touch detection
Display: Blue lines with optional labels
Configuration Summary
Global Settings:
Show/hide each component individually
Customizable colors and line widths
Label size options
Performance:
50-bar periodic cleanup
Maximum object limits (500 each)
Conditional processing on bar close
Trading Applications
Scalping: Order Blocks + FVGs + 45° Lines
Day Trading: All components with BOS emphasis
Swing Trading: Elliott Waves + Trend Lines
Position Trading: Major levels + Elliott Waves
Key Strategies:
Use 45° line bounces for entries
Combine Order Blocks with 45° lines for confluence
Confirm BOS breaks with 45° line violations
Place stops beyond projection lines
Technical Requirements
Platform: TradingView Pine Script v5
Minimum: 300 historical bars
Optimal: 15m-4H timeframes
Performance: Moderate CPU usage
Color Scheme
Green: Bullish/Support (#26a69a)
Red: Bearish/Resistance (#ef5350)
White: BOS/S&R lines
Blue: Elliott Waves/Trend Lines
Customizable: 45° projection lines
Risk Disclaimer
Educational tool only. Not financial advice. Combine with risk management and personal analysis. Past performance doesn't guarantee future results. Trading involves substantial risk.

PRO SMC DASHBOARDPRO SMC DASHBOARD - PRO LEVEL
Advanced Supply & Demand / SMC dashboard for scalping and intraday:
Multi-Timeframe Trend: Visualizes trend direction for M1, M5, M15, H1, H4.
HTF Supply/Demand: Shows closest high time frame (HTF) supply/demand zone and distance (in pips).
Smart “Flip” & Liquidity Signals: Flip and Liquidity Sweep arrows/signals are shown only when truly significant:
Near HTF Supply/Demand zone
And confirmed by volume spike or high confluence score
Momentum & Bias: Real-time momentum (RSI M1), H1 bias and fakeout detection.
Confluence Score: Objective score (out of 7) for trade confidence.
Volume Spike, Divergence, BOS: Includes volume spikes, RSI divergence (M1), and Break of Structure (BOS) for both M15 & H1.
Ultra-clean chart: Only valid signals/alerts shown; no spam or visual clutter.
Full dashboard with all signals and context, always visible bottom-right.
Best used for:
Forex, Gold/Silver, US indices, and crypto
Scalping/intraday with fast, clear decisions based on multi-factor SMC logic
Usage:
Add to your chart, monitor the dashboard for valid setups, and trade only when multiple factors align for high-probability entries.
How to Use the PRO SMC DASHBOARD
1. Add the Script to Your Chart:
Apply the indicator to your favorite Forex, Gold, crypto, or indices chart (best on M1, M5, or M15 for entries).
2. Read the Dashboard (Bottom Right):
The dashboard shows real-time information from multiple timeframes and key SMC filters, including:
Trend (M1, M5, M15, H1, H4):
Arrows show up (↑) or down (↓) trend for each timeframe, based on EMA.
Momentum (RSI M1):
Shows “Strong Up,” “Strong Down,” or “Neutral” plus the current RSI value.
RSI (H1):
Higher timeframe momentum confirmation.
ATR State:
Indicates current volatility (High, Normal, Low).
Session:
Detects if the market is in London, NY, or Asia session (based on UTC).
HTF S/D Zone:
Shows the nearest high timeframe Supply or Demand zone, its timeframe (M15, H1, H4), and exact pip distance.
Fakeout (last 3):
Detects recent false breakouts—if there are multiple fakeouts, potential for reversal is higher.
FVG (Fair Value Gap):
Indicates direction and distance to the nearest FVG (Above/Below).
Bias:
“Strong Buy,” “Strong Sell,” or “Neutral”—multi-timeframe, momentum, and volatility filtered.
Inducement:
Alerts for possible “stop hunt” or liquidity grab before reversal.
BOS (Break of Structure):
Recent or live breaks of market structure (for both M15 & H1).
Liquidity Sweep:
Shows if price just swept a key high/low and then reversed (often key reversal point).
Confluence Score (0-7):
Higher score means more factors align—look for 5+ for strong setups.
Volume Spike:
“YES” appears if the current volume is significantly above average—big players are active!
RSI Divergence:
Bullish or bearish divergence on M1—signals early reversal risk.
Momentum Flip:
“UP” or “DN” appears if RSI M1 crosses the 50 line, confirmed by location and other filters.
Chart Signals (Arrows & Markers):
Flip arrows (up/down) and Liquidity markers only appear when price is at/near a key Supply/Demand zone and confirmed by either a volume spike or strong confluence.
No signal spam:
If you see an arrow or LIQ tag, it’s a truly significant moment!
Suggested Trading Workflow:
Scan the Dashboard:
Is the multi-timeframe trend aligned?
Are you near a major Supply or Demand zone?
Is the Confluence Score high (5 or more)?
Check for Signals:
Is there a Flip or LIQ marker near a Supply/Demand zone?
Is volume spiking or a fakeout just occurred?
Look for Reversal or Continuation:
If there’s a Flip at Demand (with high confluence), consider a long setup.
If there’s a LIQ sweep + flip + volume at Supply, consider a short.
Manage Risk:
Don’t chase every signal.
Confirm with your entry criteria and preferred session timing.
Pro Tips:
Highest confidence trades:
When dashboard signals and chart arrows/markers agree, especially with high confluence and volume spike.
Adapt pip distance filter:
Dashboard is tuned for FX and gold; for other assets, adjust pip-size filter if needed.
Use alerts (if enabled):
Set up custom TradingView alerts for “Flip” or “Liquidity” signals for auto-notifications.
Designed to help you make professional, objective decisions—without chart clutter or second-guessing!

Automated Scalping Signals with TP/SL Indicator [QuantAlgo]🟢 Overview
The Automated Scalping Signals with Take Profit & Stop Loss Indicator is a multi-timeframe trading system that combines market structure analysis with directional bias filtering to identify potential scalping opportunities. It detects Points of Interest (POI) including Fair Value Gaps (FVG) and Order Blocks (OB) while cross-referencing entries with higher timeframe exponential moving average positioning to create systematic entry conditions.
The indicator features adaptive timeframe calculations that automatically scale analysis periods based on your chart timeframe, maintaining consistent analytical relationships across different trading sessions. It provides integrated trade management with stop loss calculation methods, configurable risk-reward ratios, and real-time performance tracking through dashboard displays showing trade statistics, bias direction, and active position status.
This advanced system is designed for low timeframe trading, typically performing optimally on 1 to 15-minute charts across popular instruments such as OANDA:XAUUSD , CME_MINI:MES1! , CME_MINI:ES1! , CME_MINI:MNQ1! , CBOT_MINI:YM1! , CBOT_MINI:MYM1! , BYBIT:BTCUSDT.P , BYBIT:ETHUSDT.P , or any asset and timeframe of your preference.
🟢 How It Works
The indicator operates using a dual-timeframe mathematical framework where higher timeframe exponential moving averages establish directional bias through cross-over analysis, while simultaneously scanning for specific market structure patterns on the POI timeframe. The timeframe calculation engine uses multiplication factors to determine analysis periods, ensuring the bias timeframe provides trend context while the POI timeframe captures structural formations.
The structural analysis begins with FVG detection, which systematically scans price action to identify imbalances where gaps exist between consecutive candle ranges with no overlapping wicks. When such gaps are detected, the algorithm measures their size against minimum thresholds to filter out insignificant formations. Concurrently, OB recognition analyzes three-candle sequences, examining specific open/close relationships that indicate potential institutional accumulation zones. Once these structural patterns are identified, the algorithm cross-references them against the higher timeframe bias direction, creating a validation filter that only permits entries aligned with the prevailing EMA cross-over state. When price subsequently intersects these validated POI zones, entry signals generate with the system calculating entry levels at zone midpoints, then applying the selected stop loss methodology combined with the configured risk-reward ratio to determine take profit placement.
To mirror realistic trading conditions, the indicator incorporates configurable slippage calculations that account for execution differences between intended and actual fill prices. When trades reach their take profit or stop loss levels, the algorithm applies slippage adjustments that worsen the exit prices in a conservative manner - reducing take profit fills and increasing stop loss impact. This approach ensures backtesting results reflect more realistic performance expectations by accounting for spread costs, market volatility during execution, and liquidity constraints that occur in live trading environments.
It also has a performance dashboard that continuously tracks and displays comprehensive trading metrics:
1/ Bias TF / POI TF: Displays the calculated timeframes used for bias analysis and POI detection, showing the actual periods (e.g., "15m / 5m") that result from the multiplier settings to confirm proper adaptive timeframe selection
2/ Bias Direction: Shows current market trend assessment (Bullish, Bearish, or Sideways) derived from EMA cross-over analysis to indicate which trade directions align with prevailing momentum
3/ Data Processing: Indicates how many price bars have been analyzed by the system, helping users verify if complete historical data has been processed for comprehensive strategy validation
4/ Total Trades: Displays the cumulative number of completed trades plus any active positions, providing volume assessment for statistical significance of other metrics
5/ Wins/Losses: Shows the raw count of profitable versus unprofitable trades, offering immediate insight into strategy effectiveness frequency
6/ Win Rate: Reveals the percentage of successful trades, where values above 50% generally indicate effective entry timing and values below suggest strategy refinement needs
7/ Total R-Multiple: Displays cumulative risk-reward performance across all trades, with positive values demonstrating profitable system operation and negative values indicating net losses requiring analysis
8/ Average R Win/Loss: Shows average risk-reward ratios for winning and losing trades separately, where winning averages approaching the configured take profit ratio indicate minimal slippage impact while losing averages near -1.0 suggest effective stop loss execution
9/ TP Ratio / Slippage: Displays the configured take profit ratio and slippage settings with calculated performance impact, showing how execution costs affect actual versus theoretical returns
10/ Profit Factor: Calculates the ratio of total winning amounts to total losing amounts, where values above 1.5 suggest robust profitability, values between 1.0-1.5 indicate modest success, and values below 1.0 show net losses
11/ Maximum Drawdown: Tracks the largest peak-to-trough decline in R-multiple terms, with smaller negative values indicating better capital preservation and risk control during losing streaks
🟢 How to Use
Start by applying the indicator to your chart and observe its performance across different market conditions to understand how it identifies bias direction and POI formations. Then navigate to the settings panel to configure the Bias Timeframe Multiplier for trend context sensitivity and POI Timeframe Multiplier for structural analysis frequency according to your trading preference and objectives.
Next, fine-tune the EMA periods in Bias Settings to control trend detection sensitivity and select your preferred POI types based on your analytical preference. Proceed to configure your Risk Management approach by selecting from the available stop loss calculation methods and setting the Take Profit ratio that aligns with your risk tolerance and profit objectives. Complete the setup by customizing Display Settings to control table visibility and trade visualization elements, adjusting UI positioning and colors for optimal chart readability, then activate Alert Conditions for automated notifications on trade entries, exits, and bias direction changes to support systematic trade management.
🟢 Examples
OANDA:XAUUSD
CME_MINI:MES1!
CME_MINI:ES1!
CME_MINI:MNQ1!
CBOT_MINI:YM1!
BYBIT:BTCUSDT.P
BINANCE:SOLUSD
*Disclaimer: Past performance is not indicative of future results. None of our statements, claims, or signals from our indicators are intended to be financial advice. All trading involves substantial risk of loss, not just upside potential. Users are highly recommended to carefully consider their financial situation and risk tolerance before trading.

Path of Least ResistancePath of Least Resistance (PLR)
Concept Overview
The Path of Least Resistance indicator identifies key zones on your chart that act like "muddy" or "sticky" areas where price tends to get bogged down, creating choppy and unpredictable price action. Between these zones lie the "empty spaces" - clear paths where price can move freely with momentum and direction.
The Analogy: Muddy Fields vs Open Roads
Think of your chart like a landscape:
🟫 ZONES (Muddy/Sticky Areas)
Fair Value Gaps (FVGs) from higher timeframes
Pivot wick zones from higher timeframe pivots
Areas where price gets "stuck" and churns
Like walking through thick mud - slow, choppy, unpredictable movement
Price action becomes erratic and difficult to trade
🟢 EMPTY SPACES (Open Roads)
The clear areas between zones
Where price can move freely with momentum
Like driving on an open highway - smooth, directional movement
The "Path of Least Resistance" for price movement
Trading Philosophy
AVOID Trading Within Zones:
Price action is typically choppy and unpredictable
Higher probability of false signals and whipsaws
Like trying to drive through mud - you'll get stuck
TRADE Through the Empty Spaces:
Look for moves that travel between zones
Price tends to move with momentum and direction
Higher probability setups with cleaner price action
Like taking the highway instead of back roads
Zone Types Detected
Fair Value Gaps (FVGs)
Imbalances from higher timeframe candles
Areas where price "owes" a return visit
Often act as magnets, creating choppy price action
Pivot Wick Zones
Upper and lower wicks from higher timeframe pivots
Rejection areas where price previously struggled
Often create resistance/support that leads to choppy movement
Color Coding System
The zones dynamically change color based on current price position:
🔴 RED ZONES : Price is below the zone (bearish context)
🟢 GREEN ZONES : Price is above the zone (bullish context)
🔘 GRAY ZONES : Price is within the zone (neutral/choppy area)
The "Mum Trades" Strategy
The best trades - what we call "Mum trades" (trades so obvious even your mum could spot them) - happen in the empty spaces between zones:
✅ High Probability Characteristics:
Clear directional movement between zones
Less noise and false signals
Higher momentum and follow-through
Cleaner technical patterns
❌ Avoid These Areas:
Trading within the muddy zones
Expecting clean moves through sticky areas
Fighting against the natural flow of price
Key Features
Auto Timeframe Detection : Automatically selects appropriate higher timeframe
Dynamic Zone Management : Overlapping zones are automatically cleaned up
Real-time Alerts : Get notified when price enters/exits zones
Visual Clarity : Clean zone display with extending boundaries
How to Use
Identify the Zones : Let the indicator mark the muddy areas
Find the Paths : Look for clear spaces between zones
Plan Your Trades : Target moves that travel through empty space
Avoid the Mud : Stay away from trading within the zones
Follow the Flow : Trade with the path of least resistance
Remember
Price, like water, always seeks the path of least resistance. By identifying where that path is clear (empty spaces) versus where it's obstructed (zones), you can align your trading with the natural flow of the market rather than fighting against it.
The goal is simple: Trade the highways, avoid the mud.

4-EMA Signals + MTF Analysis4-EMA Signals + MTF Analysis Indicator: User Guide
This indicator is designed for active traders; from scalpers / intra-day traders to swing-traders who simply want an easy to understand, simple, but yet comprehensive and easy-to-understand indicator with a quick overview of initial market momentum and overall market direction to assist the trader in their initial trading.
The main feature of this indicator is that It overlays four exponential moving averages (EMAs), and provides a dashboard of real-time trend signals for both buy and sell (long/short) scenarios.
Settings Overview
MA Period Setup
Custom: Set your own EMA periods.
Conservative, Aggressive, Fibonacci: Quickly apply preset EMA period combinations for different trading styles.
EMA Periods (Custom Setup)
Fast EMA: Shortest EMA, reacts quickly to price (default 7).
Medium-Short EMA: Intermediate speed (default 25).
Medium-Long EMA: Slower, filters out more noise (default 70).
Slow EMA: Longest-term trend (default 200).
(These settings can be adjusted to suit your individual needs)
Main Indicator Features
Four EMAs : Plotted in distinct colors (green, yellow, orange, red) for quick trend recognition - this can be altered in colour to your personal preferences.
Buy/Sell Signals : Triangles appear below/above bars when EMA crossovers occur, optionally filtered by volume - the volume filter when applied greatly reduces the influx of signals, only giving high-quality signals!
Trading Sessions + Backgrounds : A trading session feature has been added: (London, New York, Asia, Sydney) with the choice of a background to indicate each global trading session.
Volume Overlay : Volume bars and a blue volume moving average line for context.
Dashboard Table (Top Right):
Market Direction: Shows the overall EMA alignment (bullish, bearish, weak, consolidating).
The initial trend on the 5m, 15m, 1H, and 4H time-frame to give a quick snapshot of overall trend direction.
How to Use
Trend Identification :
-- Use the EMA alignment and dashboard table to quickly see if the market is bullish, bearish, or consolidating.
EMA Set-up
-- Adjust the EMA settings to your specific requirements, the signals will alter depending on the volatility of the instrument your trading.
Signal Confirmation :
-- ''Buy'' signals simply appear when the faster EMAs cross above slower EMAs in and ''Sell'' signals simply appear when they cross below.
Volume Context :
--Use the volume moving average and the optional volume filter to avoid signals during low-activity periods.
No Repainting :
-- All signals and dashboard readings are calculated using only confirmed, closed bars. What you see in real time is exactly what will appear in your back-test — no repainting or look-ahead bias.
Alerts / Notifications
Now for the fun part:
1. Enable Buy/Sell Signal Alerts: Get notifications when buy or sell signals occur.
2. For Alerts to function correctly, set the ''condition'' to the indicator itself.
3. Select ''EMA Bearish Cross'' or ''EMA Bullish Cross'' depending whether you want alerts for either buy/sell signals - Or one can simply set alerts for both scenarios.
4. For ''Interval'' set to ''Same as chart'' - So, the time-frame which you'd like to trade on.
5. For ''Trigger'' set to ''Once Per Bar Close''.
6. Save.
7. Wait for a signal to occur!
NOTE: Before placing a trade, it's often best to also assess the market conditions at that time also - and not rely solely on the signals, the signals are to assist, and it's often occurred a signal has shown, but a pull-back occurs, and a FVG in discount holds -- it's this FVG holding, accompanied by volume, that's the real entry, possibly.
Tip: For the cleanest results, use the indicator during the most active sessions and always check multi-time-frame trend alignment before entering trades. Good Luck! :)

CandelaCharts - Unicorn Model📝 Overview
The Unicorn Model is an advanced indicator that pinpoints high-probability reversal setups based on the ICT Unicorn formation. It uses a zigzag-based structure to detect engineered liquidity grabs followed by sharp displacements in the opposite direction—ideal for fade entries or the start of new trends.
The indicator is enhanced with macro time filters, allowing it to align model detections with key trading sessions and institutional flow windows.
The ICT Unicorn Model is a precision-driven intraday strategy rooted in smart money concepts. It combines time-of-day sensitivity, engineered liquidity runs, and institutional order flow to uncover high-quality trading opportunities.
📦 Features
Liquidity Levels: Projects forward-looking liquidity zones after a Unicorn model is confirmed, highlighting potential price targets. These zones act as magnet areas where price is likely to be drawn, helping traders manage exits, partials, and re-entries with greater precision.
Unicorn: The Unicorn formation utilizes a smart money framework and a dynamic zigzag detection method to identify engineered liquidity grabs—sharp sweeps of previous highs or lows—followed by impulsive reversals.
Macros: These time-based intervals represent key moments when institutional algorithms are most active, seeking liquidity, rebalancing, or delivering price to key levels like fair value gaps and liquidity pools.
Custom TF Pairing: Choose your preferred combination of entry timeframe and context timeframe. For example, trade 5m setups within a 1h HTF bias, allowing precise alignment of microstructure with broader directional intent.
HTF & LTF PD Arrays: Displays high- and low-timeframe PD Arrays (e.g., Fair Value Gaps, Inversion Fair Value Gaps) that act as zones of interest or rejection, enhancing confluence and risk control.
History: Backtest previous Unicorn setups directly on the chart. Toggle historical models to analyze past behavior, improve your confidence, and fine-tune your trade execution across varying market regimes.
Killzone Filter: Restrict signal generation to specific trading sessions or killzones (e.g., London Open, New York AM). This minimizes false positives in low-volume or overlapping ranges.
Standard Deviation: Dynamically calculates and plots four deviation bands from the model confirmation point. These levels offer insight into stretch targets, volatility bands, and potential mean-reversion zones.
Dashboard: A real-time control panel showing the active model, HTF candle timer, current directional bias, asset name, and session date—offering clarity and fast decision-making at a glance.
⚙️ Settings
Core
Status: Filter models based on status
Bias: Controls what model type will be displayed, bullish or bearish
Fractal: Controls the timeframe pairing that will be used
Length: Sets the maximum number of candles allowed for a model to develop
Labels: Display the model label (e.g., C1, C2, Cn)
Unicorn
Zigzag: Adjusts the length of the Zigzag formation
Breaker: Defines the style of Breaker Blocks
Sweeps
Sweep: Shows the sweep that forms a model
I-sweep: Controls the visibility of invalidated sweeps
D-purge: Plots the double purge sweeps
S-area: Highlights the sweep area
Liquidity
Liquidity: Displays the liquidity levels that belong to the model
History
History: Controls the number of past models displayed on the chart
Filters
Asia: Filter models based on Asia Killzone hours
London: Filter models based on London Killzone hours
NY AM: Filter models based on NY AM Killzone hours
NY Launch: Filter models based on NY Launch Killzone hours
NY PM: Filter models based on NY PM Killzone hours
Custom: Filter models based on user Custom hours
HTF
Candles: Controls the number of HTF candles that will be visible on the chart
NY Open: Display True Day Open line
Offset: Controls the distance of HTF from the current chart
Space: Controls the space between HTF candles
Size: Controls the size of HTF candles
PD Array: Displays ICT PD Arrays
CE Line: Style the equilibrium line of PD Array
Border: Style the border of the PD Array
LTF
H/L Line: Displays on the LTF chart the High and Low of each HTF candle
O/C Line: Displays on the LTF chart the Open and Close of each HTF candle
PD Array: Displays ICT PD Arrays
CE Line: Style the equilibrium line of PD Array
Border: Style the border of the PD Array
Standard Deviation
StDev: Controls standard deviation of available levels
Labels: Controls the size of standard deviation levels
Anchor: Controls the anchor point of standard deviation levels (wick, body)
Lines: Controls the line widths and color of standard deviation levels
Dashboard
Panel: Display information about the current model
💡 Framework
The Unicorn Model analyzes price action by combining key elements to identify high-probability trade setups. It detects liquidity sweeps and uses a zigzag method to spot Breaker Blocks. The model maps PD Arrays like Fair Value Gaps and Inversion FVGs for precision zones, integrates macro time filters for context, and projects forward price targets based on liquidity clusters. Together, these components provide a clear framework to anticipate market trends and optimize entries and exits.
The model incorporates the following timeframe pairing:
15s - 5m
1m - 15m
1m - 30m
2m - 20m
3m - 30m
3m - 60m
5m - 1H
15m - 4H
15m - 8H
30m - 9H
30m - 12H
1H - 1D
2H - 2D
3H - 3D
4H - 1W
8H - 2W
12H - 3W
1D - 1M
2D - 2M
1W - 3M
2W - 6M
3W - 9M
1M - 12M
Below are the key components that make up the model:
Sweep
D-purge
Zigzag (Breaker)
PD Arrays (FVG, IFVG)
Macros
Standard Deviation
Liquidity
The Unicorn Model operates through a defined lifecycle that tracks its current stage, helping to assess the validity of potential trade opportunities.
The model's lifecycle includes the following statuses:
Formation (grey)
Invalidation (red)
Success (green)
Through the phases of Formation, Invalidation, and Success, traders can effectively manage positions, minimize risk, and capitalize on the high-probability setups presented by the Unicorn Model.
⚡️ Showcase
The Unicorn Model is an advanced trading framework designed to elevate your market analysis and increase your trading edge. By leveraging smart money concepts and sophisticated pattern detection, it helps you spot key liquidity sweeps, reversal zones, and high-probability setups, enabling more precise entries, exits, and risk management tailored to market structure.
LTF PD Array
LTF PD Arrays are crucial to the Unicorn Model and must align with the Zigzag Breaker for the setup to be considered valid.
HTF PD Array
Higher-Timeframe PD Arrays deliver essential macro context, serving to validate both the direction and momentum of potential reversals.
Timeframe Alignment
Timeframe alignment is a fundamental element of the Unicorn trading model. By integrating multi-timeframe context, the model effectively identifies high-probability models.
Killzone Filters
Filter Unicorn Models according to key market sessions—Asia, London, New York AM, New York Launch, and New York PM—to target periods of high liquidity. This approach improves the accuracy and timing of trade setups by capturing moments when smart money is most active.
Macros
The Unicorn Model uses ICT Macro Times to identify key trading periods when institutional activity is most intense. By syncing setups with these critical windows, the model improves accuracy and provides better context for entries, risk management, and potential reversals.
Gain a trading advantage with the Unicorn Model — your essential tool for clearer insights, smarter decision-making, and more confident trade execution.
🚨 Alerts
This script provides alert options for all model types, which must be configured within TradingView.
Bearish Model
A bearish model alert is triggered when a model forms, signaling a 4 Zigzag points formation and a bearish Breaker.
Bullish Model
A bullish model alert is triggered when a model forms, signaling a 4 Zigzag points formation and a bullish Breaker.
⚠️ Disclaimer
These tools are exclusively available on the TradingView platform.
Our charting tools are intended solely for informational and educational purposes and should not be regarded as financial, investment, or trading advice. They are not designed to predict market movements or offer specific recommendations. Users should be aware that past performance is not indicative of future results and should not rely on these tools for financial decisions. By using these charting tools, the purchaser agrees that the seller and creator hold no responsibility for any decisions made based on information provided by the tools. The purchaser assumes full responsibility and liability for any actions taken and their consequences, including potential financial losses or investment outcomes that may result from the use of these products.
By purchasing, the customer acknowledges and accepts that neither the seller nor the creator is liable for any undesired outcomes stemming from the development, sale, or use of these products. Additionally, the purchaser agrees to indemnify the seller from any liability. If invited through the Friends and Family Program, the purchaser understands that any provided discount code applies only to the initial purchase of Candela's subscription. The purchaser is responsible for canceling or requesting cancellation of their subscription if they choose not to continue at the full retail price. In the event the purchaser no longer wishes to use the products, they must unsubscribe from the membership service, if applicable.
We do not offer reimbursements, refunds, or chargebacks. Once these Terms are accepted at the time of purchase, no reimbursements, refunds, or chargebacks will be issued under any circumstances.
By continuing to use these charting tools, the user confirms their understanding and acceptance of these Terms as outlined in this disclaimer.

Breaker Blocks & Unicorns (with Deviations) by RiseBreaker Block and Unicorns (with Deviations) - The Highest Probability ICT Pattern
This advanced indicator identifies and tracks ICT Breaker Blocks, while incorporating powerful supplementary features including Unicorn patterns and customizable deviation levels.
These patterns develop through a precise market structure sequence culminating in structural breaks. Following Breaker Block confirmation, users can optionally enable highly customizable deviation levels. Additionally, the indicator can scan active Breaker Blocks for overlapping Fair Value Gaps (FVGs) and Inverted Fair Value Gaps (IFVGs)-(also known as "Unicorns") that represent high-probability trading opportunities, highly regarded in the ICT community.
This comprehensive tool provides unmatched functionality for traders and analysts seeking to track, backtest, and execute Breaker Block strategies. With its extensive feature set and granular customization options, it delivers capabilities that surpass existing alternatives in the market.
What is an ICT Breaker Block?
To explain this, we must understand the ABC sequence that form this pattern. It consists of:
Initial range (from A -> B)
First break point, commonly called "Manipulation" (C)
Second break, which is when the pattern is formed.
Each of these "points" consist of pivot levels, with an adjustable strength.
Breaker Blocks are invalidated and made inactive if price breaks the "C point", or manipulation.
Unicorns
Unicorns are Fair Value Gaps or Inverted Fair Value Gaps that overlap a Breaker Block. Breakers have their associated Unicorn, which is updated until price retraces into said gap.
Standard Deviations
This indicator has options to display deviations based on Breaker Blocks:
Breaker Deviations -> using the initial range (A -> B).
Manipulation Deviations -> using the manipulation (B -> C).
Input Settings:
This tool offers a lot of customizable options, which could be overwhelming to some users. Below you will find an in-depth definition of every input's purpose, to complement the tooltips that can be found directly in the indicator's settings.
Mode ⚙️
Default -> Displays every Breaker Block pattern found.
Bullish -> Displays every Bullish Breaker Block found.
Bearish -> Displays every Bearish Breaker Block found.
Reversals -> Displays alternate Breaker Blocks (Bearish -> Bullish -> Bearish and so on).
This is paired with a Historical input, to select the amount of previous Breakers to display.
Extend 📏
Last -> This option will extend the most recent Breaker's drawings.
Specified -> Extend Breakers a preset amount of bars.
All -> Extend all active Breakers to the current bar.
None -> Never extend Breaker Blocks.
Each object has it's specific " offset " parameter, which defines the amount of bars to extend drawings past the current bar.
Parameters
This section defines the main parameters used to define the Breaker Block pattern.
Time Filter -> Optional session to filter Breakers based on time of day.
Pivot Strength -> Determines how many consecutive bars to the left of a pivot must be lower (for highs) or higher (for lows) to confirm it as a point.
Range Lookback -> Amount of ranges that the indicator will keep track for each direction.
Breaker Type -> Defines how a Breaker Block is displayed:
Range -> Entire initial range.
Consecutive -> Last consecutive onside candles (upclose for bullish, downclose for bearish).
Last -> Last onside candle.
Breaker Offset -> Amount of bars to extend Breaker Blocks past the current bar.
Use Candle Bodies? -> Use bar open to close rather than high to low.
Require Candle Close? -> Use bar close to form Breaker Blocks.
Remove After Invalidation? -> Remove drawings for invalidated Breakers.
Style
Breaker Block boxes styling based on directions.
Optional Middle Line and styling.
Optional Signals for Breaker Block formation:
Triangle label with adjustable sizing on the formation bar.
Line with custom styling at breakout point to the formation bar.
Unicorn Fair Value Gaps
Checkbox to display Unicorns with adjustable "FVGs", "IFVGs", or "Both" types.
Overlap Threshold -> Distance away from Breaker to still consider an "overlap".
Unicorn Offset -> Amount of bars to extend unicorn gaps past the current bar.
Lines styling.
Optional Middle Line and styling.
Include Volume Imbalances? -> Include adjacent VIs as part of Fair Value Gaps.
Extend until Reached? -> Extend Unicorn drawings until price reaches them.
Deviations
Checkbox to display Standard Deviations with adjustable types and levels.
Lines styling.
Text size and positioning.
Extend until Reached? -> Extend deviation lines until price reaches them.
Text
Label contents:
Default -> "+/- Breaker".
Abbreviation -> "+/- BB".
None -> No text.
Size .
Font (Default or Monospace) and Format (None, Italic or Bold).
Align -> vertical and horizontal positioning.
This indicator is for educational and informational purposes only. Past performance and historical patterns do not guarantee future results. Trading involves substantial risk of loss and is not suitable for all investors. Always conduct your own analysis and consider your financial situation before making any trading decisions. The identification of patterns does not constitute trading advice.
For any additional questions and/or feedback related to this indicator, users can comment below!

CommonUtils█ OVERVIEW
This library is a utility tool for Pine Script™ developers. It provides a collection of helper functions designed to simplify common tasks such as mapping user-friendly string inputs to Pine Script™ constants and formatting timeframe strings for display. The primary goal is to make main scripts cleaner, more readable, and reduce repetitive boilerplate code. It is envisioned as an evolving resource, with potential for new utilities to be added over time based on community needs and feedback.
█ CONCEPTS
The library primarily focuses on two main concepts:
Input Mapping
Pine Script™ often requires specific constants for function parameters (e.g., `line.style_dashed` for line styles, `position.top_center` for table positions). However, presenting these technical constants directly to users in script inputs can be confusing. Input mapping involves:
Allowing users to select options from more descriptive, human-readable strings (e.g., "Dashed", "Top Center") in the script's settings.
Providing functions within this library (e.g., `mapLineStyle`, `mapTablePosition`) that take these user-friendly strings as input.
Internally, these functions use switch statements or similar logic to convert (map) the input string to the corresponding Pine Script™ constant required by built-in functions.
This approach enhances user experience and simplifies the main script's logic by centralizing the mapping process.
Timeframe Formatting
Raw timeframe strings obtained from variables like `timeframe.period` (e.g., "1", "60", "D", "W") or user inputs are not always ideal for direct display in labels or panels. The `formatTimeframe` function addresses this by:
Taking a raw timeframe string as input.
Parsing this string to identify its numerical part and unit (e.g., minutes, hours, days, weeks, months, seconds, milliseconds).
Converting it into a more standardized and readable format (e.g., "1min", "60min", "Daily", "Weekly", "1s", "10M").
Offering an optional `customSuffix` parameter (e.g., " FVG", " Period") to append to the formatted string, making labels more descriptive, especially in multi-timeframe contexts.
The function is designed to correctly interpret various common timeframe notations used in TradingView.
█ NOTES
Ease of Use: The library functions are designed with simple and understandable signatures. They typically take a string input and return the corresponding Pine Script™ constant or a formatted string.
Default Behaviors: Mapping functions (`mapLineStyle`, `mapTablePosition`, `mapTextSize`) generally return a sensible default value (e.g., `line.style_solid` for `mapLineStyle`) in case of a non-matching input. This helps prevent errors in the main script.
Extensibility of Formatting: The `formatTimeframe` function, with its `customSuffix` parameter, allows for flexible customization of timeframe labels to suit the specific descriptive needs of different indicators or contexts.
Performance Considerations: These utility functions primarily use basic string operations and switch statements. For typical use cases, their impact on overall script performance is negligible. However, if a function like `formatTimeframe` were to be called excessively in a loop with dynamic inputs (which is generally not its intended use), performance should be monitored.
No Dependencies: This library is self-contained and does not depend on any other external Pine Script™ libraries.
█ EXPORTED FUNCTIONS
mapLineStyle(styleString)
Maps a user-provided line style string to its corresponding Pine Script™ line style constant.
Parameters:
styleString (simple string) : The input string representing the desired line style (e.g., "Solid", "Dashed", "Dotted" - typically from constants like LS1, LS2, LS3).
Returns: The Pine Script™ constant for the line style (e.g., line.style_solid). Defaults to line.style_solid if no match.
mapTablePosition(positionString)
Maps a user-provided table position string to its corresponding Pine Script™ position constant.
Parameters:
positionString (simple string) : The input string representing the desired table position (e.g., "Top Right", "Top Center" - typically from constants like PP1, PP2).
Returns: The Pine Script™ constant for the table position (e.g., position.top_right). Defaults to position.top_right if no match.
mapTextSize(sizeString)
Maps a user-provided text size string to its corresponding Pine Script™ size constant.
Parameters:
sizeString (simple string) : The input string representing the desired text size (e.g., "Tiny", "Small" - typically from constants like PTS1, PTS2).
Returns: The Pine Script™ constant for the text size (e.g., size.tiny). Defaults to size.small if no match.
formatTimeframe(tfInput, customSuffix)
Formats a raw timeframe string into a more display-friendly string, optionally appending a custom suffix.
Parameters:
tfInput (simple string) : The raw timeframe string from user input or timeframe.period (e.g., "1", "60", "D", "W", "1S", "10M", "2H").
customSuffix (simple string) : An optional suffix to append to the formatted timeframe string (e.g., " FVG", " Period"). Defaults to an empty string.
Returns: The formatted timeframe string (e.g., "1min", "60min", "Daily", "Weekly", "1s", "10min", "2h") with the custom suffix appended.
