DIY Custom Strategy Builder [ZP] - v1DISCLAIMER:
This indicator as my first ever Tradingview indicator, has been developed for my personal trading analysis, consolidating various powerful indicators that I frequently use. A number of the embedded indicators within this tool are the creations of esteemed Pine Script developers from the TradingView community. In recognition of their contributions, the names of these developers will be prominently displayed alongside the respective indicator names. My selection of these indicators is rooted in my own experience and reflects those that have proven most effective for me. Please note that the past performance of any trading system or methodology is not necessarily indicative of future results. Always conduct your own research and due diligence before using any indicator or tool.
===========================================================================
Introducing the ultimate all-in-one DIY strategy builder indicator, With over 30+ famous indicators (some with custom configuration/settings) indicators included, you now have the power to mix and match to create your own custom strategy for shorter time or longer time frames depending on your trading style. Say goodbye to cluttered charts and manual/visual confirmation of multiple indicators and hello to endless possibilities with this indicator.
What it does
==================
This indicator basically help users to do 2 things:
1) Strategy Builder
With more than 30 indicators available, you can select any combination you prefer and the indicator will generate buy and sell signals accordingly. Alternative to the time-consuming process of manually confirming signals from multiple indicators! This indicator streamlines the process by automatically printing buy and sell signals based on your chosen combination of indicators. No more staring at the screen for hours on end, simply set up alerts and let the indicator do the work for you.
Available indicators that you can choose to build your strategy, are coded to seamlessly print the BUY and SELL signal upon confirmation of all selected indicators:
EMA Filter
2 EMA Cross
3 EMA Cross
Range Filter (Guikroth)
SuperTrend
Ichimoku Cloud
SuperIchi (LuxAlgo)
B-Xtrender (QuantTherapy)
Bull Bear Power Trend (Dreadblitz)
VWAP
BB Oscillator (Veryfid)
Trend Meter (Lij_MC)
Chandelier Exit (Everget)
CCI
Awesome Oscillator
DMI ( Adx )
Parabolic SAR
Waddah Attar Explosion (Shayankm)
Volatility Oscillator (Veryfid)
Damiani Volatility ( DV ) (RichardoSantos)
Stochastic
RSI
MACD
SSL Channel (ErwinBeckers)
Schaff Trend Cycle ( STC ) (LazyBear)
Chaikin Money Flow
Volume
Wolfpack Id (Darrellfischer1)
QQE Mod (Mihkhel00)
Hull Suite (Insilico)
Vortex Indicator
2) Overlay Indicators
Access the full potential of this indicator using the SWITCH BOARD section! Here, you have the ability to turn on and plot up to 14 of the included indicators on your chart. Simply select from the following options:
EMA
Support/Resistance (HeWhoMustNotBeNamed)
Supply/ Demand Zone ( SMC ) (Pmgjiv)
Parabolic SAR
Ichimoku Cloud
Superichi (LuxAlgo)
SuperTrend
Range Filter (Guikroth)
Average True Range (ATR)
VWAP
Schaff Trend Cycle ( STC ) (LazyBear)
PVSRA (TradersReality)
Liquidity Zone/Vector Candle Zone (TradersReality)
Market Sessions (Aurocks_AIF)
How it does it
==================
To explain how this indictor generate signal or does what it does, its best to put in points.
I have coded the strategy for each of the indicator, for some of the indicator you will see the option to choose strategy variation, these variants are either famous among the traders or its the ones I found more accurate based on my usage. By coding the strategy I will have the BUY and SELL signal generated by each indicator in the backend.
Next, the indicator will identify your selected LEADING INDICATOR and the CONFIRMATION INDICATOR(s).
On each candle close, the indicator will check if the selected LEADING INDICATOR generates signal (long or short).
Once the leading indicator generates the signal, then the indicator will scan each of the selected CONFIRMATION INDICATORS on candle close to check if any of the CONFIRMATION INDICATOR generated signal (long or short).
Until this point, all the process is happening in the backend, the indicator will print LONG or SHORT signal on the chart ONLY if LEADING INDICATOR and all the selected CONFIRMATION INDICATORS generates signal on candle close. example for long signal, the LEADING INDICATOR and all selected CONFIRMATION INDICATORS must print long signal.
The dashboard table will show your selected LEADING and CONFIRMATION INDICATORS and if LEADING or the CONFIRMATION INDICATORS have generated signal. Signal generated by LEADING and CONFIRMATION indicator whether long or short, is indicated by tick icon ✔. and if any of the selected CONFIRMATION or LEADING indicator does not generate signal on candle close, it will be indicated with cross symbol ✖.
how to use this indicator
==============================
Using the indicator is pretty simple, but it depends on your goal, whether you want to use it for overlaying the available indicators or using it to build your strategy or for both.
To use for Building your strategy: Select your LEADING INDICATOR, and then select your CONFIRMATION INDICATOR(s). if on candle close all the indicators generate signal, then this indicator will print SHORT or LONG signal on the chart for your entry. There are plenty of indicators you can use to build your strategy, some indicators are best for longer time frame setups while others are responsive indicators that are best for short time frame.
To use for overlaying the indicators: Open the setting of this indicator and scroll to the SWITCHBOARD section, from there you can select which indicator you want to plot on the chart.
For each of the listed indicators, you have the flexibility to customize the settings and configurations to suit your preferences. simply open indicator setting and scroll down, you will find configuration for each of the indicators used.
I will also release the Strategy Backtester for this indicator soon.
在腳本中搜尋"fvg"

ICT Daily BiasThis indicator is based on ICT's teaching - Daily Bias. Indicator tries to predict which direction (bias) the price will move in the near future and it can tell you in which direction should you take trades on the lower timeframe (buy or sell). It works on every timeframe but best to use on 1D timeframe. It can also show historical Daily Biases. Daily Bias can be BUY, SELL or NEUTRAL. If there is NEUTRAL Daily Bias then you should not take any trade because following price direction is not clear until the Daily Bias changes to BUY or SELL.
Current Daily Bias is shown in the right bottom corner.
Daily Bias can be calculated by 2 types: Previous H/L or Previous Swing H/L.
Previous H/L:
This calculation is based on previous H/L. If actual candle reaches previous high (red line by default) or low (green line by default) with wick then price should reverse into opposite direction. If actual candle closes with body above previous high (green line by default) or below previous low (red line by default) then price should continue in current direction. There are also colorful arrows showing the following daily bias based on previous candle.
Previous Swing H/L:
This calculation is based on previous untested swing H/L. If actual candle reaches previous untested swing high (red line by default) or low (green line by default) with wick then price should reverse into opposite direction. If actual candle closes with body above previous untested swing high (green line by default) or below previous untested swing low (red line by default) then price should continue in current direction. Lookleft and lookright period (default: 3) for swing H/L can be set in indicator settings. This period tells you how many candles left and right from the swing H/L need to be higher (swing low) or lower (swing high). Previous tested swing H/L are labeled by colorful (yellow by default) diamonds. There are also colorful arrows showing the following daily bias based on previous tested swing H/L.
All settings of this indicator should be self-explanatory and some of them have tooltips for better understanding.

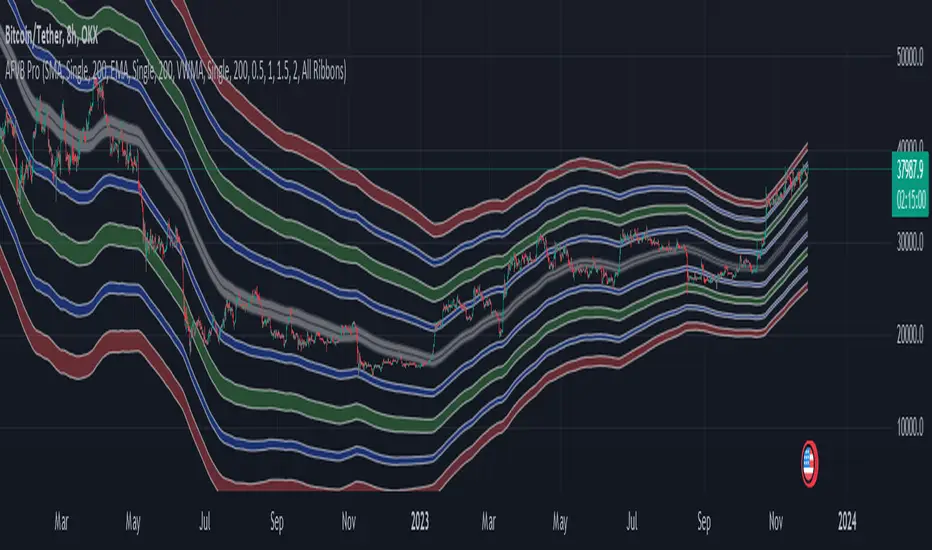
Apeiron Fair Value BandsThe Apeiron Fair Value Bands take into account a given MA and determine a Fair Value Area (FVA) for the price of a certain asset. The script plots a MA and a tolerance ribbon for it, as well as 2 bands (preset to 1 Standard deviations and 2 Standard deviations respectively, which can be manually changed) with a tolerance ribbon as well.
This creates 3 areas of interest:
The MA ribbon
The inside of the first upper and lower band (1 standard deviation) where price should stay within around 68% percent of the time according to the normal distribution
The inside of the second upper and lower band (2 standard deviations) where price should stay within around 95% percent of the time according to the normal distribution
Taking this into account, Fair Value analysis can be done:
Premium and Discount Prices: From a very simplistic point of view, when price is below a MA it can be considered to be at a discount and when it is above at a premium. Combining that idea with the levels given by the bands, we can determine if we are buying at premium or at a discount, specially on HTF and when considering investing, thus allowing to enter or exit the market with a higher probability of being on the right side of the trend and at a good level. As seen on the example, buying or selling at the highlighted levels would have been profitable with little drawdown.
VAH & VAL: (1 Standard Deviation Bands) Same as a Market Profile, price will stay in here "most" of the time. And particularly during ranging periods, they will provide potential revesal levels. As well, once prices breaks out of it, depending of the reaction to the second band, we can consider it a deviation or the beggining of a new trend. During strong trends, the bands can also serve as a correction support as the MA would do
New Fair Vaue Range: Once a new trend has begun, it will often slide on or break through Band 2, which can be interpreted as price creating a new Fair Value Range low or high. As seen on the chart, once price breaks out, those levels tend to be respected and relevant during corrections. I must make it very clear that this is just an analytical feature meant to be used in confluence with S/R, Supply & Demand, FVGs, Fibs or others. While it can be accurate sometimes, it might not be other times and be only "close".
Exhaustions: I call exhaustions to the scenarios when price keeps going up/down but it fails to keep pushing the fair value area with it. This indicates weakness in the trend and a potential reversal or correction. These appear on all Timeframes and symbols and are very good indications of tops and bottoms, specially after strong rallies or crashes. In the latter cases, waiting for price to re-enter it's FVA, provides great entries at the Bands levels.
Other features / Suggested Uses:
Middle levels: On the setup menu you can select different Standard deviation settings for each band including: 0.5, 1, 1.5, 2, 2.5 and 3. While the most relevant settings are 1 & 2, having their middle levels on the chart can provide extra levels for very tight ranges or just in general potential reversal levels.
Multi Timeframe & Multi symbol: The bands work on very low TF as well as High TF, though on HTF it might be limited by the MA length settings and the historical data of the symbol. It is important to note that each symbol and market type will have its own ideal MA and Bands settings.
Multi Bands Confluence: Same as you would use a short and long MA in a single setup, you can do the same with the bands and the confluence of levels can be very accurate.
Multi Timeframe Confluence: One of the best ways to use the bands so far is by using it in confluence with itself in other TFs, when price moves sharply into a confluent level given by multiple TFs, it is more likely for price to reverse there.
Most of the examples show a 200 SMA, but depending on what and how you are trading a shorter or longer MA might be a better fit for you. As well, if you are trading ranges, a VWMA might be much better, and if you are following a trend the EMA could be the better option.
I also want to make it clear that the bands can but are NOT meant to be a standalone indicator. They are meant to be used for confluence with other strategies, systems or indicators.
Price based concepts / quantifytools- Overview
Price based concepts incorporates a collection of multiple price action based concepts. Main component of the script is market structure, on top of which liquidity sweeps and deviations are built on, leaving imbalances the only standalone concept included. Each concept can be enabled/disabled separately for creating a selection of indications that one deems relevant for their purposes. Price based concepts are quantified using metrics that measure their expected behavior, such as historical likelihood of supportive price action for given market structure state and volume traded at liquidity sweeps. The concepts principally work on any chart, whether that is equities, currencies, cryptocurrencies or commodities, charts with volume data or no volume data. Essentially any asset that can be considered an ordinary speculative asset. The concepts also work on any timeframe, from second charts to monthly charts. None of the indications are repainted.
Market structure
Market structure is an analysis of support/resistance levels (pivots) and their position relative to each other. Market structure is considered to be bullish on a series of higher highs/higher lows and bearish on a series of lower highs/lower lows. Market structure shifts from bullish to bearish and vice versa on a break of the most recent pivot high/low, indicating weak ability to defend a key level from the dominating side. Supportive market structure typically provides lengthier and sustained trending environment, making it an ideal point of confluence for establishing directional bias for trades.
Liquidity sweeps
Liquidity sweeps are formed when price exceeds a pivot level that served as a provable level of demand once and is expected to display demand again when revisited. A simple way to look at liquidity sweeps is re-tests of untapped support/resistance levels.
Deviations
Deviations are formed when price exceeds a reference level (market structure shift level/liquidity sweep level) and shortly closes back in, leaving participating breakout traders in an awkward position. On further adverse movement, stuck breakout traders are forced to cover their underwater positions, creating ideal conditions for a lengthier reversal.
Imbalances
Imbalances, also known as fair value gaps or single prints, depict areas of inefficient and one sided transacting. Given inclination for markets to trade efficiently, price is naturally attracted to areas that lack proper participation, making imbalances ideal targets for entries or exits.
Key takeaways
- Price based concepts consists of market structure, liquidity sweeps, deviations and imbalances.
- Market structure shifts from bullish to bearish and vice versa on a break of the most recent pivot high/low, indicating weak ability to defend a key level from the dominating side.
- Supportive market structure tends to provide lengthier and sustained movement for the dominating side, making it an ideal foundation for establishing directional bias for trades.
- Liquidity sweeps are formed when price exceeds an untapped support/resistance level that served as a provable level of demand in the past, likely to show demand again when revisited.
- Deviations are formed when price exceeds a key level and shortly closes back in, leaving breakout traders in an awkward position. Further adverse movement compels trapped participants to cover their positions, creating ideal conditions for a reversal.
- Imbalances depict areas of inefficient and one sided transacting where price is naturally attracted to, making them ideal targets for entries or exits.
- Price based concepts are quantified using metrics that measure expected behavior, such as historical likelihood of supportive structure and volume traded at liquidity sweeps.
- For practical guide with practical examples, see last section.
Accessing script 🔑
See "Author's instructions" section, found at bottom of the script page.
Disclaimer
Price based concepts are not buy/sell signals, a standalone trading strategy or financial advice. They also do not substitute knowing how to trade. Example charts and ideas shown for use cases are textbook examples under ideal conditions, not guaranteed to repeat as they are presented. Price based concepts notify when a set of conditions are in place from a purely technical standpoint. Price based concepts should be viewed as one tool providing one kind of evidence, to be used in conjunction with other means of analysis.
Price based concepts are backtested using metrics that reasonably depict their expected behaviour, such as historical likelihood of supportive price movement on each market structure state. The metrics are not intended to be elaborate and perfect, but to serve as a general barometer for feedback created by the indications. Backtesting is done first and foremost to exclude scenarios where the concepts clearly don't work or work suboptimally, in which case they can't be considered as valid evidence. Even when the metrics indicate historical reactions of good quality, price impact can and inevitably does deviate from the expected. Past results do not guarantee future performance.
- Example charts
Chart #1 : BTCUSDT
Chart #2 : EURUSD
Chart #3 : ES futures
Chart #4 : NG futures
Chart #5 : Custom timeframes
- Concepts
Market structure
Knowing when price has truly pivoted is much harder than it might seem at first. In this script, pivots are determined using a custom formula based on volatility adjusted average price, a fundamentally different approach to the widely used highest/lowest price within X amount of bars. The script calculates average price within set period and adjusts it to volatility. Using this formula, the script determines when price has turned significantly enough and aggressively enough to constitute a relevant pivot, resulting in high accuracy while ruling out subjective decision making completely. Users can adjust length of market structure basis and sensitivity of volatility adjustment to achieve desired magnitude of pivots, reflected on the average swing metrics. Note that structure pivots are backpainted. Typical confirmation time for a pivot is within 2-3 bars after peak in price.
Market structure shifts
Generally speaking, traders consider market structure to have shifted when most recent structure high/low gets taken out, flipping underlying bias from one side over to the other (e.g. from bullish structure favoring upside to bearish structure favoring downside). However, there are many ways to approach the concept and the most popular method might not always be the best one. Users can determine their own market structure shift rules by choosing source (close, high, low, ohlc4 etc.) for determining structure shift. Users can also choose additional rules for structure shift, such as two consecutive closes above/below pivot to qualify as a valid shift.
Liquidity sweeps
Users can set maximum amount of bars liquidity levels are considered relevant from the moment of confirmed pivot. By default liquidity levels are monitored for 250 bars and then discarded. Level of tolerance can be set to anything between 100 and 1000 bars. For each liquidity sweep, relative volume (volume relative to volume moving average) is stored and added to average calculations for keeping track of typical depth of liquidity found at sweeps.
Deviations
Users can set a maximum amount of bars price has to spend above/below reference level to consider a deviation to be in place. By default set to 6 bars.
Imbalances
Users can set a desired fill point for imbalances using the following options: 100%, 75%, 50%, 25%. Users can also opt for excluding insignificant imbalances to attain better relevance in indications.
- Backtesting
Built-in backtesting is based on metrics that are considered to reasonably quantify expected behaviour of the main concept, market structure. Structure feedback is monitored using two metrics, supportive structure and structure period gain. Rest of the metrics provided are informational in nature, such as average swing and average relative volume traded at liquidity sweeps. Main purpose of the metrics is to form a general barometer for monitoring whether or not the concepts can be viewed as valid evidence. When the concepts are clearly not working optimally, one should adjust expectations accordingly or take action to improve performance. To make any valid conclusions of performance, sample size should also be significant enough to eliminate randomness effectively. If sample size on any individual chart is insufficient, one should view feedback scores on multiple correlating and comparable charts to make up for the loss.
For more elaborate backtesting, price based concepts can be used in any other script that has a source input, including fully mechanic strategies utilizing Tradingview's native backtester. Each concept and their indications (e.g. higher low on a bearish structure, lower high on a bullish structure, market structure shift up, imbalance filled etc.) can be utilized separately and used as a component in a backtesting script of your choice.
Structure feedback
Structure feedback is monitored using two metrics, likelihood of supportive price movement following a market structure shift and average structure period gain. If either of the two employed tests indicate failed reactions beyond a tolerable level, one should take action to improve feedback by adjusting the settings. If feedback metrics after adjusting the settings are still insufficient, the concepts are working suboptimally for the given chart and cannot be regarded as valid technical evidence as they are.
Metric #1 : Supportive structure
Each structure pivot is benchmarked against its respective structure shift level. Feedback is considered successful if structure pivot takes place above market structure shift level (in the case of bullish structure) or below market structure shift level (in the case of bearish structure). Structure feedback constitutes as one test indicating how often a market structure state results in price movement that can be considered supportive.
Metric #2 : Structure period gain
Each structure period is expected to present favorable appreciation, measured from one market structure shift level to another. E.g. bullish structure period gain is measured from market structure shift up level to market structure shift down level that ends the bullish structure period. Bearish structure is measured in a vice versa manner, from market structure shift down level to market structure shift up level that ends the bearish structure period. Feedback is considered successful if average structure period gain is supportive for a given structure (positive for bullish structure, negative for bearish structure).
Additional metrics
On top of structure feedback metrics, percentage gain for each swing (distance between a pivot to previous pivot) is recorded and stored to average calculations. Average swing calculations shed light on typical pivot magnitude for better understanding changes made in market structure settings. Average relative volume traded at liquidity sweep on the other hand gives a clue of depth of liquidity typically found on a sweeps.
Feedback scores
When market structure (basis for most concepts) is working optimally, quality threshold for both feedback metrics are met. By default, threshold for supportive structure is set to 66%, indicating valid feedback on 2/3 of backtesting periods on average. On top, average structure period gain needs to be positive (for bullish structures) and negative (for bearish structure) to qualify as valid feedback. When both tests are passed, a tick indicating valid feedback will appear next to feedback scores, otherwise an exclamation mark indicating suboptimal performance on either or both. If both or either test fail, market structure parameters need to be optimized for better performance or one needs to adjust expectations accordingly.
Verifying backtest calculations
Backtest metrics can be toggled on via input menu, separately for bullish and bearish structure. When toggled on, both cumulative and average counters used in backtesting will appear on "Data Window" tab. Calculation states are shown at a point in time where cursor is hovered. E.g. when hovering cursor on 4th of January 2021, backtest calculations as they were during this date will be shown.
- Alerts
Available alerts are the following.
- HH/HL/LH/LL/EQL/EQH on a bullish/bearish structure
- Bullish/bearish market structure shift
- Bullish/bearish imbalance created
- Bullish/bearish imbalance filled
- Bullish/bearish liquidity sweep
- Bullish/bearish deviation
- Visuals
Each concept can be enabled/disabled separately for creating a selection indications that one deems relevant for their purposes. On top, each concept has a stealth visual option for more discreet visuals.
Unfilled imbalances and untapped liquidity levels can be extended forward to better gauge key areas of interest.
Liquidity sweeps have an intensity option, using color and width to visualize volume traded at sweep.
Market structure states and market structure shifts can be visualized as chart color.
Metric table can be offsetted horizontally or vertically from any four corners of the chart, allowing space for tables from other scripts.
Table sizes, label sizes and colors are fully customizable via input menu.
- Practical guide
The basic idea behind market structure is that a side (bulls or bears) have shown significant weakness on a failed attempt to defend a key level (most recent pivot high/low). In the same way, a side has shown significant strength on a successful attempt to break through a key level. This successful break through a key level often leads to sustained lengthier movement for the side that provably has the upper hand, making it an ideal tool for establishing directional bias.
Multi-timeframe view of market structure provides crucial guidance for analyzing market structure states on any individual timeframe. If higher timeframe market structure is bullish, it doesn't make sense to expect contradicting lower timeframe market structure to provide significant adverse movement, but rather a normal correction within a long term trend. In the same way, if lower timeframe market structure is in agreement with higher timeframe market structure, one can expect a reliable trending environment to ensue as multiple points of confluence are in place.
Bullish structure can be considered constructive on a series of higher highs and higher lows, indicating strong interest from bulls to sustain an uptrend. Vice versa is true for bearish structure, a series of lower highs and lower lows can be considered constructive. When structure does not indicate strong interest to maintain a supportive trend (lower highs on bullish structure, higher lows on bearish structure), a structure shift and a turn in trend might be nearing.
Market structure shifts are of great interest for breakout traders who position for continuation. Structure shifts can indeed be fertile ground for executing a breakout trade, but breakouts can easily turn into fakeouts that leave participants in an awkward position. When price moves further away from the underwater participants, potential for snowball effect of covering positions and driving price further away is elevated.
Liquidity sweeps as a concept is based on the premise that pivoting price is evidence of meaningful depth of liquidity found at/around pivot. If liquidity existed at a pivot once, it is likely to exist there in the future as well. When price grinds against liquidity, it is on a path of resistance rather than path of least resistance. Pivots are also attractive placements for traders to set stop-losses, which act as fuel for price to move to the opposite direction when swept and triggered.
Behind tightly formed pivots are potentially many stop-loss orders lulled in the comfort of having many layers of levels protecting their position. Compression that leaves such clusters of unswept liquidity rarely goes unvisited.
As markets strive for efficient and proper transacting most of the time, imbalances serve as points in price where price is naturally attracted to. However, imbalances too are contextual and sometimes one sided trading is rewarded with follow through, rather than with a fill. Identifying market regimes give further clue into what to expect from imbalances. In a ranging environment, one can expect imbalances to fill relatively quick, making them ideal targets for entries and exits.
On a strongly trending environment on the other hand imbalances tend to stick for a much longer time. In such environments continuation can be expected with no fills or only partial fills. Signs of demand preventing fill attempts serve as additional clues for imminent continuation.

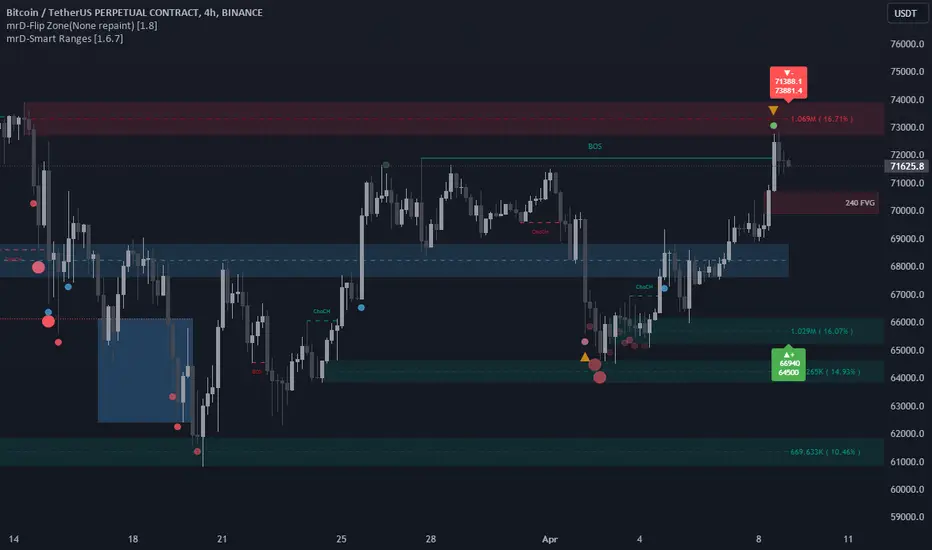
mrD-Smart RangesmrD-Smart Ranges aims to offer a complete strategy based on Order Blocks. Ranges signals based on order volume are highlighted, from which smart ranges are suggested to provide potential entries.
This script also includes warnings for each signal marked.
🔶 SETTINGS
Pair Strategy: Select the desired from the list. Change the chart to the one specified in the Strategy.
Current TF Order Blocks: Allows the user to select how many most recent Internal Order Blocks appear in the current time frame on the chart.
Order Block Filter: Allows the user to select how the script mitigates an Order Block.
Hide Overlap: Allows the user to display overlapping Order Blocks.
Show Metrics: Allows the user to display volume % metrics within the Order Blocks.
Show Volume Box: Allows the user to display buy/sell activity within Order Blocks.
High Timeframe: Allows the user to choose a higher or lower timeframe to find the Signals.
Show Failed Buy Sell: Allows the user to display the Signals.
Show HTF Box: Allows the user to display a higher or lower timeframe Order Blocks.
🔶 DETAILS
Order blocks are formed after a slight bearish order block, these can provide an opportunity to change polarity, thus acting as a potential support/resistance level.
A retest/retrace on the order block, combined with order volume between the current timeframe and from the higher timeframe will establish the conditions for smart ranges are suggested to provide potential entries.
🔶 USAGE
mrD-Smart Ranges aims to provide users with a minimalistic screen next to the optimal ranges to keep in mind to find trading setups as shown below.
Here we can see a suggested Sell range and display a label to confirm this range
Signal(s) that can be used for potential entries only during range retest are order blocks.
Users can search for more potential entry ranges based on larger timeframes in the settings: High Timeframe
In the image above, we can see that the price has generated potential orange and bearish entry signals. A confirmation signal with a red label is displayed on the chart when the price retests the Sell range.
Note: While range retests can still work well if they occur later in price action, it's best to look for signals only when price retests the range at the outset rather than retesting it. second price.
The logic of generating signal ranges using different rules is described below:
- Define order blocks in the current timeframe.
- Define the order blocks with the largest volume in the current timeframe.
- Define order blocks in larger timeframes in High Timeframe settings
- Define order blocks with the largest volume in larger timeframes in High Timeframe settings
Entry Range: The combination of the highest volume order blocks in the current timeframe and the highest volume order blocks in the larger timeframe.
🔶General disclaimer:
Trading stocks, futures, forex, options, ETFs, cryptocurrency, or any other financial instrument has huge potential rewards and risks.
You must be aware of the risks and willing to accept them to invest in stocks, futures, forex, options, ETFs, or cryptocurrencies.
Don't trade with money you can't afford to lose.
This is not an offer or an offer to Buy/Sell stocks, futures, Forex, options, ETFs, cryptocurrencies, or any other financial instrument.
Do not represent that any account will or is likely to achieve profit or loss of any kind.
The past performance of any trading system or method is not necessarily indicative of future results.
My Scripts/Indicators/Ideas/Algos/Systems are only for educational purposes!
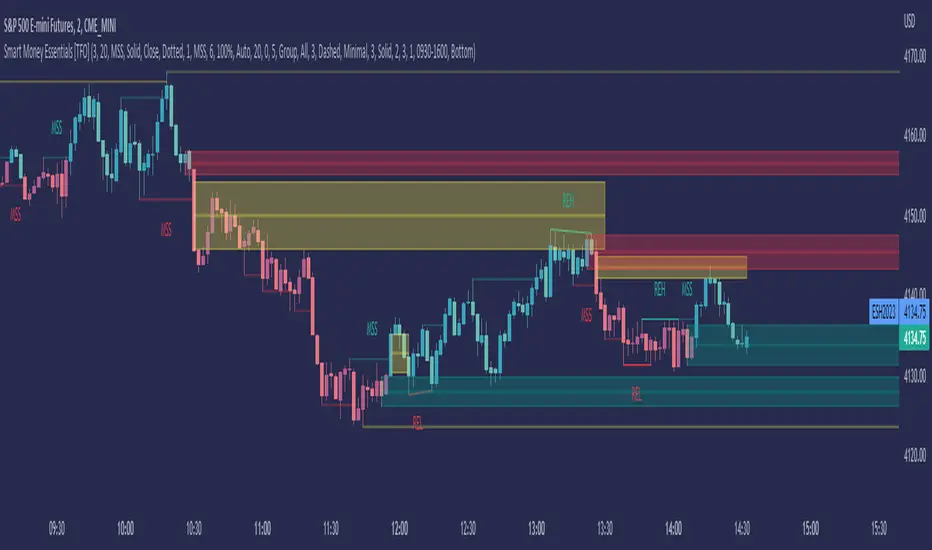
SME Backtesting [TFO]This strategy script is an extension of my Smart Money Essentials (SME) indicator and aims to provide a simplified means of backtesting complex trade models that incorporate a variety of Smart Money Concepts.
Among other things, Smart Money Essentials contains logic for:
- Market structure
- Fair Value Gaps
- Order Blocks
- Breaker Blocks
- Optimal Trade Entries
- HTF Market Structure
The Confluence section can then be utilized to build and test trade models from any combination of the included factors. As a basic example, we could test a strategy that only utilizes market structure. With Manual Exit turned off, we would simply be flipping long on bullish market structure shifts, and reversing short on bearish market structure shifts for the duration of the user-defined session.
As one might expect, such a simple strategy isn't expected to produce very reliable results by itself. However, we could build on these ideas by adding extra layers of Confluence, like looking for entries where Market Structure aligns with Order Block interactions. We could also turn on Manual Exit with a 40 tick stop loss and 80 tick profit target (10 points and 20 points, respectively, for ES futures), for more defined exit criteria.
One could expand on these ideas by adding factors like Fair Value Gaps, HTF Market Structure, etc. Any of the core pieces of SME can be used to build and backtest strategies that would otherwise be extremely tedious to do by hand, and as the SME indicator grows, so too will this backtesting script. Ultimately, the purpose of this is to make Smart Money Concepts more objective and easily testable so that users may better understand where these concepts may perform best.

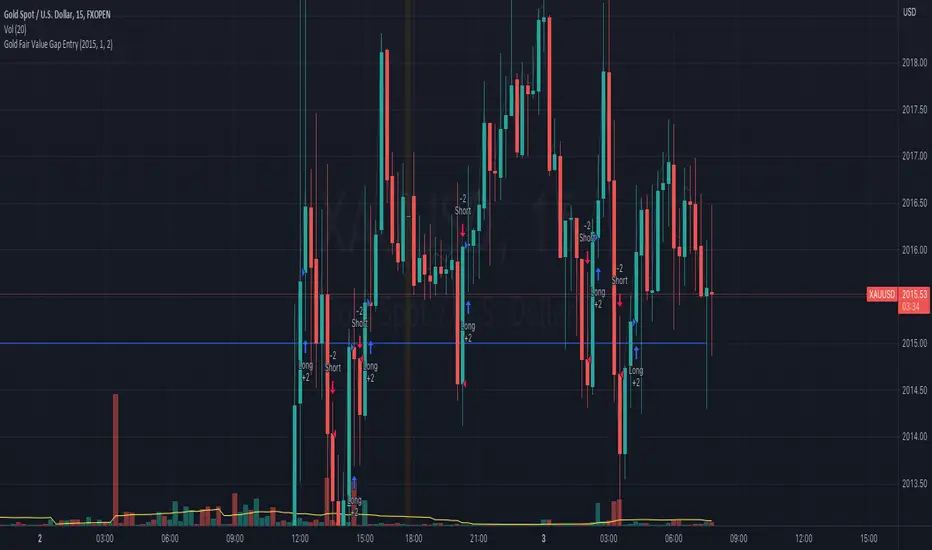
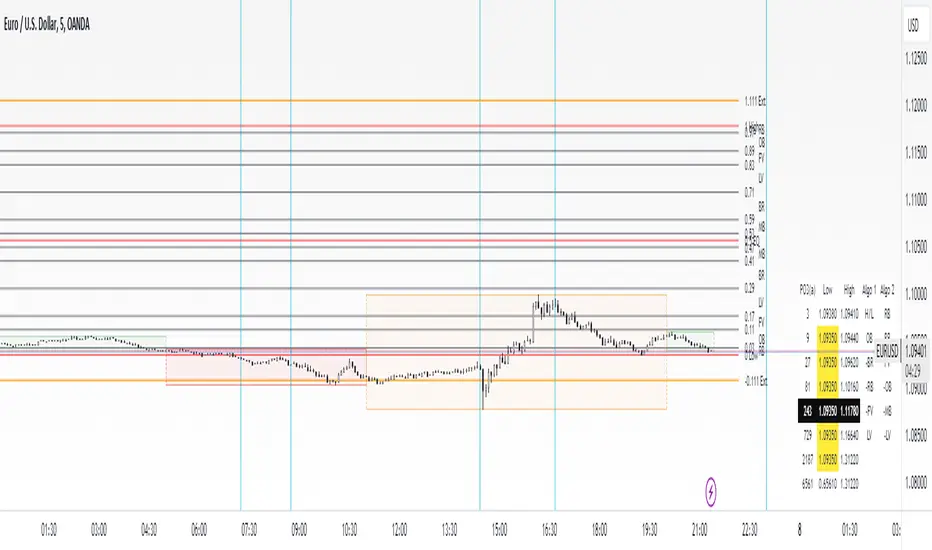
Gold Fair Value Gap Entry(FVG GOLD)This script calculates the fair value of gold, which is set as an input parameter. It then gets the current price of gold and calculates the gap between the price and the fair value. If the gap is positive, it enters a long trade, and if it's negative, it enters a short trade.
The script also uses proper risk management techniques by setting a stop loss and take profit for each trade. The plot() function is used to display the fair value and gap on the chart.
Please note that this is just an example script, and you should customize it based on your specific trading strategy and criteria. It's also important to backtest your strategy and refine it before using it with real money.
Stophunt WickAcknowledgement
This indicator is dedicated to my friend Alexandru who saved me from one of these liquidation raids which almost liquidated me.
Alexandru is one of the best scalpers out there and he always nails his entries at the tip of these wicks.
This inspired me to create this indicator.
What's a Liquidation Wick?
It's that fast stop-hunting wick that stophunts everyone by triggering their stop-loss and liquidation.
Liquidity is the lifeblood of stock market and liquidation is the process that moves price.
This indicator will identify when a liquidity pool is getting raided to trigger buy or sell stops, they are also know as stop-hunts.
How does it work?
When market consolidates in one direction, it builds up liquidity zones.
Market maker will break out of these consolidation phases by having dramatic price action to either pump or dump to raid these liquidity zones.
This is also called stop-hunts or liquidity raids. After that it will start reversing back to the opposite direction.
This is most noticeable by the length of the wick of a given candle in a very short amount of time and the total size of the candle.
This indicator highlights them accordingly.
Settings
Wick and Candle ratio works with default values but finetune will enhance user experience and usability.
Wick Ratio: Size of the wick compared to body of a candle.
Adjust this to higher ratio on smaller timeframe or smaller ratio on bigger timeframe to your trading style to spot a trend reversal.
Candle Ratio: The size of the candle, by default it is 0.75% of the current price.
For example, if BTC is at 20,000 then the size of the candle has to be minimum 150.
This can be fine tuned to bigger candle size on higher time frames or smaller for shorter timeframe depending on the trade type.
How to use it?
This indicator will identify when a liquidity pool is getting raided to trigger buy or sell stops, they are also know as stop-hunts. It can be used of its own for scalping but there are also a good few indicators which would most definitely help to confluence bigger timeframe trades.
Scalp
This indicator shows the most chaotic moments in price action; therefore it works best on smaller timeframes, ideally 3 or 5 minute candle.
- Wait for the market to start pumping or dumping.
- Current candle will change colour (Bullish/Bearish).
- Enter trade as soon as price starts to reverse back.
- Place the stop-loss outside of the current candle.
- Wait for the Liquidation Wick to appear as confirmation.
Price is very chaotic during a liquidity stop-hunt raid but there is a saying:
"In the midst of chaos, there is also opportunity" - Sun-Tzu
Since this is a very high risk, high reward strategy; it is advised to practice on paper trade first.
Practice until perfection and this indicator would be the perfect bread and butter scalp confirmation.
Fair Value Gap
FVG strategy is the most accurate in conjunction with this indicator.
Normally price would reverse after consuming fair value gaps but often it's difficult to know when and where.
This indicator would identify those crucial entry points for reverse course direction of the price action.
Support and Resistance
This indicator can also be used in conjunction with support and resistance lines.
Generally the stophunt will go deep below the support or spike much further up the resistance lines to liquidate positions.
Bollinger Bands
Bolling Bands strategy would be to wait until the price breaks out of the band.
Once the wick is formed, it would be an ideal entry point.
Script change
This is an open-source script and feel free to modify according to your need and to amplify your existing strategy.

ICT Macros by CryptoforICT Macros by Cryptofor
Time periods in which the price is most volatile. At this time, the algorithm is programmed to attack liquidity or fill a significant FVG from which the OF can continue.
Plots of macros:
1. London Macros:
02:33 - 03:00
04:03 - 04:30
2. New York AM Macros:
08:50 - 09:10
09:50 - 10:10
10:50 - 11:10
3. New York Lunch + PM Macros:
11:50 - 12:10
13:10 - 13:40
15:15 - 15:45
Features:
Flexible line settings
Flexible text settings
Display data for all time or for the last 24 hours
Switch for each type of macro
Macro background color settings

Smart Money Essentials [TFO]This indicator utilizes “Smart Money Concepts” like liquidity, order blocks, premium & discount, and more to analyze price action.
What’s included in the initial release:
Market Structure
Liquidity
Displacement
Order Blocks
Premium / Discount
Confluence Table
Alerts
Market structure logic objectively identifies whether the current trend is bullish or bearish, based on swing highs and lows. Liquidity levels offer insight into major pivots where we can assume many traders may place their stop loss, which can also serve as areas where “Smart Money” may be accumulating or distributing positions.
Displacement adds to this by spotting rapid price movement, often accompanied by imbalances where price may come back to before continuing in the direction of the displacement. These can be filtered based on whether the imbalance is accompanied by a Break of Structure (BOS) or Market Structure Shift (MSS), which may give additional insight into the draw on liquidity.
Order blocks (OB’s) are detected and treated as areas that may offer support for price in an uptrend or resistance in a downtrend. Premium and discount zones are essentially fitted by an “auto-fib” retracement that looks at recent liquidity levels, and optionally offers areas to look for an Optimal Trade Entry (OTE) where price retraces between 62-79% of the preceding displacement leg.
The confluence table provides an organized place to visualize and identify where any of the above concepts may be present at or around the same time. We can implement a threshold where, if the number of selected factors meets or exceeds this threshold, we can potentially identify bullish and bearish opportunities where multiple layers of confluence are overlapping.
And of course, alerts are built in for all significant events related to the above concepts, for example: runs on liquidity, BOS and MSS, rejections from OB and OTE, etc.
Smart Money Add-Ons [TFO]Supplementing my “Smart Money Essentials ” indicator, these add-ons provide some more commonly used “Smart Money Concepts,” including SMT Divergence, and HTF POI, and open price lines for added confluence.
Smart Money Technique (SMT) Divergence is meant to annotate divergence between closely correlated assets. Take $ES_F and $NQ_F for example (S&P 500 and Nasdaq 100 futures). These two names normally track each other very closely, but if $ES_F is steadily rising towards a large institutional level and making higher highs, while $NQ_F is approaching a similarly important level and making lower highs on that same timeframe, this would indicate a divergence between the two assets that could foreshadow a “Smart Money Reversal.”
Open price lines can provide intraday levels of interest from important times of day, where the defaults are set to midnight (12:00 AM), 8:30 AM for news releases, and 9:30 AM New York market open (New York local time). The open prices at these times can often act as support and resistance when other confluence factors are present. Higher timeframe points of interest (HTF POI) are also helpful to remain mindful of imbalances and other inefficiencies in which lower timeframe price action may create some reversal structure.

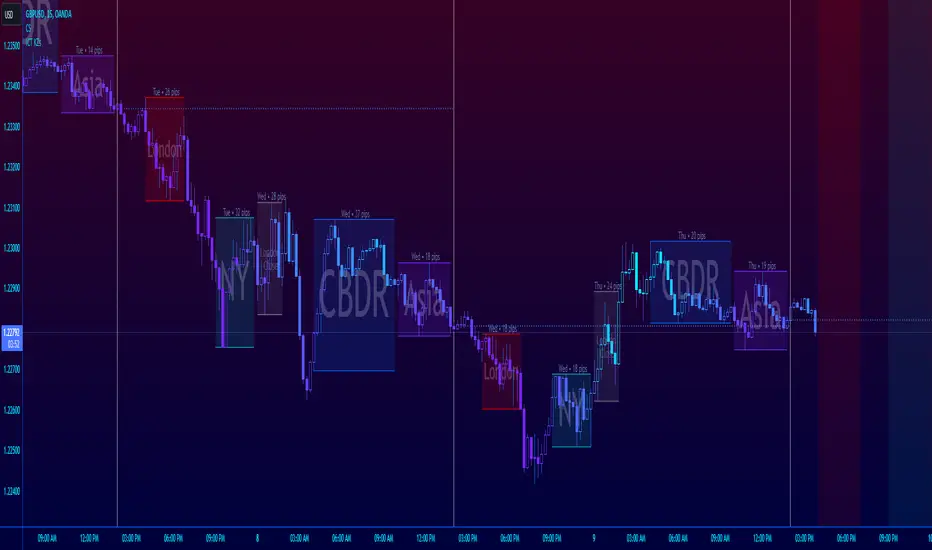
dmn's ICT AMD-Goldbach█ OVERVIEW
This script is built on ICT time & price theory and the theory of algorithmic market maker models, and visualizes the intraday divided using powers of three into accumulation, manipulation and distribution cycles.
It also includes an automatically calculated and plotted Goldbach level (a.k.a. IPDA level or Huddleston level) overlay, to help visualize where in the current market maker profile price is in relation to the AMD cycles, and where it might trade to.
█ CONCEPTS
Accumulation, Manipulation, Distribution Cycles
A 24 hour day, with the default set to start at 20:00 CET (the start of the Forex CLS Settlement operational timeline) is split in three parts - 9, 6 and 9 hours for the three cycles (roughly corresponding with Asia, London Open and New York + London Close sessions).
Since charts are fractals, there's also intra-cycle time fibs available in the script, to highlight the smaller fractal equivalents in each cycle.
These cycles are used to visualize the three phases (AMD) for easier identification of the current daily profile by analyzing during what cycle highs and lows of the day are made.
An example of a bullish day could be price rallying before making a low during the accumulation cycle, being manipulated higher and retracing to form an optimal trade entry during the manipulation cycle, expanding and creating the high of the day before selling off during the distribution cycle, with a potential reversal before it ends.
Goldbach levels
The Goldbach levels are based on the size of a price range (or price swing, if you will) expressed as a factor of power of three (3^n).
To decide what number to tell the script to use for the calculation, we look at what 3^n number best fits an average swing on the preferred timeframe we're trading.
For example; PO3 27 (3^3)might be fit for scalping, while PO3 243 (3^5) may correspond to the daily or weekly range, depending on the asset.
The script then calculates a range high and a range low using a power of three formula based on the current price and divides it into levels using Goldbach numbers.
At these levels one might expect to see price form various "blocks" as defined in concept by Michael J. Huddleston.
The blocks that correspond to the Goldbach levels are labeled with abbreviations as follows:
Ext = External range
Low = Range low
High = Range high
FVG = Fair value gap
RB = Rejection block
OB = Order block
LV = Liquidity void
BR = Breaker
MB = Mitigation block
Using these levels and said blocks we identify where in the current running market maker profile price is offered, and trade the preferred timeframe in line with the AMD cycles accordingly.
█ FEATURES
Custom AMD time cycles session times.
Custom time fib for fractal cycles.
Color and style customization.
Show only current or also historical cycles.
Equilibrium mode for Goldbach levels (show only high/low and midpoint)
Autodetection of asset type, with manual override.
█ NOTE
The default timings for the AMD cycles are set up for Forex pairs. For other asset types, such as indices, other timings are nessecary for optimal results.
Goldbach levels requires the correct symbol type setting for the calculation to work properly. Disable the script's autodetection and enable/disable the Forex option according to the type of chart if it fails.
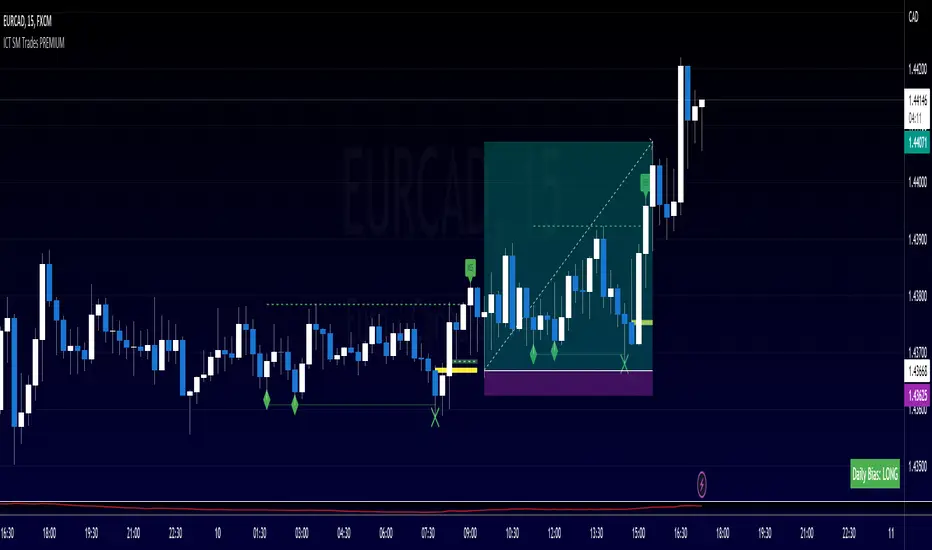
ICT SM Trades PREMIUMIndicator looks for ICT & Smart Money trades on any timeframe. These types of trades reveal how the big institutions, banks and hedge funds trade with big money. If they want their very big positions to be filled they need to find areas in chart where the majority of the money is sitting. Where is it? Where is the majority of orders placed? Right below supports or right above resistance, these orders are stoplosses or stop orders. So they need to push the price to these areas, take all the available stoplosses and trigger all the available stop orders in order to fill their positions and then push the price to the opposite side to make profit (and retail to lose).
Indicator looks for support or resistance (S/R) areas which are represented by dotted lines. This S/R areas are created by minimum of 2 pivot high/low (H/L). Every pivot H/L that creates the S/R area is marked with diamond label. This S/R area is called liquidity. After liquidity is created, indicator looks for liquidity grab (mostly represented by fast spike to this area - it is labeled with x-cross) and then price should go fast to the opposite side of the created structure. Indicator considers as a created structure everything that was created on the other side of the candles from the oldest pivot H/L which creates particular liquidity. For example, if liquidity is created with 3 pivot highs, indicator looks at the oldest pivot high and from there it is looking for the lowest low. Under this lowest low is dashed line which means that this level should be broken with closed candle. This action is called market structure shift (MSS), when the price shifted very fast from highs to lows. After MSS, when the price went fast to one direction, there were some imbalances in prices, in our example selling pressure was a lot bigger than buying pressure and there were created some long untested bearish candles. This untested areas in candles are called imbalances or gaps of fair value gaps (FVG). These are labeled with rectangles. It is expected that these gaps will be tested in near future to "balance the market".
We can put limit orders into these gaps (or into order blocks in PREMIUM indicator) and await some retracement after MSS to open our positions and after the positions are opened we can expect trend continuation in the direction where market structure shift was made (away from liquidity grab). So stoplosses can be placed above/below liquidity grab candle (marked with x-cross).
Alerts can be set for MSS to Long & Short and for liquidity grabs to Long & Short.
All settings of this indicator should be self-explanatory and most of them have tooltips for better understanding.
Index OverlayNote: use this indicator only with New York Timezone + you need to understand ICT concepts already, this indicator simplifies the chart work.
Also, in this script I added some open-source scripts from creators here on tradingview, but I forgot to annotate their names...
If you recognize your script, please text me and I'll add your credits.
features
- displays Midnight and Sunday open lines
- day separation (from midnight)
- FVGs
- VWAP (calculated from midnight open)
- daily labels
- TDH & TDL (liquidity)
- trading time window (from 9:30 to 12:00 ny time)
HOW TO USE
Combined with daily bias, the idea is to wait for 9:30 to open, and then wait for a liquidation of TDH (plotted in blue) or TDL (in red).
Once it happens, you can look for ICT buy / sell model, ideally in the 5m TF.

ICT - GAPs and Volume Imbalance
GAPs
Gaps are areas on chart where the price have moved sharply up or down, with no trading in between. Gaps often fill, but they don't have to.
Volume Imbalance
Volume imbalance - determined using 2 candles
Bullish Volume Imbalance - area between the close of 1st candle and the open of 2nd candle
Bearish Volume Imbalance - area between the close of 1st candle and the open of 2nd candle
How to use the indicator:-
When you find imbalance in volume or a GAP in the chart, you may expect price to rebalance it before continuation.
Importantly, GAPs/Imbalances do not always fill. Traders should never assume that a gap/imbalance will fill without understanding the reasons for the gap and monitoring trading activity around the gap.
Pair it with your current bias for better results.

Smart Money Concepts (SMC) [LuxAlgo]This all-in-one indicator displays real-time market structure (internal & swing BOS / CHoCH), order blocks, premium & discount zones, equal highs & lows, and much more...allowing traders to automatically mark up their charts with widely used price action methodologies. Following the release of our Fair Value Gap script, we received numerous requests from our community to release more features in the same category.
"Smart Money Concepts" (SMC) is a fairly new yet widely used term amongst price action traders looking to more accurately navigate liquidity & find more optimal points of interest in the market. Trying to determine where institutional market participants have orders placed (buy or sell side liquidity) can be a very reasonable approach to finding more practical entries & exits based on price action.
The indicator includes alerts for the presence of swing structures and many other relevant conditions.
Features
This indicator includes many features relevant to SMC, these are highlighted below:
Full internal & swing market structure labeling in real-time
Break of Structure (BOS)
Change of Character (CHoCH)
Order Blocks (bullish & bearish)
Equal Highs & Lows
Fair Value Gap Detection
Previous Highs & Lows
Premium & Discount Zones as a range
Options to style the indicator to more easily display these concepts
Settings
Mode: Allows the user to select Historical (default) or Present, which displays only recent data on the chart.
Style: Allows the user to select different styling for the entire indicator between Colored (default) and Monochrome.
Color Candles: Plots candles based on the internal & swing structures from within the indicator on the chart.
Internal Structure: Displays the internal structure labels & dashed lines to represent them. (BOS & CHoCH).
Confluence Filter: Filter non-significant internal structure breakouts.
Swing Structure: Displays the swing structure labels & solid lines on the chart (larger BOS & CHoCH labels).
Swing Points: Displays swing points labels on chart such as HH, HL, LH, LL.
Internal Order Blocks: Enables Internal Order Blocks & allows the user to select how many most recent Internal Order Blocks appear on the chart.
Swing Order Blocks: Enables Swing Order Blocks & allows the user to select how many most recent Swing Order Blocks appear on the chart.
Equal Highs & Lows: Displays EQH/EQL labels on chart for detecting equal highs & lows.
Bars Confirmation: Allows the user to select how many bars are needed to confirm an EQH/EQL symbol on chart.
Fair Value Gaps: Displays boxes to highlight imbalance areas on the chart.
Auto Threshold: Filter out non-significant fair value gaps.
Timeframe: Allows the user to select the timeframe for the Fair Value Gap detection.
Extend FVG: Allows the user to choose how many bars to extend the Fair Value Gap boxes on the chart.
Highs & Lows MTF: Allows the user to display previous highs & lows from daily, weekly, & monthly timeframes as significant levels.
Premium/Discount Zones: Allows the user to display Premium, Discount, and Equilibrium zones on the chart
Usage
Users can see automatic CHoCH and BOS labels to highlight breakouts of market structure, which allows to determine the market trend. In the chart below we can see the internal structure which displays more frequent labels within larger structures. We can also see equal highs & lows (EQH/EQL) labels plotted alongside the internal structure to frequently give indications of potential reversals.
In the chart below we can see the swing market structure labels. These are also labeled as BOS and CHoCH but with a solid line & larger text to show larger market structure breakouts & trend reversals. Users can be mindful of these larger structure labels while trading internal structures as displayed in the previous chart.
Order blocks highlight areas where institutional market participants open positions, one can use order blocks to determine confirmation entries or potential targets as we can expect there is a large amount of liquidity at these order blocks. In the chart below we can see 2 potential trade setups with confirmation entries. The path outlined in red would be a potential short entry targeting the blue order block below, and the path outlined in green would be a potential long entry, targeting the red order blocks above.
As we can see in the chart below, the bullish confirmation entry played out in this scenario with the green path outlined in hindsight. As price breaks though the order blocks above, the indicator will consider them mitigated causing them to disappear, and as per the logic of these order blocks they will always display 5 (by default) on the chart so we can now see more actionable levels.
The Smart Money Concepts indicator has many other features and here we can see how they can also help a user find potential levels for price action trading. In the screenshot below we can see a trade setup using the Previous Monthly High, Strong High, and a Swing Order Block as a stop loss. Accompanied by the Premium from the Discount/Premium zones feature being used as a potential entry. A potential take profit level for this trade setup that a user could easily identify would be the 50% mark labeled with the Fair Value Gap & the Equilibrium all displayed automatically by the indicator.
Conclusion
This indicator highlights all relevant components of Smart Money Concepts which can be a very useful interpretation of market structure, liquidity, & more simply put, price action. The term was coined & popularized primarily within the forex community & by ICT while making its way to become a part of many traders' analysis. These concepts, with or without this indicator do not guarantee a trader to be trading within the presence of institutional or "bank-level" liquidity, there is no supporting data regarding the validity of these teachings.

SMM - Smart Money IndicatorHello Traders,
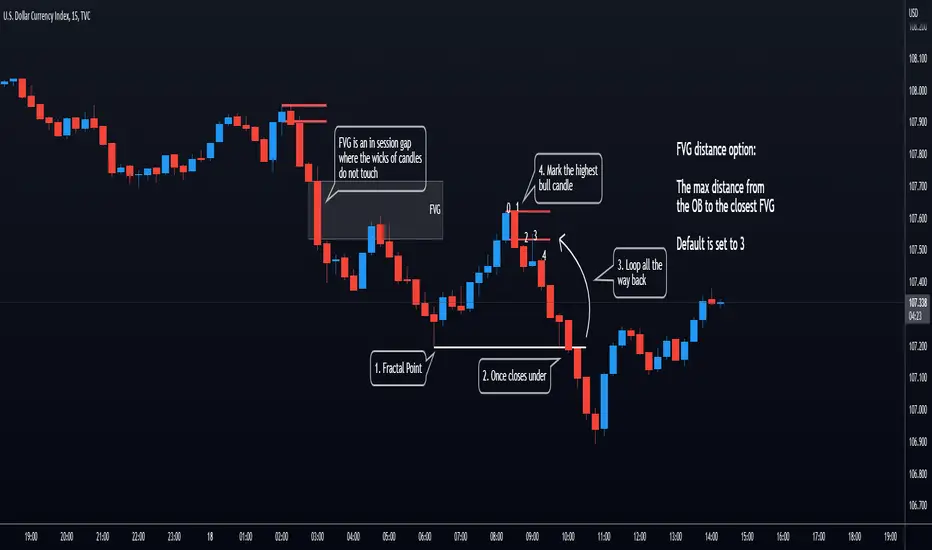
SMM – Smart Money Indicator is a Smart Money Concepts indicator that is meant to make your trading a bit easier and take the guess work away. Our mission is to save your time with already marking up the chart for you (all automatic). This indicator will help you spot the point of interests a.k.a. Order Blocks, Supply and Demand zones and Fair Value Gaps. Our mission is to create the best Smart Money Concepts indicator on the market. For that we would like to receive your guy’s feedback on it.
Smart Money refers to the capital that institutional investors, central banks, and other professionals or financial institutions control. Market Structure is the foundation of price action trading, understanding price action is fundamental to SMC .
Market Structure based of fractals – We are using fractal-based market structure since it’s way stronger than for example an Eliot wave. So, we only get the clearest break of structure (BoS- Trend continuation) and Change of Character (CHoCH- Possible change of trend)
Features
- Changing the break type to either only the body or body and the wick
- Period of looking back to determine structure (combined with the supply and demand zones)
Multiple Time frame Supply and Demand – Displayed typically as the last up/down candle before a big move in the opposite direction. Great zones to entry from on the lower time frame, also you can target previous demand/supply zones as potential take profit areas.
Features
- Multiple time frame
- Changing the amount of candles to calculate the zones.
- Option to remove mitigated zones / change color
- Extending the HTF Box to current time. (If not mitigated)
Order Blocks – What we use for our lower time frame zones to enter from. It’s basically the same as supply and demand but then on a lower time frame. Most likely once prices come into your higher time frame Supply and Demand zones, we would scale down to the lower time frames and then wait for our pattern to entry.
Features
- Extending the LTF Box to current time. (If not mitigated)
- Options to remove mitigated zones / change color
Fair Value Gaps - Is also known as an imbalance. An FVG is an imbalance of orders for instance, for sellers to complete their trades, there must be buyers and vice versa so when a market receives to many of one kind of order buys or sells, and not enough of the order’s counterpart. When the amount is not balanced and to many orders are put in for one direction, it creates an imbalance where price likes to get back too. We have 2 different options that shows you all the imbalances but also one that only shows the structure breaking imbalances which we see as the most important one.
Features
- Plotting all Fair Value Gaps
- Plotting only structure breaking Fair Value Gaps
Previous Day High and Low – Will mark up the previous day high and low what could indicate that if price breaks out of the previous day high that it will most likely trend upwards. If it breaks below, it will most likely trend down for the upcoming time.
- Showing only the recent previous day high and low
- Showing all the previous high and lows
- Show nothing
Alerts – We’ve made possible that you can also choose to receive an alert on your device once price comes in to one of the supply and demand zones. (Must place the alerts function into your alert management tab on trading view) Only works if you add the alert on when you are on the same time frame as your supply and demand zones.
You can also choose to receive alerts when a supply or demand zone has been created.

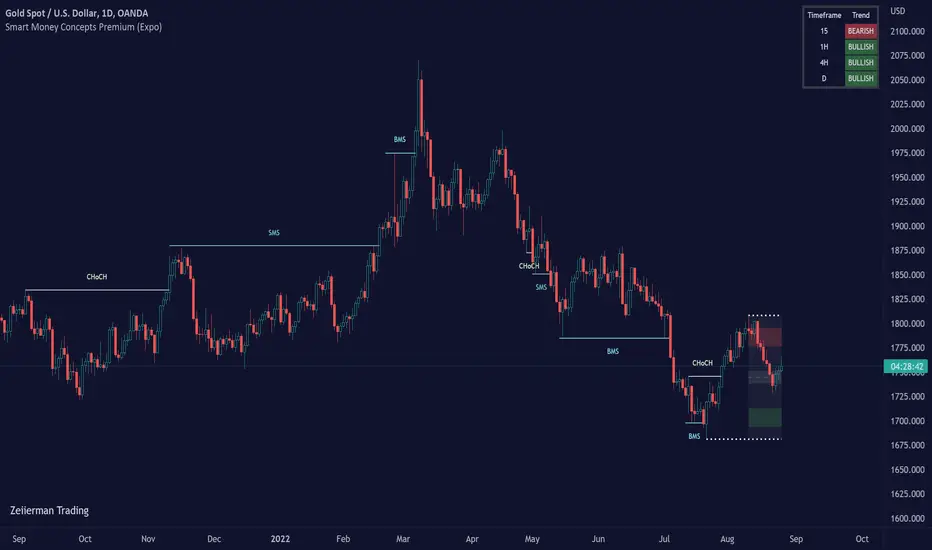
Smart Money Concepts Premium (Expo)Are you a professional Smart Money Concept Trader?
█ This premium version of our SMC indicator includes all advanced Smart Money Concept Trading techniques. The indicator includes all the important concepts such as Market Structure, Change of Character, Current Trading Range, Premium & Discount , Fractals, and Swing Structure. The indicator includes the popular SMC Market Structure Trend to help traders analyze the trend.
In addition to these features, this version adds the following:
Multitimeframe option
Predicted Structure and Range
Backtesting option
External Range Liquidity
Internal Range Liquidity
Liquidity Grab
Fair Value Gap (FVG)
True Fair Value Gap
Imbalance
Order block
Orderflow
Supply & Demand
Equal Highs and Equal Lows
Point of Interest
An alert function that allows you to set any combination of alerts.
This indicator aims to be an all-in-one SMC indicator that helps Smart Money Traders automate their analyzes.
█ HOW TO USE
Use the indicator to trade advanced SMC Trading techniques.
█ Settings
The indicator is fully customized and can be adjusted to fit Swing Trading, Trend Trading, Day Trading, or Scalping.
The indicator works in any market and timeframe.
-----------------
Disclaimer
Copyright by Zeiierman.
The information contained in my Scripts/Indicators/Ideas/Algos/Systems does not constitute financial advice or a solicitation to buy or sell any securities of any type. I will not accept liability for any loss or damage, including without limitation any loss of profit, which may arise directly or indirectly from the use of or reliance on such information.
All investments involve risk, and the past performance of a security, industry, sector, market, financial product, trading strategy, backtest, or individual's trading does not guarantee future results or returns. Investors are fully responsible for any investment decisions they make. Such decisions should be based solely on an evaluation of their financial circumstances, investment objectives, risk tolerance, and liquidity needs.
My Scripts/Indicators/Ideas/Algos/Systems are only for educational purposes!
Smart Money Concept (Expo)Are you Trading SMC? - Are you willing to learn how to apply SMC techniques? - Great, this indicator is for you!
█ This Smart Money Concept ( SMC ) indicator is a sophisticated and highly innovative indicator that combines all the necessary features to trade SMC trading techniques. It is built off of Smart Money Concepts inspired by inner trader circle (ICT) teachings. Smart Money is considered the capital allocated by institutional investors, funds, and other larger financial market participants. This indicator takes the Institutional trading behavior and makes it accessible to retail investors. By using an SMC indicator, you get professional insights into the market.
█ This indicator provides you with all of the most important SMC principles in one indicator. Fully automated and real-time Break of Market Structure, Change of Character, Current Trading Range, Premium & Discount , Fractals, and Swing Structure. In addition to the most important features, we have added a highly unique SMC Market Structure Trend based on the market structure principle. A confirmed swing structure trend background enhances the trend feature even more.
Swing Structure
Identifying major market structures with the indicator.
Current Trading Range
The Range feature ensures that traders always know where the current range is and where to find Premium and Discount within that range. In addition, the range is updated in real-time without any delay.
Premium & Discount Zones
Identifying Premium and Discounts zones automatically for you.
Structure break
Break of Market Structure ( BMS ) and Change of Character ( CHoCH ) - are automatically identified and plotted in real-time.
Supply and Demand
Use our Supply/Demand indicator to identify high probabilities trading zones.
█ HOW TO USE
Use the indicator to trade SMC Trading techniques.
Use the indicator to understand the current market structure.
Use the indicator to identify the current range and premium and discount levels.
█ Settings
The Market structure period is fully customized and can be adjusted to fit Swing Trading, Trend Trading, Day Trading, or Scalping.
The indicator works in any market and timeframe.
█ Basic Terminology
S&D - Supply & Demand
S2D - Supply to Demand
D2S - Demand to Supply
OB - Orderblock
AOI - Area of Interest
POI - Point of Interest
LOR - Level of Respect
FLOR - First Level of Respect
IMB - Imbalance
INF - Inefficiency
FVG - Fair Value Gap
IRL - Internal Range Liquidity
ERL - External Range Liquidity
HH - Higher High
HL - Higher Low
LL - Lower Low
LH - Lower High
BOS - Break of Structure
BMS - Break of Market Structure
mBOS - Minor Break of Structure
SMS - Shift in Market Structure
CHoCH - Change of Character
mCHoCH - minor Change of Character
EQH - Equal Highs
EQL - Equal Lows
BSL - Buy Side Liquidity
SSL - Sell Side Liquidity
LQ - Liquidity
EQ - Equilibrium
PA - Price Action
MTF - Multi Timeframe
HTF - Higher Timeframe
LTF - Lower Timeframe
PT - Protrend
CT - Counter trend
OF - Orderflow
EOF - Expectational Orderflow
LOD - Low of the Day
HOD - High of the Day
HOW - High of the Week
LOW - Low of the week
RE - Risk Entry
CE - Confirmation Entry
DCE - Double Confirmation Entry
SL - Stop loss
RR - Risk Reward
BFI - Banks & Financial Institutions
Hedgies - Hedge Funds
-----------------
Disclaimer
Copyright by Zeiierman.
The information contained in my Scripts/Indicators/Ideas/Algos/Systems does not constitute financial advice or a solicitation to buy or sell any securities of any type. I will not accept liability for any loss or damage, including without limitation any loss of profit, which may arise directly or indirectly from the use of or reliance on such information.
All investments involve risk, and the past performance of a security, industry, sector, market, financial product, trading strategy, backtest, or individual's trading does not guarantee future results or returns. Investors are fully responsible for any investment decisions they make. Such decisions should be based solely on an evaluation of their financial circumstances, investment objectives, risk tolerance, and liquidity needs.
My Scripts/Indicators/Ideas/Algos/Systems are only for educational purposes!

Orderblocks (Nephew_Sam_) - Open sourceHighlights orderblocks based on fractal market structure.
Whenever a new fractal high/low is created, it will search for the Orderblock and plot lines and labels
Options:
1. Select 3/5 bar fractal
2. Plot lines and labels on OB's
- Ability to filter OB only when a candle is fully engulfed
3. Change bar color of engulfed candles
4. Option to filter OB that follows with an FVG
View the published chart for more details on how this indicator works
Disclaimer: You have the permissions to use this code however make sure you give me the credits when you do and make it open source or grant me access to the code.
Imb finderThe indicator finds imbalance's zone
Support:
- Two dynamic color
- Hides fulfiled blocks
- Extends last active imabalance's zone

Price Action All In One IndicatorIf you are the one who is "Price Action" style & does not want to use many indicators or complex indicators or you are an ICT (The Inner Circle Trader)
student or ICT charter, this simple beautiful All In One Indicator is right for you.
The indicator has the following functions.
TIME ZONE SETTING
The default timezone is New York Time GMT-4, if you leave the time zone setting blank, it will use the symbol timezone. Note that the trading time changes with one hour delay in winter. so if you just trade forex, and leave the time zone setting blank, TradingView will adjust the symbol timezone automatically for you or don't forget to change the timezone setting GMT-4 or GMT-5 depending on daylight saving time.
STATISTIC PANEL
You can choose which panel to show through settings.
Session Info Panel : pips info of ADR, Asian, London, and New York sessions.
Trend Panel : showing trend (up/down) of
5m/15m/1h/4h/D/W time frames (TF)
4MA (default values: SMA with lengths: 20–50–100–200)
Money Management Panel : in trading, money management is very important. Just put the % risk, & stop loss value below, the indicator will calculate a suitable size/amount for each trade.
Size by Lots: input stop loss in pips
Size by Units: input stop loss in % (of price)
(*)Units size is calculated by % stop loss & current bar close price. You have to determine a stop-loss price to convert to % stop loss by yourself.
TIME SEPARATORS
We can choose which time separators we want to display. The indicator has 5 options: Anchor Time/Day/Week/Month/Quarter. Of course, we can choose to show just one or all 5 of them.
With Anchor Time you can choose which time you want to draw a vertical line for better timing analysis. This can show up to 2 Anchor Time lines. The default values are 00:00 (New York Midnight Opening) and 08:30 (New York Session Opening). You also have an option to show the past lines or not.
About Day Separator, cause TradingView has supported Session Breaks in Setting but if you don't like to use it or when enabling, it distracts you, you can use mine. My favorite trading dates are Tuesday & Wednesday.
PRICE LEVELS
For intraday trading, the high/low/close of the previous day, the previous week, ADR (default period is 5) are very important key levels. You can choose which one you like to show for better analysis. Of course, you can change the color & style of the lines. This is also my favorite indicator.
This indicator also has an option to show up to 2 price lines at a specific time, you can choose the price type (high/low/close/open) that you want to display. The default time values are:
Specific Time 1: 0:00. (New York Midnight Opening Price)
Specific Time 2: 8:30 am. (New York Session Opening Price)
ACCUMULATION ZONE
The market tends to reprice the higher/lower to the old high/low or imbalance/fair value price to promote buy/sell stops or to provide smart money pricing for long/short entries. Typically, it redistributes quickly and you must learn to anticipate them at key levels intraday. Weak short/long holders will be squeezed in the retracement.
Except for the open price, the price changes continuously until the closing time, so the accumulation area can also be changed in real-time, but if you combine it with other information when analyzing, you can predict/determine whether the zone has been established or not with high probability. In short, price needs time to be accumulated, I usually don't pay attention to this daily zone till London open/close or New York sessions
Not only daily zone, but the indicator also supports higher timeframes accumulation zone from
SESSION & STD
There are 3 sessions: Asian, London, New York. The default values are below (New York Time).
Asian: 19:00 ~ 00:00
London Open (London KillZone): 01:00 ~ 05:00
New York Open (New York KillZone): 07:00 ~ 10:00
If you do not want to show the label, just leave the label values blank or change them to whatever you want.
This is one of my favorite functions. I use it on 15m, 30m, 1h TF for Forex intraday trading. My favorite trading sessions are London Open & New York Open.
You also can choose to show or not Standard Deviations (STD). The default values are set for Asian Range STD and max STD levels can be shown are 5. I use the following 3 types of STD (New York Time):
CBDR (Central Bank Deviations) STD: 14:00 ~ 20:00
Flout STD: 15:00 ~00:00
Asian Range STD: 19:00 ~ 00:00
LOOKBACK HIGH/LOW/MID
Can show high/low/mid of the data ranges on the daily/4h chart. The default values are:
- 20–40–60 days back from today for daily TF.
- 30–60–90 bars back from the latest bar for 4h TF.
The default anchor bar for calculating the lookback is the latest one but with:
- 4h TF: we can change the lookback from the 1st day of the week.
- Daily TF: we can change the lookback from the 1st day of the month.
The indicator also has options showing the high/low/mid (equilibrium level) lines for better analysis. Especially, on daily TF, we have the option that can show up to 4 lines (25% for each one) of the data range.
Of course, you can change the colors or the style of the high/low/mid lines.
The lookback can be shown on the lower TFs for better detection when the market structure is shifted.
MAGIC BARS
Fractal bar : The bar's color is changed when the divergence occurs between the price & RSI. You can change the RSI period (default value is 14) & RSI source. (open/high/low/close,…)
Imbalance bar or liquidity void or fair value gap - whatever you call it. This is my favorite indicator when trading on all TFs.You can choose to extend the last n imbalance bars if you like in the settings. I make sure I covered all cases of imbalance/fair value gap.
OLD HIGH/LOW
First, this function is not used as the common Support & Resistance that retail traders usually use, so I call it Old High/Low. I usually use it in 2 ways:
Detect the next buy/sell stops that Market Makers aim to manipulate.
Detect whether market structure shifted or not (Break of structure)
In settings you can:
Set the period to detect high/low levels, the default value is 10. My other favorite values are 6 & 2.
On a lower time frame, you might want to set it to a large number to remove noise.
On a higher time frame, a small number is enough, I think.
Choose the numbers of the last lines you want to show on your chart.
Of course, the style of lines can be changed easily.
TRENDLINES
A very simple trendline with default pivot left strength is 10.
By default, trendline uses high/low price but you have the "Using close price" option.
LINEAR REGRESSION CHANNEL
The Linear Regression Channel is a three-line technical indicator used to analyze the upper and lower limits of an existing trend. It is a statistical tool used to predict the future from past data and is used to determine trend direction or when prices may be overextended.
You can choose
To fill the background or not
To show inner/outer lines or not
To change the colors/line styles of upper zone, lower zone, upper lines, lower lines, midline
DIRECTION BOX
Working on all TFs, this looks like the same with lookback function but if you would like to display them in a box for easily focusing/comparing with other symbols or for detecting divergence in a specific period. The indicator also has a setting to show or hide lines connecting between lows or highs.
Another example of how I use High/Low connecting lines to detect divergence between S&P 500 and NASDAQ 100.
ZIG ZAG
Can show up to 2 ZigZag lines.
This is suitable for traders who have difficulty in detecting key levels (recent high/low) of the prices to confirm market structure or just for drawing Fibonacci easily at those levels.
MA (Moving Average)
I believe that this is one of the most used indicators for every trader. There are 5 types of MA to choose from: EMA, SMA, WMA, VWMA, SMMA(RMA).
This can show up to 4 MAs. You can choose the source (close/high/low,…) for each one. My favorite values are 34 & 89 EMA.
This indicator also supports MA Bands. You can select which MA you want to display the bands, and the "width" of the bands can be changed via the settings.
WATERMARK
It's just a simple function but I think it's very useful for those who want to add Copyright info to the chart, to prevent others from copying it.
Others/known issues/limitations
In forex or stock (things that are traded only on weekdays), TradingView's does not include the latest bars till Monday so the Day Separator cannot fill that space. Because TradingView deals with those bars as Sunday's ones so I set the color of Sunday the same as Friday for good UI/UX. On Crypto charts, the indicator shows without problems.
If you see "Internal server study error", please try closing the current TradingView tab in your browser and reopening it in a new tab. The error will disappear.
Because TradingView does not provide any detailed error information when such "general error" occurs. It's very difficult to detect which function is causing this error or is there something that caused TradingView "overloaded" through a long time running/loading on that tab? Honestly, I don't know exactly the cause, but in my experience, this error often occurs in the following cases:
When you have the TradingView Tab open for hours. In my case, I usually leave TradingView tab open overnight & when I come back the next day, this error might appear. (I'm a Mac user & I almost never shut down my Mac)
When you change settings too many times, especially settings of drawing objects like line width in a using session, it might cause this error.
So, after changing the setting or when you come back for the next trade, please save & close that TradingView tab, and then open a new one, everything will work fine.
You can see the images below that show I have tested my indicator from 1-minute time frame, enabled all functions, change every setting to max values & everything still works fine.

ICT Session Killzone Boxes & DeviationsICT Killzone Sessions Boxes & Deviations is a convenience indicator that marks out past and future ICT killzones for Asia, London, and New York, London Close and CBDR.
The boxes highlights the highest and lowest candle opens of that session/killzone, which is what the deviations are based on. Two lines mark out the highest high and lowest low of that session.
This indicator also includes New York midnight opening price and a vertical divider showing you that time.
Future killzones are also marked out.
All times are set to GMT-4 so these boxes should work across most exchanges. Times and code can be changed if a few don't match up.
Included are week of day labels for your convenience.
For those who are unfamiliar, ICT Killzones are optimal times to look for trades during or before a session, often providing entry for trades with orderblock tests, FVG fills or stophunts.
Please note: This indicator only works well on 1HR timeframe and below. The default max timeframe setting is set to 15min, which can be changed in the menu.
There may be some bugs so please highlight anything you find in the comments below :)
Shout out to @Ryazn for all the ideas!