Shelf FVG Alert Multi TF 3 [FINAL]shelf best i have ever seen it. thats pattern shows zones where we can see impuls
在腳本中搜尋"fvg"

SMC Yardımcısı - TR (Optimize v2.1)BOS (Break of Structure)
Labels when price closes above/below a previous swing high/low.
Shows continuation of the current trend.
CHOCH (Change of Character)
Appears when trend direction shifts (from bullish to bearish or vice versa).
Marks possible market reversals.
FVG (Fair Value Gap)
Highlights price imbalance zones (3-candle gaps).
These are often areas where price later returns to “fill” liquidity.
OTE (Optimal Trade Entry, 62–79% retracement)
Uses the last swing high and swing low.
Draws the Fibonacci retracement zone (62–79%), considered a common institutional entry area.
BSL (Buy Side Liquidity – Equal Highs)
Detects equal highs and plots them as liquidity pools.
Shows where buy-side liquidity/stop hunts may occur.
SSL (Sell Side Liquidity – Equal Lows)
Detects equal lows and plots them.
Indicates sell-side liquidity levels.
Inducement / Liquidity Sweep
If price wicks above BSL or below SSL but closes back inside, a “sweep” label is shown.BOS (Break of Structure – Yapı Kırılımı)

PreviousDayHLEQCME_MINI:NQ1!
Indicator Overview: The "PreviousDayHLEQ" indicator is an essential tool for traders employing Inner Circle Trader (ICT) methodologies, designed to plot the High (H), Low (L), Equilibrium (EQ, the midpoint between high and low), and Optimal Trade Entry (OTE) levels at 61.8%, 70%, and 79% of the previous trading day's range. It provides a clear visual reference for potential support, resistance, and entry zones based on the prior day's price action, helping traders anticipate continuations or reversals in the current day. This indicator stands out by incorporating directional OTE auto-detection, adjusting levels based on whether the previous day formed a new high or low relative to the day before, offering insights into market bias without manual recalculation.
Core Functionality: It tracks and displays the previous day's high and low, calculating the EQ as the average for balance points, and OTE levels as percentage retracements of the range. The script uses a user-defined trading day definition (with timezone support) to accurately capture the day's extremes, ensuring alignment with global market sessions. This core setup allows traders to quickly identify key ICT levels like fair value gaps or liquidity pools from the prior day.
Unique OTE Auto Detection: One of the indicator's most innovative features is its automatic detection of OTE direction. If the previous day made a new high compared to the day before, OTE levels are calculated downward from the high to the low (bearish bias), highlighting potential short entries. Conversely, a new low triggers upward OTE levels from the low to the high (bullish bias), signaling long opportunities. This auto-detection is unique, as it dynamically adapts to historical price expansion without user input, a capability not found in standard previous day indicators that typically use fixed directions. It empowers ICT traders to gauge carry-over momentum from the prior day, such as in scenarios where a bullish expansion suggests buying dips to the 61.8% level.
Directional Bias Indication: Beyond plotting levels, the OTE calculation inherently indicates the previous day's bias (expansion upward or downward), providing context for current day trades. This unique bias detection helps traders align with market structure, e.g., favoring shorts if OTE is downward-oriented, enhancing decision-making in ICT frameworks like order block identification.
Left-Side Trimming Innovation: The indicator includes a highly unique left-side trimming option, allowing users to restrict the historical extension of lines to a specified number of bars (e.g., the last 8 bars). This reduces visual clutter on charts with long history, focusing attention on recent and relevant price action—a feature rarely seen in previous day indicators, where lines often span the entire chart and obscure current developments. Traders can toggle trimming on/off and adjust the bar count, making it ideal for clean, professional setups.
Customization and Visual Controls: Users can fully customize line colors (separate for high, low, EQ, and each OTE level), styles (solid, dashed, dotted), and label properties (text color, background color, transparency, size). This level of granularity ensures the indicator fits any chart theme or strategy, with options to enable/disable individual elements like EQ or OTE for minimalistic views. The stick-right label option keeps labels visible as the chart updates, preventing overlap.
Auto-Deletion at Trading Day End: Levels can be automatically cleared at the indicator's calculated market close (17:00 NY time), a unique feature that prevents accumulation of outdated data, keeping the chart fresh for the next day. This is particularly useful for day traders who reset their setups daily.
No External Dependencies: The indicator operates solely on chart price data using built-in Pine Script functions, ensuring reliability and compatibility without needing additional libraries or internet access.
How It Works
Previous Day Data Capture: The script identifies the previous trading day using the user-defined timezone and calculates high, low, EQ, and OTE levels based on that day's range.
OTE Calculation: Levels are computed as percentages of the range, with auto-detection switching direction if a new high/low was made relative to the day before.
Drawing and Trimming: Lines are plotted with user-set padding for extension, and trimming cuts the left side to focus on current action.
Update Mechanism: Levels update in real-time as the previous day's data is fixed, but the script refreshes on chart reloads or new days.
Deletion Logic: At market close, if auto-delete is enabled, all elements are removed to prepare for the next cycle.
Uniqueness and Innovation
Session OTE Auto Detection: Automatically determines OTE direction based on previous day's high/low expansion, a rare feature that provides bias insights not available in basic previous day high/low indicators, aiding ICT traders in identifying entry zones with market context.
Left-Side Trimming: This innovation allows customizable historical line length, solving chart clutter issues unique to previous day indicators that typically show full history, enhancing usability for live trading.
Directional OTE with Multi-Level Support: Combines auto-bias detection with three OTE percentages (61.8%, 70%, 79%), offering more granular entry options than single-level tools, tailored for ICT's focus on range retracements.
Independent Customization per Element: Separate controls for high, low, EQ, and OTE colors/styles, plus transparency and size, provide unmatched flexibility compared to rigid indicators.
Auto-Deletion for Cleanliness: Unique cleanup at market close prevents level buildup, a practical feature for multi-day analysis not commonly implemented in similar tools.
How to Use It
Setup: Add to chart, configure timezone (e.g., "America/New_York"), and enable the indicator.
Customization: Adjust line colors (e.g., blue for high), styles (dashed for OTE), and enable trimming (8 bars for focus).
Interpretation: Use OTE for entries (e.g., buy at 61.8% in bullish bias); EQ for reversion.
Tips: Test on historical data; combine with ICT concepts like CISD, FVG etc.
This indicator elevates ICT trading with its auto-detection and trimming. Use with risk management; trading carries risk

HTF POC with Zones & AlertsPlots a Point of Control (POC) per candle from a timeframe you choose (MTF). Because TradingView doesn’t expose true footprint data, the POC here is a proxy (choose: Body Mid, Range Mid, or Typical Price HLC3). The script draws the POC line and an optional POC zone (±% of that candle’s range), then alerts when price retests the zone (wick touches count).
Use it to:
Mark key levels inside candles that often act as magnets or reaction zones
Track retests of strong bars (imbalance) across higher timeframes
Add clean confluence with S/R, FVGs, or trend tools
Features: Selectable TF, zone width, extend lines/zones, historical caps, alerts, and info panel.
Note: This is an estimate of POC from OHLC, not real bid/ask volume. Use as context, not a standalone signal.

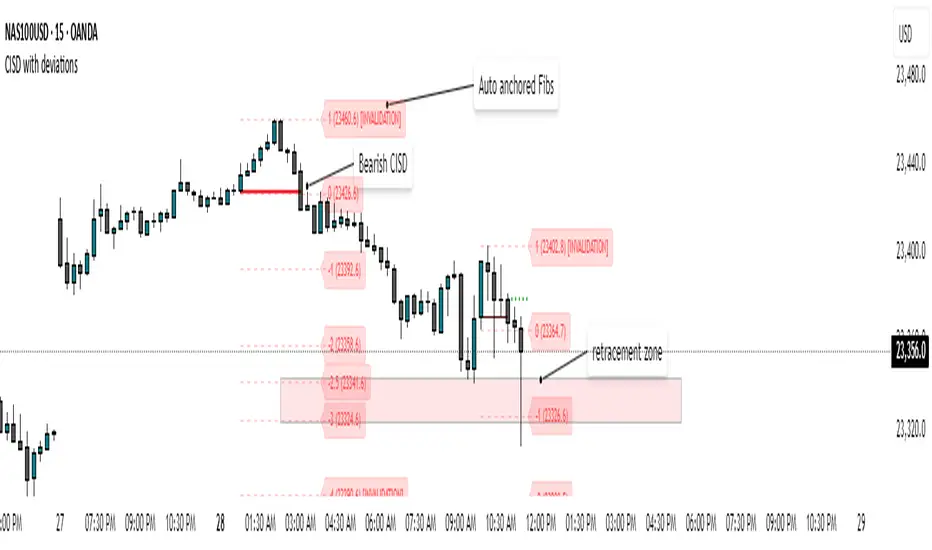
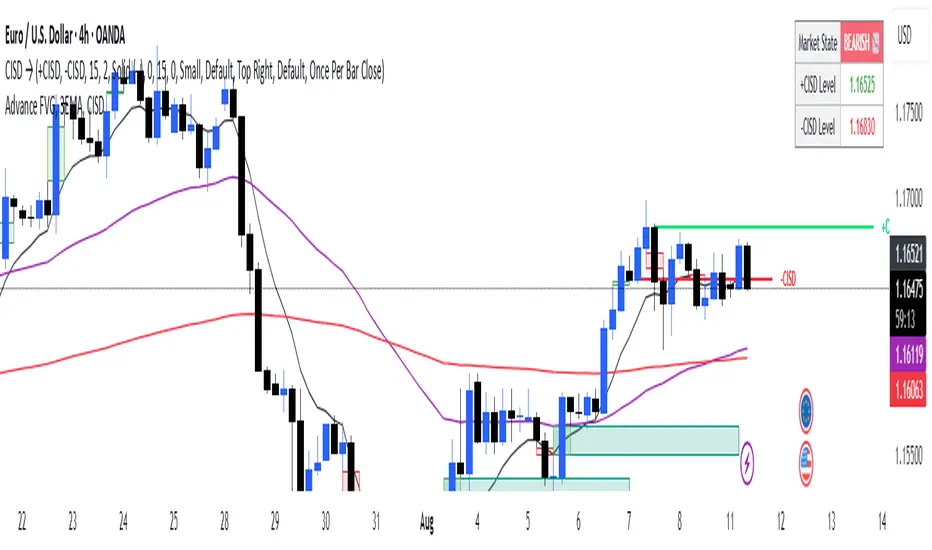
CISD with deviationsChange in State Delivery (CISD) is a well-recognized concept and serves as a key signal for identifying market direction through the behavior of CISD levels. In this approach, CISD is applied as the core measure of market structure, removing the variability that comes from user-defined interpretations.
How does it works :
Identifies CISD levels as the market delivers price.
Track whether price respects or violates these levels.
A confirmed shift (change in state) signals a potential transition in trend
Provides a clean structure map to guide execution
How to use it :
1)Align CISD shifts with your higher timeframe bias and the deviation levels marked by the indicator which often serve as the area for retracement or continuations.
2) Use CISD confirmation as a filter for trade entries.
3) Combine with liquidity pools, FVGs, or session timing for added confluence.
Features covered :
1) Automatic Bearish and Bullish CISD plotting.
2) Anchored Fibonacci levels are plotted based on the confirmed CISD. The Fibonacci levels are fixed and cannot be modified by the user because these levels serve a purpose.
3) Alerts can be set up by the users for whenever a bearish/bullish CISD is confirmed.
4) Automatic invalidations are set so that when price invalidates a CISD or hits the -4 level of a CISD as full target level, the CISD is automatically removed.
5) Currently , the maximum CISDs visible are limited to 3 each (bullish and bearish) to avoid cluttering on the chart.
Volume Imbalance Analyzer - 70% & 80% Version1.01Here’s a clean “definition” you can drop into your docs. It explains **what** the indicator is, **what it helps with**, and **how** to use it—plain and practical.
# Definition
**Volume Imbalance Analyzer (70% & 80%)** flags bars where estimated buy vs. sell volume is heavily one-sided. It colors those bars, adds labels (B70/B80 or S70/S80), and can alert you in real time. The goal is to quickly spot spots of **aggressive participation** (buyers or sellers) that often act as magnets for a **retest** or as **exhaustion/continuation** areas.
# What it helps you do
* **Find high-energy bars** where one side dominates (potential turning or continuation points).
* **Plan retests:** Track when price comes back into the imbalance candle’s range (common entry/take-profit logic).
* **Filter trades:** Only act when the market shows unusual pressure (≥70% or ≥80%).
* **Add context to setups:** Combine with S/R, FVGs, or trend tools to time entries with less guesswork.
* **Alert-driven workflow:** Get notified the moment extreme pressure prints.
# How it helps (workflow)
1. **Scan for signals:**
* **B80/B70** = strong buying; **S80/S70** = strong selling.
* 80% is “extreme” and overrides 70%.
2. **Mark the zone:** The imbalance candle’s **high–low** defines a zone. Many traders wait for a **retest** into that range.
3. **Decide intent:**
* After **B80/B70**, look for pullbacks to buy (or fades if you see exhaustion).
* After **S80/S70**, look for rallies to sell (or fades if exhaustion).
4. **Confirm with context:** Check trend, key levels, liquidity, session timing, ATR/volatility.
5. **Manage risk:** Place stops beyond the zone; size trades so a failed retest doesn’t ruin the day.
# How it works (under the hood, briefly)
The script **estimates buy/sell volume** from each candle’s body, wicks, and total volume, then computes an **imbalance %**. If the % crosses **70%** or **80%** (scaled by a Sensitivity setting), it paints the bar, drops a label, and optionally fires an alert. It also stores the imbalance candle’s range so you can watch for a **retest**.
# Reading the signals (quick guide)
* **B80**: Extreme buyer pressure → watch for pullback buys or exhaustion shorts, depending on context.
* **B70**: Strong buyer pressure → mild continuation bias.
* **S80**: Extreme seller pressure → watch for rally sells or exhaustion longs.
* **S70**: Strong seller pressure → higher reversal probability noted in the table (informational).
# Configuration tips
* **Sensitivity**: Higher = more bars qualify (more signals).
* **Label distance**: Scales with ATR so labels don’t overlap candles.
* **Colors/opacity**: Separate for 70% vs 80% and buyer vs seller.
* **Alerts**: Enable to catch signals live without staring at the screen.
# Notes & limits
* Uses **estimation** (not true bid/ask) on most symbols; treat as a **context tool**, not a stand-alone system.
* The optional stats table’s “expected outcomes” are **informational**, not live probabilities.
* Works on any timeframe; results improve when combined with structure and risk controls.

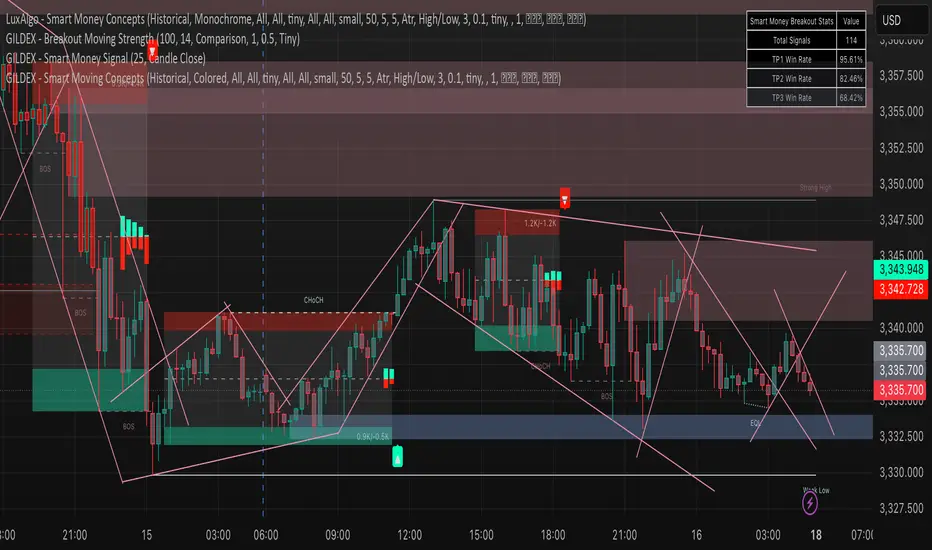
Smart Moving Concepts [GILDEX]This all-in-one indicator displays real-time market structure (internal & swing BOS / CHoCH), order blocks, premium & discount zones, equal highs & lows, and much more...allowing traders to automatically mark up their charts with widely used price action methodologies. Following the release of our Fair Value Gap script, we received numerous requests from our community to release more features in the same category.
"Smart Money Concepts" (SMC) is a fairly new yet widely used term amongst price action traders looking to more accurately navigate liquidity & find more optimal points of interest in the market. Trying to determine where institutional market participants have orders placed (buy or sell side liquidity) can be a very reasonable approach to finding more practical entries & exits based on price action.
The indicator includes alerts for the presence of swing structures and many other relevant conditions.
Features
This indicator includes many features relevant to SMC, these are highlighted below:
Full internal & swing market structure labeling in real-time
Break of Structure (BOS)
Change of Character (CHoCH)
Order Blocks (bullish & bearish)
Equal Highs & Lows
Fair Value Gap Detection
Previous Highs & Lows
Premium & Discount Zones as a range
Options to style the indicator to more easily display these concepts
Settings
Mode: Allows the user to select Historical (default) or Present, which displays only recent data on the chart.
Style: Allows the user to select different styling for the entire indicator between Colored (default) and Monochrome.
Color Candles: Plots candles based on the internal & swing structures from within the indicator on the chart.
Internal Structure: Displays the internal structure labels & dashed lines to represent them. (BOS & CHoCH).
Confluence Filter: Filter non-significant internal structure breakouts.
Swing Structure: Displays the swing structure labels & solid lines on the chart (larger BOS & CHoCH labels).
Swing Points: Displays swing points labels on chart such as HH, HL, LH, LL.
Internal Order Blocks: Enables Internal Order Blocks & allows the user to select how many most recent Internal Order Blocks appear on the chart.
Swing Order Blocks: Enables Swing Order Blocks & allows the user to select how many most recent Swing Order Blocks appear on the chart.
Equal Highs & Lows: Displays EQH/EQL labels on chart for detecting equal highs & lows.
Bars Confirmation: Allows the user to select how many bars are needed to confirm an EQH/EQL symbol on chart.
Fair Value Gaps: Displays boxes to highlight imbalance areas on the chart.
Auto Threshold: Filter out non-significant fair value gaps.
Timeframe: Allows the user to select the timeframe for the Fair Value Gap detection.
Extend FVG: Allows the user to choose how many bars to extend the Fair Value Gap boxes on the chart.
Highs & Lows MTF: Allows the user to display previous highs & lows from daily, weekly, & monthly timeframes as significant levels.
Premium/Discount Zones: Allows the user to display Premium, Discount, and Equilibrium zones on the chart
Multi-Timeframe Bias Dashboard + VolatilityWhat it is: A corner table (overlay) that gives a quick higher-timeframe read for Daily / 4H / 1H using EMA alignment, MACD, RSI, plus a volatility gauge.
How it works (per timeframe):
EMA block (50/100/200): “Above/Below/Mixed” based on price vs all three EMAs.
MACD: “Bullish/Bearish/Neutral” from MACD line vs Signal and histogram sign.
RSI: Prints the value and an ↑/↓ based on 50 line.
Volatility: Compares ATR(14) to its SMA over 20 bars → High (>*1.2), Normal, Low (<*0.8).
Bias: Combines three votes (EMA, MACD, RSI):
Bullish if ≥2 bullish, Bearish if ≥2 bearish, else Mixed.
Display:
Rows: D / 4H / 1H.
Columns: Bias, EMA(50/100/200), RSI, MACD, Volatility.
Bias cell is color-coded (green/red/gray).
Position setting lets you park the table in Top Right / Bottom Right / Bottom Left (works on mobile too).
Use it for:
Quickly aligning intraday setups with higher-TF direction.
Skipping low-volatility periods.
Confirming momentum (MACD/RSI) when price returns to your OB/FVG zones.

Cvd Divergence Signals with filter.
CVD Divergence + Candles - False Signal Filter
Hey traders,
I want to share my custom indicator with you. Through testing, I've found that CVD (Composite Volume Delta) captures divergences much more accurately than traditional tools like RSI. But this isn't just another divergence indicator - I've added strict candlestick pattern confirmation to filter out false signals. I'll keep improving this tool over time, and I welcome all your suggestions in the comments.
How it works step-by-step:
1. First, it detects CVD divergences (the delta between buy/sell volumes)
2. Then confirms each signal with reversal candlestick patterns:
- Hammer/Hanging Man
- Engulfing
- Pin Bar
- Inside Bar
Why mine beats standard CVD indicators:
• No raw divergences - only shows signals confirmed by BOTH volume AND price action
• Eliminates 80% of junk signals from basic versions
• Adaptable to any asset and timeframe
Simple usage guide:
Green arrows = Buy when:
- CVD shows bullish divergence
- AND a hammer/pin bar appears
Red arrows = Sell when:
- CVD shows bearish divergence
- Confirmed by hanging man/engulfing pattern
Pro tip:
For best results, combine with:
• Volume profile analysis
• Smart Money concepts (order blocks, FVGs )
Important notes:
This isn't a holy grail - I personally use it with support/resistance levels. Works best on 5M charts for scalping.
**PS** Got questions? Drop them in comments!

Kootch EMA MapKootch EMA overlays the 200 EMA from M1, M5, M15, M30, H1, H4, and D1 on any chart so you always see where higher and lower-timeframe trend gravity actually is. It also builds an optional Fib channel between the most extreme MTF 200 EMAs (min/max), giving you clean intrachannel targets and confluence zones.
What it does
• Plots seven 200 EMAs (M1 → D1) simultaneously via MTF pulls
• Color/weight hierarchy: thicker lines = higher timeframe (clear priority)
• Right-edge TF tags (M1, M5, … D1) so you know exactly what you’re looking at
• Optional Fib levels between min/max MTF 200 EMAs (0 → 1 band) for entries, adds, and take-profit scaling
Why traders use it
• Immediate read on trend alignment vs. chop across timeframes
• Mean-reversion & continuation cues when price stretches from/returns to key EMAs
• Level stacking: use M30/H1/H4/D1 as bias, trade entries around lower-TF reactions
Inputs
• EMA Length (default 200)
• Label offset (push tags off the last bar)
• Show Fib channel toggle + color control
How I use it
• Bias from D1/H4/H1; execution from M5/M15.
• Fade or follow at Fib 0.382 / 0.618 inside the EMA envelope; scale out near Fib 1.0 into HTF EMAs.
• Skip trades when EMAs are braided and distances are compressed.
Notes
• Works on any symbol/timeframe; all TF EMAs are requested explicitly.
• This is a map, not a crystal ball: combine with your playbook (structure breaks, FVGs, liquidity, volume).

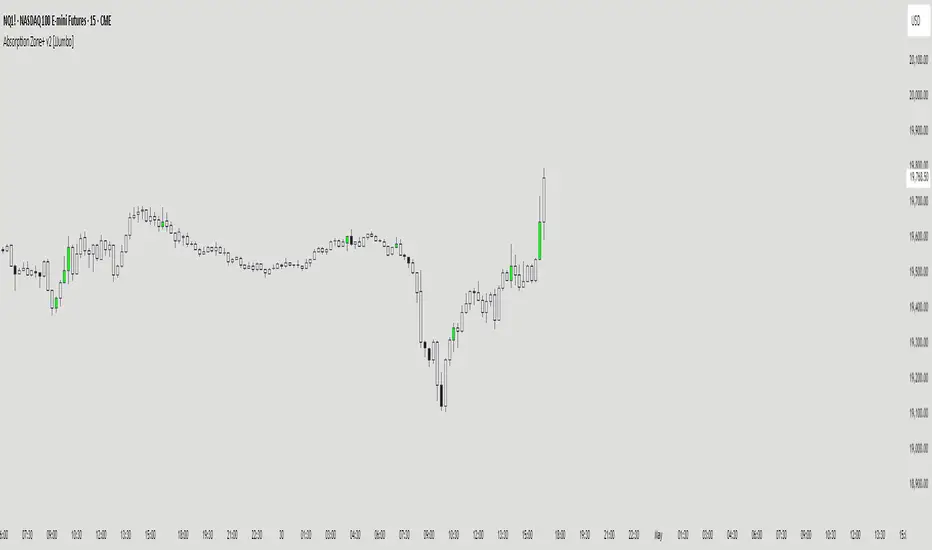
Absorption Zone+ v2 [JJumbo]Introduction
The Absorption Zone+ indicator identifies potential reversal zones by detecting high-volume absorption candles in the market where opposing orders get absorbed at key levels by the opposing party.
This script idea comes from orderflow trading, recreating what absorption would look like, it re-creates absorption based on the volumes of that specific candle or area (multiple candles), useful when trading reversals helping you identifying where influx of volume is coming in, combined with key levels it will help you understand whether a reversal is about to happen or continuation is expected during expansions.
An additional feature of Imbalances on the absorption candles is present, highlighting fair value gaps withing the absorption candles, with multi-timeframe plotting. This script is also applicable on all time frames.
This indicator is particularly valuable for traders focusing on order flow and institutional activity. Absorption candles often represent periods where smart money is actively accumulating or distributing positions while maintaining a tight price range, potentially signaling upcoming directional moves.
Key features
Bullish/Bearish candles color coding identifier:
The color coding for bullish/bearish candles help traders visualize where it is a bullish or bearish absorption identifying these zones at reversals or continuations.
Volume threshold and absorption isolation inputs:
This features let you set a threshold of the volume and percentage body to wick to set your preferred highlighting, and shading all non-absorption candles helping you identify only the absorptions present.
Absorption imbalances:
Imbalances (FVGs) bearish and bullish are shown on different time-frames, helping traders identify turnover areas or support and resistance within the absorptions, the imbalances also have a custom user defined time-frame selection to choose from and show on any time frame.
Additional inputs:
User Guidance
Custom Appearance: Adjust the style and colors of the imbalances for both bullish and bearish candles, this helps trader distinguish one from the other having a better understanding.
Custom time-frame imbalances: Choose your favorite time-frame to display its imbalances in any time-frame, helping trader visualize higher or lower time frame imbalances.
Absorption candles isolation: Isolation of the absorption candles to better identify the zones and specific candles where absorption is present.
Volume multiplier and threshold: Adjust the inputs of the absorption calculation thresholds to better taylor the volumes based on market volatility.
Conclusion
This tool is a great addition in the arsenal for the traders, whether you are a reversal trader or a continuation trader, this tool allows you to identify important areas of big amount of participants in specific candles and mixing it with fair value gap theory from The Inner Circle Trader it gives an additional factor of precision
Terms & Conditions
Our charting tools are products provided for informational and educational purposes only and do not constitute financial, investment, or trading advice. Our charting tools are not designed to predict market movements or provide specific recommendations. Users should be aware that past performance is not indicative of future results and should not be relied upon for making financial decisions. By using our charting tools, the purchaser agrees that the seller and the creator are not responsible for any decisions made based on the information provided by these charting tools. The purchaser assumes full responsibility and liability for any actions taken and the consequences thereof, including any loss of money or investments that may occur as a result of using these products. Hence, by purchasing these charting tools, the customer accepts and acknowledges that the seller and the creator are not liable nor responsible for any unwanted outcome that arises from the development, the sale, or the use of these products. We hold no reimbursement, refund, or chargeback policy. Once these Terms and Conditions are accepted by the Customer, before purchase, no reimbursements, refunds or chargebacks will be provided under any circumstances.
By continuing to use these charting tools, the user acknowledges and agrees to the Terms and Conditions outlined in this legal disclaimer.
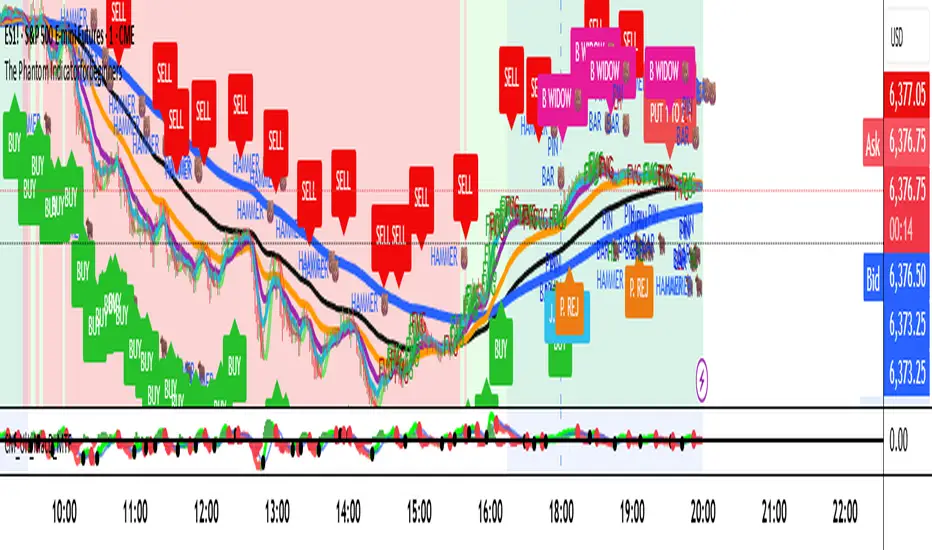
The Phantom Indicator for beginnersThe Phantom Indicator is an original software script written in Pine Script for use on the TradingView charting platform. It is designed as a real-time algorithmic trading and technical analysis toolkit that integrates multiple market signals into a unified framework. The work is a compilation of open-source trading concepts, modified and combined in a novel and proprietary manner, resulting in a unique educational tool.
Key features include:
Dynamic background shading based on price relation to the 200-period Exponential Moving Average (EMA)
Multi-timeframe Hull Moving Averages rendered as ribbons to show directional bias
A custom Fair Value Gap (FVG) detection algorithm
ATR-based trailing stop logic, inspired by UT Bot
Visual markers for candlestick rejection patterns, labeled “J. Wick” (bullish) and “Black Widow” (bearish)
Real-time structural pivot recognition, identifying Higher Highs, Lower Lows, and Break of Structure (BOS)
Interactive label alerts, trend-based visuals, and adaptive ribbon overlays
This indicator is intended to train beginner traders to:
Recognize candlestick reversal patterns
Understand trend creation and breakage
Learn to identify market direction using real-time, rule-based logic
The Phantom IndicatorThe Phantom Indicator is an original software script written in Pine Script for use on the TradingView charting platform. It is designed as a real-time algorithmic trading and technical analysis toolkit that integrates multiple market signals into a single framework. The work is a compilation of open-source trading concepts, modified and combined in a novel manner, including: dynamic background shading based on price relation to a 200-period exponential moving average (EMA); multi-timeframe Hull Moving Averages rendered as ribbons to indicate market direction; a custom Fair Value Gap (FVG) detection algorithm; ATR-based trailing stop logic (inspired by UT Bot); visual markers for bullish and bearish candle rejection patterns labeled as "J. Wick" and "Black Widow"; and real-time structural pivot pattern recognition showing Higher Highs, Lower Lows, and Break of Structure (BOS) events. All indicators are rendered in custom visual formats with interactive labels, dynamic coloring, and alert-ready logic. The work was first created on June 20, 2025, developed through iterative refinement, and completed in July 2025. It was released for personal and educational use only under a non-commercial license and includes a copyright notice identifying the author as “The Phantom LLC.” The code structure, original logic (particularly the EMA-based background engine), naming conventions, and integrated layout represent a unique creative expression not previously published in this form.

ShadowBlocks SMC indicator💼 SMC Indicator – Trade Like Smart Money
The SMC Indicator is a precision-engineered tool built around Smart Money Concepts, revealing how institutional players truly move the markets. Forget retail noise — SMC cuts through the fog to show the real structure, liquidity zones, and key manipulation points that big money uses to trap uninformed traders.
Key Features:
🔹 Market Structure Mapping: Real-time detection of Breaks of Structure (BOS) and Change of Character (CHoCH) for trend identification.
🔹 Liquidity Zones: Highlights internal and external liquidity pools where stop hunts are most likely to occur.
🔹 Order Blocks & Imbalances: Automatic marking of bullish/bearish order blocks, Fair Value Gaps (FVGs), and mitigation zones.
🔹 Premium/Discount Zones: Smart price equilibrium tracking using internal range Fibonacci logic.
🔹 Entry & Exit Clarity: Clearly defined high-probability entry zones, TP/SL levels, and confirmation-based signals.
Whether you're a price action purist or a strategic SMC trader, this indicator brings the invisible hand of institutions into full view — so you can follow smart money, not fight it.
⚠️ Disclaimer:
ShadowBlocks SMC Indicator is an educational and informational tool. It does not provide financial advice. Always do your own research and consult a licensed financial advisor before making trading decisions.

Liquidity Grab Entry Signals [Daily Enhanced]Liquidity Grab Entry Signals is a powerful tool designed to detect intraday reversal opportunities around daily high/low liquidity zones.
Core features: – Plots current daily high/low levels
– Identifies price interaction with these key zones
– Confirms rejection via strong engulfing candles
– Plots real-time long/short entry signals directly on chart
– Includes alerts for both long and short setups
This script is ideal for scalpers and intraday traders looking to exploit stop hunts, liquidity sweeps, and false breakouts.
Optimized for instruments like US30, NAS100, Gold, BTC and more.
Customize the sensitivity buffer to suit your asset and timeframe.
Use this in combination with VWAP, FVG or Smart Money concepts for enhanced confirmation.
---
Built for: 1s–15m charts
Includes: Alerts + Custom Settings
Type: Non-repainting
Trade with clarity around the most manipulated price levels of the day.

Advance FVG with 3 EMAThis is a very powerful script and is an advanced version of Fair Value Gaps with powerful EMAs.
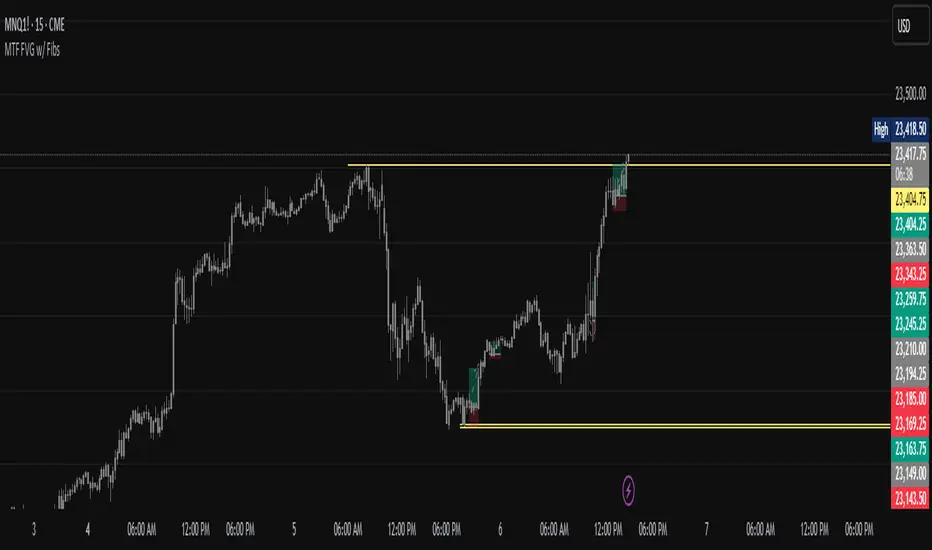
First 5-Minute Candle Wicks (17:30 UTC+4) - All Days By HaykFirst 5-Minute Candle Wicks high and low
this enables the user to see the first candle highs nd lows so it can take actions with fvg and find directions

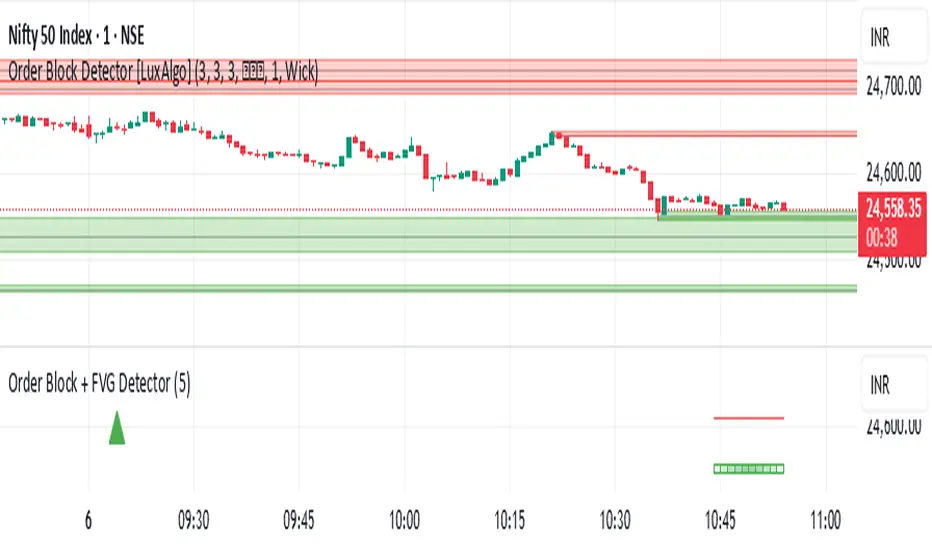
Order Block + FVG Detector- chakrashows OBs with entry and exits and volumes. It also shows the volumes in each Order block
LeBlanc Strategy 2 -Inverted Fair Value Gap with Trend & 2.5 RRRThis is for recognizing the closed Inverted Fair Value Gaps (IFVG) to know when to enter a trade.
Detects true inverted FVGs only if the gap size is 3+ ticks.
Filters trades based on EMA50 vs SMA20 trend direction.
Uses ATR-based stop loss, and sets take-profit at a 2.5 risk-to-reward ratio.
Is fully backtestable in TradingView Strategy Tester.
Plots green/red boxes for FVGs.

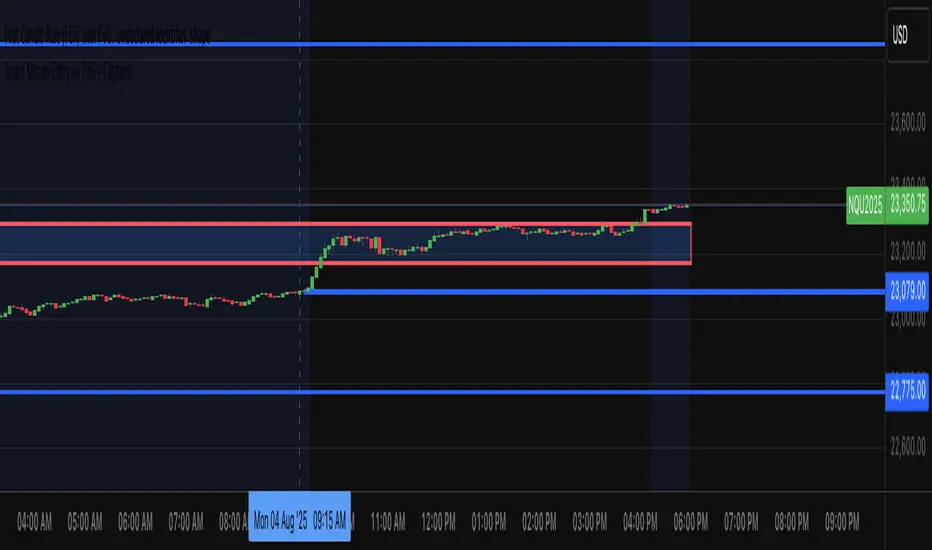
First Candle RuleThis script detects Fair Value Gaps (FVGs) on the 1-minute chart and highlights potential smart money long and short entries. It automatically calculates a risk-reward target based on a customizable ratio and displays clear caption labels showing the entry, stop, and target levels. Designed for ICT-style scalping setups.
Mayfair Reversal Change✅ Mayfair Reversal Change — By EastWave Capital
Description:
The Mayfair Reversal Change indicator is a tool designed to help traders identify potential market turning points using Stochastic Oscillator behavior and filtered price action logic. It acts as a reversal signal filter and is particularly effective when the market is overextended (overbought/oversold) and about to revert from exhaustion zones.
🔍 How It Works:
This script monitors the Stochastic %K and %D crossovers and adds a custom logic layer to filter only high-quality reversal points:
Stochastic Filter Conditions:
Uses smoothed stochastic settings:
%K smoothing = 3
%D smoothing = 3
Only shows signals after %K crosses back below 80 (for Sell) or above 20 (for Buy)
This prevents signals from appearing too early during an active overbought or oversold phase.
Directional Confirmation Logic:
Bullish signal is printed only when %K re-enters below 20 after a confirmed stochastic crossover.
Bearish signal appears only when %K re-enters above 80.
This reduces false signals that occur during continued trending moves.
Toggle Switch:
A user-toggle input is included to enable or disable the reversal filter logic.
This gives flexibility for traders who want to test signals with or without the stochastic condition.
📈 How to Use:
Timeframes: Recommended for 5M, 15M, and 30M
Markets: Compatible with any market — FX, Gold, Indices, Crypto
Entry Approach:
Wait for signal after price has reached a potential extreme area.
Confirm with chart structure, support/resistance, or SMC zone.
Enter on confirmation, placing stop loss beyond the swing high/low.
Combine with trendline breaks or price imbalances (FVG) for extra confluence.
Can be used in combination with the Mayfair FX Scalper script for dual-layer confirmation.
⚠️ Important Notes:
Signals are visual only and should be confirmed with proper strategy.
This indicator does not execute or manage trades automatically.
Designed to assist with reversal setups but should not be used in isolation.
Always manage risk, use SL/TP, and avoid over-leveraging.

Mayfair Fx Scalper✅ Mayfair FX Scalper — By EastWave Capital
The Mayfair FX Scalper is a precision-focused, closed-source indicator designed for short-term intraday trading, particularly scalping on lower timeframes such as 1-minute, 3-minute, and 5-minute charts. This tool is developed by EastWave Capital and is based on a combination of Relative Strength Index (RSI) extremes and specific candlestick structure patterns to detect potential exhaustion and reversal points in the market.
🔍 How It Works:
The algorithm operates by evaluating three core elements:
RSI Extremes:
RSI is calculated using default settings.
Buy signals are considered only when the RSI on the previous candle is below 22 (oversold), and the current candle is bullish, while the previous one was bearish.
Sell signals are considered when the RSI on the previous candle is above 78 (overbought), and the current candle is bearish, while the previous one was bullish.
Candle Confirmation Logic:
The system waits for candle confirmation (e.g., shift in bullish/bearish structure) rather than triggering signals based on RSI alone.
This avoids false triggers in strong trends and filters weak entries.
SL/TP Estimation (Visual):
While not automatically placing orders, the indicator can optionally display lines or small labels showing a Stop Loss at the previous swing high/low (±0.5) and TP levels at 1R, 2R, and 3R based on that stop.
These visual aids help traders plan risk/reward and exits manually.
📈 How to Use:
Timeframes: Best suited for 1M, 3M, and 5M charts
Markets: Works well on Gold (XAU/USD), Forex majors, Indices, and Crypto
Session: Performs best during high volatility sessions (London & NY)
Use Case:
Wait for a signal label to appear after a clear momentum move.
Confirm price action and trend context.
Use provided visual SL/TP labels or apply your manual RR planning.
Combine with structure breaks, FVG zones, or liquidity sweeps for confluence.
⚠️ Important Notes:
This indicator does not repaint.
No automatic trades are executed. Signals are visual.
Not intended for use in isolation; best when combined with proper trade management and confirmation tools.
Past performance does not guarantee future results. Always manage risk appropriately
