The Ultimate strategy by ATK**The Ultimate Strategy by ATK**
This comprehensive trading script is designed to enhance market analysis and trading strategies by integrating advanced tools for market structure, SMT (Separation and Divergence), Fair Value Gaps (FVG), and session-based insights. With customizable features, real-time alerts, and multi-timeframe functionality, this script caters to both scalpers and long-term traders seeking deeper market insights.
### 🔵 **Key Features**
**🔹 SMT (Divergence) Detection:**
- **High/Low SMT Analysis:** Compares highs and lows between a primary symbol (e.g., NQ1!) and a user-defined comparison symbol (e.g., ES1!).
- Automatically visualizes discrepancies with red (highs) and green (lows) lines.
- Supports two modes: real-time comparison and historical range checks.
- Alerts for detected SMT conditions.
- **Close Price SMT Analysis:** Compares closing prices to highlight divergences.
- Includes user-defined lookback periods and granular cycle-based SMT detection.
**🔹 PSP (Precision Swing Point):**
- Detects and highlights price divergences between symbols, such as NQ and ES, with multi-timeframe compatibility (15-minute, 1-hour, 4-hour).
- Integrated PSP table for visualizing divergences across timeframes.
- Configurable for first PSP detection only or all patterns without lower timeframe interference.
**🔹 Session Analysis with ASIA Session Insights:**
- Tracks high and low prices during the Asia session (1:00–7:00 AM Israel time).
- Draws horizontal lines marking session highs and lows.
- Alerts when prices cross session boundaries.
**🔹 FFMS (First Five-Minute Strategy):**
- Utilizes the high and low of the first five minutes of the trading day.
- Generates buy or sell signals based on retracement and breakout conditions around the previous day’s high/low.
- Real-time alerts for long and short opportunities.
**🔹 Multi-Timeframe Tables and Alerts:**
- Displays SMT and PSP conditions across multiple timeframes (1-minute, 15-minute, 1-hour, etc.).
- Alerts for SMT divergences and PSP patterns across selected time intervals.
**🔹 Visual Enhancements and Customizability:**
- Color-coded lines and labels for easy interpretation of SMT, PSP, and session levels.
- User-friendly input settings for symbol selection, session tracking, and cycle configuration.
- Flexible session range adjustments with macro and micro cycle segmentation (90-minute and 6-hour sessions).
### 🎯 **Use Cases**
- **Scalping:** Analyze short-term divergences with real-time SMT and PSP detection on lower timeframes.
- **Swing Trading:** Leverage session-based insights and SMT conditions to identify potential reversal points.
- **Multi-Symbol Analysis:** Compare key indices or assets (e.g., NQ vs. ES) for SMT-based opportunities.
This script is perfect for traders looking to combine advanced tools into a seamless, actionable trading system. Stay ahead of the markets with **The Ultimate Strategy by ATK**!
在腳本中搜尋"fvg"

ICTProTools | ICT Insight - Market Environment🚀 INTRODUCTION
The Market Environment Indicator provides traders with an essential contextual framework for analyzing price movements. Built on the principles of ICT (Inner Circle Trader) and Smart Money Concepts (SMC), this tool offers a structured view of how institutional players drive markets through liquidity manipulation and price level interactions. By defining the market environment, the indicator helps traders focus on the most relevant price zones, reducing distractions and enhancing decision-making.
At its core, the Interbank Dealing Range (IBDR) creates a clear structure of protected highs/lows and Premium/Discount zones , highlighting key areas for potential price reactions. This framework gives traders a lens to interpret market behavior and concentrate on meaningful liquidity zones and price action. The indicator helps traders navigate the market with precision, spotting significant opportunities while filtering out market noise. Indeed, the IBDR isn't always easily identifiable, and not every move will form a distinct dealing range.
This indicator goes beyond mere price levels… It reveals the larger market context in which prices evolve. By mastering this environment, traders can align their strategies with institutional logic and make well-informed decisions.
💎 FEATURES
The Interbank Dealing Range (IBDR) is a crucial concept within the ICT methodology that helps traders identify the market environment across multiple timeframes, specifically the premium and discount zones. The IBDR delineates areas where traders have the potential to buy low and sell high.
Its extremes are defined by the sweep of both buy-side and sell-side liquidity . These levels indicate the boundaries within which price is expected to evolve . Understanding these boundaries allows traders to determine where it is appropriate to enter or exit trades.
The primary goal of utilizing the IBDR is to capitalize on price movements by buying at discounted levels and selling at premium levels. This strategy aligns with the fundamental principle of trading: to buy at lower prices and sell at higher prices, maximizing profit potential.
By visualizing the IBDR on your charts, you can gain valuable insights into the prevailing market conditions and make informed trading decisions that align with the institutional approach to buying and selling.
This chart illustrates the Interbank Dealing Range (IBDR) applied to the US100 index, displaying two from different timeframes: a 1-hour (1h) IBDR on the left and a 30-minute (30m) IBDR on the right. This multi-timeframe view provides essential context for price action analysis.
The 1h IBDR could here function as the primary reference range, establishing key boundaries (High and Low) for price movement. Within this range, the Equilibrium (midpoint) separates the Premium zone (above) from the Discount zone (below). The 0.25 and 0.75 levels add further precision by subdividing these zones.
Price action then flows between these zones, creating and targeting liquidity at higher and lower levels through Relative Equal Highs and Lows. A strong upward movement into the deeper level of the Premium Zone captures high-side liquidity (with a notable reaction at the FVG on the left), forming a secondary 30m IBDR. After this liquidity sweep, the remaining liquidity is on the low side. Price then reverses downward toward it. Here, the 30m IBDR would suggest a confirmation for a potential sell entry by targeting the IBDR lows.
The relationship between the broader 1h IBDR, the more detailed 30m IBDR, and all related levels creates a powerful analytical framework. The larger timeframe provides context, while the smaller one reveals specific trading opportunities by providing entry confirmations.
✨ SETTINGS
IBDR Metrics: Adjust the timeframe and sensitivity for calculating the IBDR so traders can adapt the indicator to both short-term intraday movements and longer-term trends.
Premium/Discount Zones: Customize the levels such as 0, 0.5, 1, and other levels like 0.25 and 0.75 by default and their displayed colors and associated labels.
Alerts: Configure the alerts for Premium/Discount zones, High/Low breaks, and new IBDR, ensuring traders are kept up to date on key market events.
🎯 CONCLUSION
The Market Environment indicator serves as a powerful tool for analyzing and navigating market structure through liquidity zones. It helps identify optimal buy and sell areas while aligning with the institutional logic of major market players. While its features provide a valuable edge, it’s essential to remember that none should be used on its own, and many more factors go into being a profitable trader.

TheHorsyAlgoPROThe Horsy algo is an automated strategy that uses any minute Higher timeframe range as reference and search for a purge of liquidity on the HTF high or low where buyside or sell side liquidity is, the algo only search this at specific desired times that can be configured according to the time you usually trade, the strategy is known as Turtle soup purge and reverse or lately as CRT.
Why is useful?
The purpose of this Algorithm is to help turtle soup traders to quickly identify when the market is likely to reverse the algo evaluates if the opportunity is worth it, base on risk reward and other desired filters. Also this strategy can help to quickly backtest the trader strategy it can be configured in different timeframes and adapt to the trader personality, they can easily see the results and statistics and notice if its profitable or not.
This algo is useful for intraday traders looking for a purge and reverse at a key times and at key HTF price levels this only looks the previous HTF highs and lows but is important to also monitor Order blocks, FVGs, gaps, or wicks to have the best results.
How it works and how it does it?
The Horsy algo simply Jumps from one type of liquidity to another one buyside to sell side or vice versa. In order for the algo to trigger an entry it has to meet these conditions
1. Take HTF liquidity, trade above a HTF high or below a HTF low in the selected time window
2. Make a change in the state of delivery with a close below the previous candle low for shorts and close above previous candle high for longs.
3. Allow for a reasonable risk reward, it will use the highest high for shorts and the lowest low for longs. The default take profit is the opposite side of the range.
4. Validate others user filters this include enter only trades aligned with the HTF bias, or trades aligned with the LTF bias or booth. The algo have the option to enter only premium and discount entries. And finally, an option to allow for different contract sizes depending of the maximum percent of the account we want to risk default is 1%. For this last option is important to check the initial balance and leverage are configured correctly, is disable by default because it requires more capital to perform well.
We can see the algo performing in the picture below with a short trade, notice there are some white lines, they are the high or the low of HTF candle that start generating inside candles in the HTF meaning a possible consolidation. The algo plots the HTF ranges in a shaded boxes as you can see below
The HTF bias as you can see in the picture is calculated based on the last close of the HTF meaning close above previous HTF high is bullish close below previous HTF low is bearish. This HTF bias level is also the last HTF mid-price or 50%. By default, this line is enabled.
The LTF bias is calculated based on the range created from the expansion outside the previous HTF range is also the mid-price. If the LTF close above previous HTF high is bullish and if the LTF close below previous HTF low is bearish. By default this LTF bias line is disable.
This strategy includes an original and personal developed code that uses dealing ranges to recognize if the market is expanding, retracing, reversing or consolidating. This allow the algo to exit the position when it detects a retracement or at the end of the expansion. This is the default exit type.
You can monitor the previous dealing ranges created in history with an option than can be enable, by default is disable, this ranges are created after price takes buyside and then sell side or vice versa. So this dealing ranges can be useful also to identify minor pools of liquidity and premium and discount in the lower timeframe.
The picture below is a long example, the exit in this case is just at the high of the range. The normal take profit is in a blue line for longs.
How to use it?
First select the desired HTF timeframe recommended is from 30min to 240min then you setup the chart on the lower timeframe you want to trade recommended is from 1min to 15min to enter. By default This strategy is designed to work for intraday during key times when price take stops and then moves quickly away from them. You can select as much as 6 different times or just one. After you select the desired time window where the algo will look for the purge and reverse, They are highlighted in the candles that change colors excluding the gray ones that indicates consolidation.
Then the Algo allow to performs several additional filters in the entries you can select if you want to trade only longs or shorts trades, you can select when to move the stop loss to Break even. In deviations of the risk or you can just select to remove risk when price hits the 50% of previous HTF range.
You can select the minimum desired risk reward of the trade before is allow to be taken. Once is configured correctly the algo should trigger signals with a triangle up or down plus the strategy entry.
At the beginning of the picture there are some blue lines in the HTF high low and close, this is to easily identify that the market is in the Asia session, the time can be configured by the user, these lines are normally gray.
On the right top of the screen you can see some statistics about the strategy how many trades it took, ARR is an approximated value of the accumulated total risk reward of all the trades when they get closed in the simulation.
Profit factor and percent profitable are also shown should be green it means that the strategy makes money over time. But apart from that is important to notice how it makes money it is stable over time? it is a roller coaster? that why I Include this other measurements MxcsTps is the maximum consecutives take profits and Mxcsls is the maximum consecutive stop losses it takes, the slash number after it is the consecutive Break evens. So this way you know what to expect and what is normal in the strategy.
The algo shows all the times the stop loss, take profit and break even level if enable in the colored red lines for short and blue lines for longs. You can also select how price will manage the profit or stoploss point meaning that you can choose to wait for the candle to close to invalidate your idea or to take profit. This is good to avoid liquidity sweeps but can also lead to mayor loses if the idea is wrong. The default setting is to close the trade when price takes the high or low where the stoploss is, the take profit is taken after a retracement to allow to profit on expansions. You can select also to exit on a reversal if you want to ride all the move. This last option has to be used with caution because sometimes price just retrace or reverse very fast decreasing the trade profit and overall strategy performance.
The algo have the option to use standard deviation from the normal risk if you prefer to prevent liquidity sweeps near the stop level this make wider stops but can lead to increased loses so it has to be used carefully.
Below is a picture that show the entry stop and take profit levels with an exit on a retracement activated.
Strategy Results
The backtesting results are obtained simulating a 2000usd account in the Micro Nasdaq using 1 contract per trade. Commission are set to 2usd per contract, slippage to 1tick. You can see in list of trades we are not risking more than 1 % percent of the account. The backtested range is from august to November 2024. This strategy doesn’t generate too much trades because of the time filters and conditions that has to be meet to take an entry but you can see the results of the last 4months with the available data that are around 32 trades.
The default settings for this strategy is HTF as 240min designed to work on a LTF 5min chart, the default purge times are 245-300, 745-800, 845-900, 1045-1100 and 1245-1300 UTC-4, the algo will look for shorts or longs, with a minimum risk reward of 2.0. With an additional filter of the HTFBias. The take profit is by default taken on the first retracement after hitting the target. The default settings are optimized to work on the Nasdaq or Spy, but can also perform well in other assets with the correct adjustments.
Remember entries constitute only a small component of a complete winning strategy. Other factors like risk management, position-sizing, trading frequency, trading fees, and many others must also be properly managed to achieve profitability. Past performance doesn’t guarantee future results. To really take advantage of this strategy you have to study turtle soup and the HTF key levels use this only as a confirmation that your overall idea will play out and use it to backtest your model.
Summary of features
·Adaptable strategy to different HTF timeframes from 1-1440min
· Select up to 6 different purge time windows UTC-4, UTC-5
· Choose desired Risk Reward per trade
· Easily see the HTF high low close and 50% key levels in the LTF
· Identify HTF consolidations that generate key major liquidity pools
· HTF/LTF bias filters to trade in favor of the big trend or in sync
· Shaded boxes that indicate if the market is bullish, bearish or consolidating
· See the current midpoint of the last expansion move
· Optimal trade entry filter to trade only in a discount or premium
· Customizable trade management take profit, stop, breakeven level
· Option to exit on a close, retracement or reversal after hitting the take profit level
· Option to exit on a close or reversal after hitting stop loss
· Configurable breakeven point with standard deviations or at 50% of the HTF
· Calculate different contract sizes depending of a percentage of the initial balance
· Standard deviations from normal risk can be used to prevent liquidity sweeps
· See dealing ranges history to check minor pools of liquidity and premium or discount
· Dashboard with instant statistics about the strategy current settings

Ultra Market StructureThe Ultra Market Structure indicator detects key market structure breaks, such as Break of Structure (BoS) and Change of Character (CHoCH), to help identify trend reversals. It plots lines and labels on the chart to visualize these breakpoints with alerts for important signals.
Introduction
This script is designed to help traders visualize important market structure events, such as trend breaks and reversals, using concepts like Break of Structure (BoS) and Change of Character (CHoCH). The indicator highlights internal and external price levels where the market shifts direction. It offers clear visual signals and alerts to keep traders informed of potential changes in the market trend.
Detailed Description
The indicator focuses on detecting "market structure breaks," which occur when the price moves past significant support or resistance levels, suggesting a potential reversal or continuation of the trend.
.........
Type of structure
Internal Structure: Focuses on smaller, shorter-term price levels within the current market trend.
External Structure: Focuses on larger, longer-term price levels that may indicate more significant shifts in the market.
.....
Key events
Break of Structure (BoS): A market structure break where the price surpasses a previous high (bullish BoS) or low (bearish BoS).
Change of Character (CHoCH): A shift in market behavior when the price fails to continue in the same direction, indicating a possible trend reversal.
Once a break or shift is detected, the script plots lines and labels on the chart to visually mark the breakpoints.
It also provides alerts when a BoS or CHoCH occurs, keeping traders informed in real-time.
The indicator can color the background and candles based on the market structure, making it easy to identify the current trend.
.....
Special feature
At news events or other momentum pushes most structure indicators will go into "sleep mode" because of too far away structure highs/lows. This indicator has a structure reset feature to solve this issue.
.........
Detects Break of Structure (BoS) and Change of Character (CHoCH) signals.
Marks internal and external support/resistance levels where market trends change.
Provides visual cues (lines, labels) and real-time alerts for structure breaks.
Offers background and candle color customization to highlight market direction.

Noise Footprint ImbalanceNoise Footprint Imbalance Indicator
The Noise Footprint Imbalance Indicator highlights areas of imbalance in price action, marking potential zones of support and resistance. This indicator helps traders visualize "footprints" of imbalance on the chart, allowing for better identification of areas where price moves significantly away from equilibrium. This can help traders pinpoint potential reversal points or zones where buyers or sellers may step in.
Features
Customizable Box Count: Choose the maximum number of imbalance zones displayed on the chart, keeping your workspace clear and focused.
Imbalance Detection: Highlights both top and bottom imbalances, identifying them based on price discrepancies between open/close and high/low levels.
Dynamic Zone Boxes: Draws boxes around imbalance zones with customizable colors and transparency, providing visual clarity without overwhelming the chart.
Usage
This indicator is beneficial for traders who:
Use imbalance zones as potential areas of interest for entries or exits.
Want to combine it with other indicators or price action analysis to improve trade setups.
Customization Options
Maximum Imbalance Zones: Adjusts the maximum number of imbalance boxes shown.
Imbalance Box Color: Customize the color and transparency of the imbalance zones to suit your chart's theme.
Add this script to your chart to enhance your technical analysis and bring more structure to your trading approach with the Noise Footprint Imbalance Indicator.

Fair Value Gaps Advanced [smart-money-indicators]This indicator is a tool to support the "SMC" strategy.
This indicator does not provide entry or exit signals.
This indicator is a tool to mark key price areas.
This indicator is a tool to mark key time areas.
This indicator is particularly distinguished by its high customizability of tools,
setting it apart from the indicators currently available on the TradingView platform.
This Fair Value Gaps or Imbalance Indicator marks liquidity areas using boxes.
Fair Value Gaps are created in high-momentum conditions, leaving an area that, in theory and as supported by backtesting, tends to be revisited.
The following settings can be configured:
Show only one-sided Gaps
- Only Fair Value Gaps formed by three consecutive bullish or bearish candles are displayed.
Extend Fair Value Gap
-The box is extended to the current candle.
Draw Mid Line
- A 50% line of the Fair Value Gap is drawn.
Extend Mid Line
-The midline is extended to the current candle.
Remove filled Fair Value Gap
-Filled Fair Value Gaps are removed.
Enable inverse Fair Value Gap
- When a bullish Fair Value Gap is broken, it creates a bearish resistance area.
- When a bearish Fair Value Gap is broken, it creates a bullish support area.
-Display Last X active Buyside Fair Value Gaps
-Display Last X active Sellside Fair Value Gaps
-Display Last X active Buyside Inverse Fair Value Gaps
-Display Last X active Sellside Inverse Fair Value Gaps

ShuffleOverview
This TV script is designed to assist traders by visually marking key price levels and identifying potential trading opportunities on their charts. The script highlights the previous day's, week's, and month's highs and lows, as well as hourly fair value gaps. By providing clear visual indicators, traders can make more informed decisions based on significant price movements and gaps in the market.
Features
1. Previous Day Highs and Lows
Highs and Lows: Automatically plots the highest and lowest price points from the previous trading day.
Visual Indicators: Uses distinct colors and lines to differentiate between highs and lows for easy identification.
Alerts: Optional alerts when current price approaches these levels.
2. Weekly Highs and Lows
Weekly Range: Marks the highest and lowest prices of the current week.
Trend Analysis: Helps in identifying the overall trend direction based on weekly extremes.
Support and Resistance: Acts as dynamic support and resistance levels for potential trade setups.
3. Monthly Highs and Lows
Monthly Extremes: Highlights the highest and lowest prices recorded in the current month.
Long-Term Perspective: Provides insights into long-term market sentiment and potential major support/resistance zones.
Investment Decisions: Aids in making strategic investment decisions based on significant monthly price movements.
4. Hourly Fair Value Gaps
Fair Value Gaps (FVG): Identifies gaps between the high of one hour and the low of the next hour where no trading has occurred.
Price Retracement: Marks areas where price is likely to retrace to fill these gaps, offering potential entry points.
Gap Analysis: Assists in understanding market inefficiencies and potential price corrections.

Quarterly Theory True Day Openings inspired by Daye
The point of this indicator is to catch the big moves that happen in the market.
This is based on Daye Quarterly theory. When applied to the chart you will see different color lines that represent different quarters in the Quarterly theory.
Red line will represent quarter 1 this quarter will be either a accumulation or a continuation from the previous quarter.
Green line will represent quarter 2 this is where the big moves in the market tend to happen. it will start printing the line on the chart where the user will have time to look for entry models to get in a trade. Q2 and Q3 are important levels that are near forms of liquidity such as fair value gaps and old highs and lows.
This app will draw the lines that represent the quarter which will give a visual que to the user of the app to look for fvgs ,old highs and lows. once found they will be able to use an entry model to enter a trade.
entry models could be liquidity sweep . wait for buy/side stops to be taken and enter on fair value gap.
wait for ifvg next to quarter level to be tested and entered.
App Usage:
Max Time Frame is 1 hour and can go down to the min chart
Previous quarters will be left on the chart as they tend to be revisited by price at a later date.
Year > Green line: Year True open
Month > Yellow line: Month true open
Weekly > True open
Q1 == Red line "consolidation/manipulation"
Q2 == Green line "Trade this" >
Q3 == blue Line "Trade this"
Q4 == grey or blue
`TRUE OPEN` = beggining of Q2.
Bullish - buy below `TRUE OPEN`.
Bearish - sell above `TRUE OPEN`.
True Year Open = first Monday of April.
True Month Open = second Monday of the Month.
True Week Open = every Monday at 6:00PM.
True Day Open = 12:00 Midnight.
True New York Session Open = 7:30.

Change in State of Delivery (CISD) [LuxAlgo]The Change In State Of Delivery (CISD) indicator detects and displays Change in State Of Delivery, a concept related to market structures.
Users can choose between two different CISD detection methods. Various filtering options are also included to filter out less significant CISDs.
🔶 USAGE
A Change in State of Delivery (CISD) is a concept closely related to market structures, where price breaks a level of interest, confirming trends and their continuations from the resulting breakouts.
Unlike more traditional market structures which rely on swing points, CISDs rely on a persistent sequence of candles, using the sequence extremes as breakout levels.
CISDs are detected as follows:
Bullish: The price closes above the opening price of the first candle in a sequence of bearish candles (or its own opening price if it's the only candle).
Bearish: The price closes below the opening price of the first candle in a sequence of bullish candles (or its own opening price if it's the only candle).
If a newly detected CISD aligns with the indicator's current established trend, this confirms a trend continuation (represented with a dashed line).
On the other hand, if a newly detected CISD is in the opposite direction to the detected trend it can confirm a trend reversal (represented with a solid line).
🔹 Liquidity Sweep Detection Method
Using Liquidity Sweeps to update CISD breakout levels allows us to obtain less frequent and more relevant levels that are less sensitive to noisy price variations.
Sweeps are obtained from detected Swing Points , with a higher Swing Length allowing us to obtain longer-term swing levels and potentially more detected sweeps from a specific level over time.
Note: The 'Swing Length' setting is only applicable on the Liquidity Sweep Detection Method and will only change the Liquidity levels.
A Liquidity Sweep is valid when the price reaches an important liquidity level , after which the price closes below/above this level.
Bullish scenario: The price goes below a previous unbroken Swing Low but closes above.
Bearish scenario: The price goes above a previous unbroken Swing High but closes below.
After a Liquidity Sweep has been detected, the last level of importance acts as support/resistance . Breaking this level in the other direction changes the state of delivery .
Users must keep observing the price and significant levels, as highlighted by the white rectangle in the above example.
🔹 CISD Filtering
Users can adjust the following two settings:
Minimum CISD Duration: The minimum length of the 'CISD' line
Maximum Swing Validity: The maximum length of the 'CISD' line; potential CISD lines that aren't broken are deleted when exceeding the limit.
The chart can get cluttered when the Minimum CISD Duration is low. Users could focus on a switch in trend (first solid line CISD ), where the following dashed CISD lines can be seen as extra opportunities/confirmations.
🔶 DETAIL
🔹 Using Different Timeframes
When an important liquidity level (Previous Swing high/low, FVG, etc.) is reached on the higher timeframe, the user can move to a lower timeframe to check whether there is a CISD .
Above example:
The high of the last candle breaches a liquidity level (previous Swing High). The opening price of the last candle acts as a trigger/confirmation level.
A confirmed CISD is seen in a lower timeframe, just after this Liquidity Sweep. This could be an early opportunity.
Later, a confirmed CISD on the higher timeframe is established.
🔶 SETTINGS
Detection Method: Classic or Liquidity Sweep
Swing Length: Period used for the swing detection, with higher values returning longer-term Swing Levels.
Minimum CISD Duration: The minimum length of the CISD line
Maximum Swing Validity: The maximum length of the CISD line; potential CISD lines that aren't broken are deleted when exceeding the limit.

ICT Immediate Rebalance Toolkit [LuxAlgo]The ICT Immediate Rebalance Toolkit is a comprehensive suite of tools crafted to aid traders in pinpointing crucial trading zones and patterns within the market.
The ICT Immediate Rebalance, although frequently overlooked, emerges as one of ICT's most influential concepts, particularly when considered within a specific context. The toolkit integrates commonly used price action tools to be utilized in conjunction with the Immediate Rebalance patterns, enriching the capacity to discern context for improved trading decisions.
The ICT Immediate Rebalance Toolkit encompasses the following Price Action components:
ICT Immediate Rebalance
Buyside/Sellside Liquidity
Order Blocks & Breaker Blocks
Liquidity Voids
ICT Macros
🔶 USAGE
🔹 ICT Immediate Rebalance
What is an Immediate Rebalance?
Immediate rebalances, a concept taught by ICT, hold significant importance in decision-making. To comprehend the concept of immediate rebalance, it's essential to grasp the notion of the fair value gap. A fair value gap arises from market inefficiencies or imbalances, whereas an immediate rebalance leaves no gap, no inefficiencies, or no imbalances that the price would need to return to.
Rule of Thumb
After an immediate rebalance, the expectation is for two extension candles to follow; otherwise, the immediate rebalance is considered failed. It's important to highlight that both failed and successful immediate rebalances, when considered within a context, are significant signatures in trading.
Immediate rebalances can occur anywhere and in any timeframe.
🔹 Buyside/Sellside Liquidity
In the context of Inner Circle Trader's teachings, liquidity primarily refers to the presence of stop losses or pending orders, that indicate concentrations of buy or sell orders at specific price levels. Institutional traders, like banks and large financial entities, frequently aim for these liquidity levels or pools to accumulate or distribute their positions.
Buyside liquidity denotes a chart level where short sellers typically position their stops, while Sellside liquidity indicates a level where long-biased traders usually place their stops. These zones often serve as support or resistance levels, presenting potential trading opportunities.
The presentation applied here is the multi-timeframe version of our previously published Buyside-Sellside-Liquidity script.
🔹 Order Blocks & Breaker Blocks
Order Blocks and Breaker Blocks hold significant importance in technical analysis and play a crucial role in shaping market behavior.
Order blocks are fundamental elements of price action analysis used by traders to identify key levels in the market where significant buying or selling activity has occurred. These blocks represent areas on a price chart where institutional traders, banks, or large market participants have placed substantial buy or sell orders, leading to a temporary imbalance in supply and demand.
Breaker blocks, also known as liquidity clusters or pools, complement order blocks by identifying zones where liquidity is concentrated on the price chart. These areas, formed from mitigated order blocks, often act as significant barriers to price movement, potentially leading to price stalls or reversals in the future.
🔹 Liquidity Voids
Liquidity voids are sudden price changes when the price jumps from one level to another. Liquidity voids will appear as a single or a group of candles that are all positioned in the same direction. These candles typically have large real bodies and very short wicks, suggesting very little disagreement between buyers and sellers.
Here is our previously released Liquidity-Voids script.
🔹 ICT Macros
In the context of ICT's teachings, a macro is a small program or set of instructions that unfolds within an algorithm, which influences price movements in the market. These macros operate at specific times and can be related to price runs from one level to another or certain market behaviors during specific time intervals. They help traders anticipate market movements and potential setups during specific time intervals.
Here is our previously released ICT-Macros script.
🔶 SETTINGS
🔹 Immediate Rebalances
Immediate Rebalances: toggles the visibility of the detected immediate rebalance patterns.
Bullish, and Bearish Immediate Rebalances: color customization options.
Wicks 75%, %50, and %25: color customization options of the wick price levels for the detected immediate rebalance.
Ignore Price Gaps: ignores price gaps during calculation.
Confirmation (Bars): specifies the number of bars required to confirm the validation of the detected immediate rebalance.
Immediate Rebalance Icon: allows customization of the size of the icon used to represent the immediate rebalance.
🔹 Buyside/Sellside Liquidity
Buyside/Sellside Liquidity: toggles the visibility of the buy-side/sell-side liquidity levels.
Timeframe: this option is to identify liquidity levels from higher timeframes. If a timeframe lower than the chart's timeframe is selected, calculations will be based on the chart's timeframe.
Detection Length: lookback period used for the detection.
Margin: sets margin/sensitivity for the liquidity levels.
Buyside/Sellside Liquidity Color: color customization option for buy-side/sell-side liquidity levels.
Visible Liquidity Levels: allows customization of the visible buy-side/sell-side liquidity levels.
🔹 Order Blocks & Breaker Blocks
Order Blocks: toggles the visibility of the order blocks.
Breaker Blocks: toggles the visibility of the breaker blocks.
Swing Detection Length: lookback period used for the detection of the swing points used to create order blocks & breaker blocks.
Mitigation Price: allows users to select between the closing price or the wick of the candle.
Use Candle Body in Detection: allows users to use candle bodies as order block areas instead of the full candle range.
Remove Mitigated Order Blocks & Breaker Blocks: toggles the visibility of the mitigated order blocks & breaker blocks.
Order Blocks: Bullish, Bearish Color: color customization option for order blocks.
Breaker Blocks: Bullish, Bearish Color: color customization option for breaker blocks.
Visible Order & Breaker Blocks: allows customization of the visible order & breaker blocks.
Show Order Blocks & Breaker Blocks Labels: toggles the visibility of the order blocks & breaker blocks labels.
🔹 Liquidity Voids
Liquidity Voids: toggles the visibility of the liquidity voids.
Liquidity Voids Width Filter: filtering threshold while detecting liquidity voids.
Ignore Price Gaps: ignores price gaps during calculation.
Remove Mitigated Liquidity Voids: remove mitigated liquidity voids.
Bullish, Bearish, and Mitigated Liquidity Voids: color customization option..
Liquidity Void Labels: toggles the visibility of the liquidity voids labels.
🔹 ICT Macros
London and New York (AM, Launch, and PM): toggles the visibility of specific macros, allowing users to customize macro colors.
Macro Top/Bottom Lines, Extend: toggles the visibility of the macro's pivot high/low lines and allows users to extend the pivot lines.
Macro Mean Line: toggles the visibility of the macro's mean (average) line.
Macro Labels: toggles the visibility of the macro labels, allowing customization of the label size.
🔶 RELATED SCRIPTS
ICT-Killzones-Toolkit
Smart-Money-Concepts
Thanks to our community for recommending this script. For more conceptual scripts and related content, we welcome you to explore by visiting >>> LuxAlgo-Scripts .

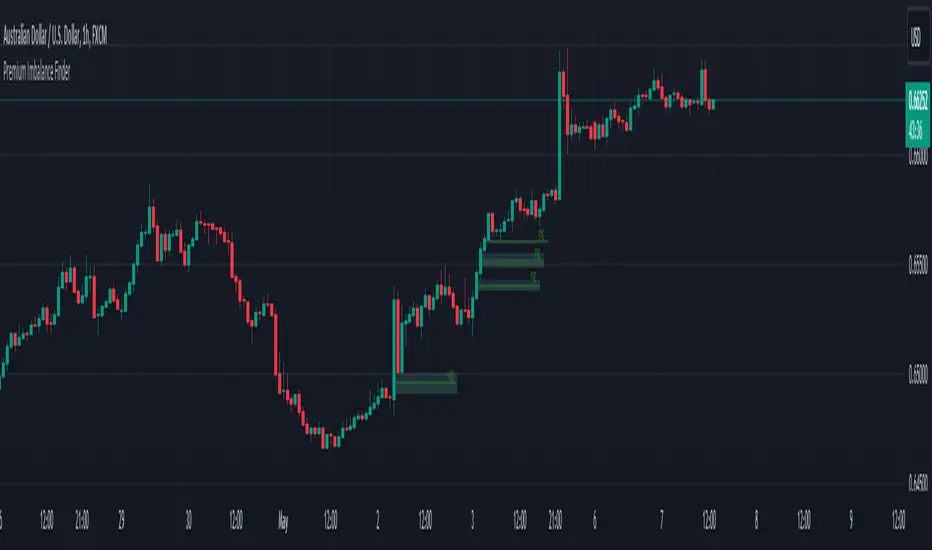
Premium Imbalance FinderIntroducing the Premium Imbalances Indicator, a powerful tool designed help traders identify and analyze market imbalances. This advanced indicator offers a comprehensive suite of features to enhance your trading experience and provide valuable insights into market dynamics.
Key Features:
Fair Value Gap (FVG): Identify price ranges where the market has not achieved fair value, indicating potential imbalances and trading opportunities.
Balanced Price Range (BPR): Visualize price ranges where the market has found a balance between supply and demand.
Volume Imbalance: Detect areas of significant volume imbalance, highlighting the absence of body volume and potential market inefficiencies.
Opening Gap: Identify un-offered price ranges at the opening of a trading session, providing insights into potential market direction.
Customizable Display: Adjust the display limit to control the number of imbalance boxes visible on the chart, ensuring a clutter-free and focused view.
Mitigation Analysis: Set a mitigation level to determine when an imbalance has been mitigated and track the percentage of mitigation for each imbalance.
Higher Timeframe Analysis: Enable the HTF Imbalance feature to analyze imbalances on higher timeframes, providing a broader perspective on market structure.
Customizable Appearance: Personalize the colors of imbalance boxes, premium zones, and mid-lines to suit your visual preferences and easily distinguish between bullish and bearish imbalances.
Flexible Imbalance Extension: Choose between custom, current, or extended imbalance box display to adapt to your trading style and analysis requirements.
Detailed Tooltips: Hover over imbalance labels to view the percentage of mitigation for each imbalance, providing quick and easy access to crucial information.
The Premium Imbalances Indicator is suitable for traders of all levels, from beginners to experienced professionals, and can be used across various markets and timeframes.
By utilizing this powerful tool, traders can gain a deeper understanding of market dynamics, identify potential trading opportunities, and make more informed decisions based on the analysis of imbalances. The indicator's customizable features and detailed insights make it an essential addition to any trader's toolkit.
Market Structure (Range) & Internal Liquidity
This indicator will simplify the price-action reading of any trader/investor by decluttering his/her charts from un-important & confusing candles to highlight the true momentum candles which are usually formed by institutional buying/selling .
The indicator will be a good tool in the arsenal of the following styles of Trading/Investing
Smart Money / Liquidity Concepts
Price Action Concepts
Demand & Supply Concepts
Support & Resistance Concepts
UNIQUE FEATURES:
1. Market Structure - Range & Internal Liquidity:
Unlike other liquidity indicators, this indicator only highlights liquidity levels of significant importance. Not every intermediate high & low in a chart are worthy of noticing, hence by enabling the 'Swings' & 'Range (BoS)' feature in the indicator settings, the structure highs and lows (external liquidity) in a chart can be identified.
Any other liquidity levels within a market range (Range between structural High & Low) is known as internal liquidity which price targets to collect enough orders before heading towards the external liquidity levels.
2. Gaps (Fair Value Gaps / Imbalance):
Not every imbalance / gap between candles are important & trade-worthy. This feature of the indicator is different from the other widely available imbalance indicators & only highlights gaps formed by true momentum candles. Gaps between unimportant inside bars are not highlighted, as these bars occur in the absence of momentum.
3. True Price Action:
Looking at the two charts below, we can clearly observe the difference between price action of a confusing normal chart & the simplified price action highlighted by the indicator. This feature declutters the charts by only highlighting the candles a trader / investor should notice in a chart.
This feature when used in confluence with the liquidity levels feature & gap feature of the indicator, helps identify the true demand & supply zones (order blocks) in a chart.
Before
After
4. Zig Zag Lines:
This unique feature which is useful to Identify & Backtest different entry types taught by Smart Money Traders . This feature helps the trader understand the True Fractal Nature of price. This can also be seen as an alternate to the default line chart feature.
Examples of Entry Types taken by Smart Money Traders
ADDITIONAL FEATURES:
(These features are essential addons to trade liquidity. However, these are derived from publicly available indicators from the Tradingview library, but with a different interpretation for a better visualization of charts & or to time better trade entries without cluttering the charts)
a. Inside Bar & Outside Bars:
Identify not just a single Inside Bar as highlighted by other indicators, but to highlight a series of candles which are within a master candle range and are exhibiting unimportant sideways price action.
Outside Bars only relevant to momentum candles are highlighted, ignoring candles that occur within a master candle range. Highs & Lows of such Outside Bars are used by aggressive traders to identify liquidity levels in the charts.
b. Highs & Lows of previous Monthly / Weekly / Daily & Hourly Candles:
This feature draws Highs & Lows of previous Monthly / Weekly / Daily & Hourly Candles on the extreme right hand side of the chart to keep the charts clean.
Additionally for Hourly time frame, the indicator includes a setting to select the hourly candle time frame (60 min / 75 min / 240 min), which are personal and different for each trader.
UNDERLYING CONCEPT:
In the image below we see how a large majority of Traders / Investors incorrectly mark Structure markings, mistaking a raid of internal liquidity as a Break of Structure, thereby taking trades opposite to the broader trend of the markets
However, this indicator has a higher accuracy of identifying the correct price structure by only marking a structure high or low, when a subsequently opposite side liquidity is taken/raided. Further the broader trend of the markets can be easily identified by looking as to which side the Break of Structure has happened. (This is visible in the indicator in the form of 'Range' feature, so if a Range High is broken then it is understood to be in an uptrend & vice versa)
The underlying core functionality of the indicator is best displayed by the image below
USECASE OF THE INDICATOR:
Before taking any Buying/Selling position in the markets, a Trader / Investor must analyze the price action on the following parameters
HTF & LTF Trend Identification (To judge if trade is Pro-Trend or Counter-Trend)
Is Price at a High Probability Area of Interest?
Is Price satisfying the trade entry conditions?
Let us see how this indicator can be used as a complete trading system in itself and addresses each of the above parameters
Disclaimer: Illustrations shown below are just for understanding the features of the indicator & does not guarantee profitability. Every trader must back test their setups to arrive at a setup with an edge (positive expectancy) before they start actively trading the setup.
1. HTF & LTF Trend Identification (Pro-Trend / Counter-Trend) using 'Range (BoS)' feature of the indicator
Let's assume a Day Trader, uses hourly chart (75 min) to frame his Higher Time Frame (HTF) ideas & 15min charts (LTF) for trade entries
Looking at the chart below the Trader concludes that the HTF has most recently broken the structure to the downside and is considered Bearish till price action is below the range high of 48600 levels. It can also be concluded that the price is currently in a Bullish retracement.
The Trader can choose to take both Pro-Trend or Counter-Trend Trades, timing the trade entries using the LTF charts.
Looking at the LTF chart below, it is evident that price on LTF has also broken structure to the downside and is now aligned with the HTF Bearish Trend. The Trader will now look to get into short trades, to take trades both in line with HTF & LTF trend.
2. Let's identify if Price is at a High Probability Area of Interest, using either single or combination of the 'Swings' / 'Gaps' / 'Outside Bars' / 'HL of previous M,W,D, H candles' features of the indicator
Definition of High Probability Level / Area differs from each Traders perspective depending upon which of the Trading Styles (mentioned in the beginning) does one use.
Smart Money Traders
SMC Traders are known to get into trades early and their high R:R trades are taken mostly at a High Probability Area of Interest which are identified by them on HTF, by looking for candles with imbalance (gaps) & or candles which have taken out a previous liquidity and then having creating imbalance (gaps).
Also Turtle Soups is one of the favorite setups for SMC traders, where a trader enters a trade on LTF (typically 1 min/3min & 5min) after grabbing HTF liquidity lying at H/L of outside bar / previous monthly, weekly, daily or hourly candles.
Demand & Supply Traders
Some of the Best Demand & Supply Traders have the patience to wait for trades and take trades at the extreme Demand & Supply Zones within a market Range.
As illustrated below, the extreme hourly supply zone just below the structure high, which has the confluence of imbalance and Bearish HTF confirmation resulted in a good R:R trade.
Price Action Traders & Support & Resistance Traders
From the illustration below we can see how the 15 min Range breakdown confirms the breakdown of the Inverted Cup Pattern for Price Action Traders & Support & Resistance Traders using the same area of breakdown as the new Resistance to enter Short trades
3. Let's identify if Price is satisfying the Trade Entry Conditions using the 'Zig-Zag Lines' feature
Statistics say that majority (> 80%) of Traders blow up their accounts multiple times or completely give up and never achieve profitability.
One of the primary reasons for this is Traders punching trades randomly and without having proper Setup or rules for entering Trades.
Also in order to arrive at rules or execute the different entry models (couple of examples highlighted earlier) taught by different Trainers, a Trader needs to learn to visualize charts in a similar format to what the trainers are teaching.
The Zig-Zag lines feature is a form of line chart that joins the swing high points to the swing low points on the chart to represent the True Price action & a proper fractal nature of the markets, unlike the line chart which is formed by only by joining the closing value of each candle.
From the image below we can see that the Zig-Zag lines feature eliminates the randomness visible in the line chart and is a more smoother chart. Using this feature one can back test the various entry models widely available on the internet or arrive at a user specific model which he/she is comfortable with.
CONCLUSION:
Trading with a deeper understanding of Price Action allows a Trader/Investor to enter or exit trades with ease. Price Action trading allows individuals to keep their charts clean and stay away from the other lagging technical indicators and enter trades much earlier than other technical indicators.
This indicator attempts in simplifying the understanding of price action for every one and identify potential high probability areas / levels where one should enter / exit trades.
This indicator will be an important tool in the arsenal of any Trader / Investor to take better informed trades, however it does not guarantee profitability of a Trader, due to the randomness of the markets & external factors that influence each trader.
GET ACCESS:
Refer Author's instructions below to get access to the indicator

ICT Killzones Toolkit [LuxAlgo]The ICT Killzones Toolkit is a comprehensive set of tools designed to assist traders in identifying key trading zones and patterns within the market.
The ICT Killzones Toolkit includes the following Price Action components:
ICT Killzones with Pivot Highs/Lows
Order Blocks
Breaker Blocks
Fair Value Gaps
Market Structure Shifts
By combining these components, the ICT Killzones Toolkit provides traders with a comprehensive framework for analyzing the market and identifying setups of interest. Leveraging these tools effectively can enhance traders' decision-making process and improve killzones interpretability.
🔶 USAGE
In forex/futures trading, timing is crucial. ICT Killzone are specific periods when there's a higher chance of finding setups of interest. Mastering these time intervals can offer significant advantages to traders who know how to use them effectively.
The image above highlights a potential setup of interest when using the ICT Killzones Toolkit.
As another example for utilizing the ICT Killzones Toolkit, we can see in the image above when price retests setups generated from killzones such as Order Blocks or Fair Value Gaps, a potential strategy could be to look for entries on those & take profits as the next killzone appears.
🔹 Order Blocks
Order Blocks are sections on a price chart where notable buying or selling activity has occured, often signaling interest zones for institutional traders. This toolkit's Order Blocks component pinpoints these areas within the Killzone, which may act as potential support or resistance levels.
🔹 Breaker Blocks
Breaker Blocks are zones built from mitigated order blocks, and highlight zones on the chart where price has previously stalled or reversed. These areas may act as significant barriers to price movement in the future, and the Breaker Blocks component helps traders identify them for potential trading opportunities.
🔹 Fair Value Gaps
Fair value gaps are especially favored by price action traders and arise from market inefficiencies or imbalances, typically when buying and selling are unequal. These gaps often attract price movement before resuming in the same direction. the Fair Value Gaps component of the toolkit helps traders identify and analyze them.
🔹 Market Structure Shifts
Market Structure Shifts refer to significant changes in the overall structure of the market, such as shifts in trend direction, volatility, or trading activity. These shifts can provide valuable insights into market sentiment and potential trading opportunities, and the Market Structure Shifts component helps traders identify and interpret them.
Overall, the ICT Killzone Toolkit combines these components to provide traders with a comprehensive framework for analyzing the markets and identifying high-probability trading setups.
🔶 SETTINGS
🔹 ICT Killzones
Asian, London Open, New York, and London Close: toggles the visibility of specific Killzones, allowing users to customize time periods and Killzone colors.
Killzone Lines : Top/Bottom, Mean and Extend Top/Bottom: toggles the visibility of the Killzone's pivot high and low lines, mean (average) line, and allows users to extend the pivot lines.
Killzone Labels: Toggles the visibility of the Killzone labels.
Display Killzones within Timeframes Up To: Toggles the visibility of the Killzones up to selected Timeframes.
Open Price, Separator, Label, and Color: toggles the visibility of the open price of the Killzones or for the day, week, or month. If the day, week, or month is selected, a separator will be displayed to highlight the beginning of each respective period. Additionally, users can customize the color and toggle the label as needed.
🔹 Order Blocks & Breaker Blocks
Order Blocks | Breaker Blocks: toggles the visibility of the order blocks & breaker blocks.
Swing Detection Length: lookback period used for the detection of the swing points used to create order blocks & breaker blocks.
Mitigation Price: allows users to select between closing price or wick of the candle.
Use Candle Body in Detection: allows users to use candle bodies as order block areas instead of the full candle range.
Remove Mitigated Order Blocks & Breaker Blocks: toggles the visibility of the mitigated order blocks & breaker blocks.
Extend Order Blocks & Breaker Blocks: enables processing of the order blocks & breaker blocks beyond the boundaries of the killzones.
Display Order Blocks & Breaker Blocks: enables the display of the first, last, or all occurrences of the order blocks & breaker blocks.
Order Blocks : Bullish, Bearish Color: color customization option for order blocks.
Breaker Blocks : Bullish, Bearish Color: color customization option for breaker blocks.
Show Order Blocks & Breaker Blocks Text: toggles the visibility of the order blocks & breaker blocks labels.
🔹 Market Structure Shifts
Market Structure Shifts: toggles the visibility of the market structure shifts.
Detection Length: market structure shift detection length.
Display Market Structure Shifts: enables the display of the first, last, or all occurrences of the market structure shifts.
Market Structure Shifts : Bullish, Bearish Color: color custumization option for market structure shifts.
Show Market Structure Shifts Text: toggles the visibility of the market structure shifts labels.
🔹 Fair Value Gaps
Fair Value Gaps: toggles the visibility of the fair value gaps.
Fair Value Gap Width Filter: filtering threshold wile detecting fair value gaps.
Remove Mitigated Fair Value Gaps: removes mitigated fair value gaps.
Extend Fair Value Gaps: enables processing of the fair value gaps beyond the boundaries of the killzones.
Display Fair Value Gaps: enables the display of the first, last, or all occurrences of the fair value gaps.
Bullish Imbalance Color: color customization option.
Bearish Imbalance Color: color customization option.
Show Fair Value Gaps Text: toggles the visibility of the fair value gaps labels.
🔶 RELATED SCRIPTS
Smart-Money-Concepts
Order-Blocks-Breaker-Blocks
Thanks to our community for recommending this script. For more conceptual scripts and related content, we welcome you to explore by visiting >>> LuxAlgo-Scripts .

Order Blocks Screener | Flux Charts💎 GENERAL OVERVIEW
Introducing our new Order Blocks Screener! This screener can provide information about the latest order blocks in up to 5 tickers. You can also customize the algorithm that finds the order blocks and the styling of the screener.
Features of the new Order Blocks Screener :
Find Latest Order Blocks Accross 5 Tickers
Latest Status, Restests, Bullish & Bearish Volume
Customizable Algoritm / Styling
📌 HOW DOES IT WORK ?
Order blocks occur when there is a high amount of market orders exist on a price range. It is possible to find order blocks using specific formations on the chart.
The high & low volume of order blocks should be taken into consideration while determining their strengths. The determination of the high & low volume of order blocks are similar to FVGs, in a bullish order block, the high volume is the last 2 bars' total volume, while the low volume is the oldest bar's volume. In a bearish order block scenerio, the low volume becomes the last 2 bars' total volume.
This screener then finds order blocks accross 5 different tickers, and shows the latest information about them.
Status ->
Far -> The current price is far away from the order block.
Approaching ⬆️/⬇️ -> The current price is approaching the order block, and the direction it's approaching from.
Inside -> The price is currently inside the order block.
Retests -> Retest means the price to invalidate the order block, but failed to do so. Here you can see how many times the price retested the order block.
For the bullish / bearish volume, check the "How Does It Work" section.
🚩UNIQUENESS
This screener can detect latest order blocks and give information about them for up to 5 tickers. This saves the user time by showing them all in a dashboard at the same time. The screener shows the number of the retests of the order block as an unique trait. Another unique ability of the screener is that it shows the latest valid order block's bullish and bearish volume in the dashboard.
⚙️SETTINGS
1. Tickers
You can set up to 5 tickers for the screener to scan order blocks here. You can also enable / disable them and set their individual timeframes.
2. General Configuration
Zone Invalidation -> Select between Wick & Close price for Order Block Invalidation.
Swing Length -> Swing length is used when finding order block formations. Smaller values will result in finding smaller order blocks.

Sessions Lite [TradingFinder] New York, London, Asia, NYSE Forex🔵 Introduction
A trading session is one of the basic concepts in the financial market that refers to specific time periods. In fact, a session means hours during the day and night, during which traders in a certain part of the world conduct their transactions.
Although the "Forex" and "CFDs" market is open 24 hours a day and it is possible to trade in it, but in some hours the activity in this market decreases so much that many traders prefer not to trade and only watch the market. On the other hand, there are specific times when the market is very busy and dynamic, and many traders tend to trade during these hours of the day and night.
Trading sessions are usually divided into three main categories, which are "Asian", "European" and "North American" sessions. These trading sessions are also called the "Tokyo", "London" and "New York" sessions, respectively. But they also categorized these sessions in more detailed ways such as "Sydney session", "Shanghai session" or "NYSE session".
🔵 Tokyo trading session (Asian session)
After the weekend that happens on Saturday and Sunday, the Forex market starts with the Asian session. In this continent, most of the transactions are done in the Tokyo session, and for this reason, it is usually called the Asian session or the Tokyo session. However, other countries such as Australia, China and Singapore also do a lot of trading in this session.
The Tokyo session has a lower volume of transactions compared to the London and New York sessions, and therefore the liquidity is lower. In this session, most of the Forex currency pairs move in a price range. For this reason, different people use the ups and downs with the trading strategy in the range and get profit.
The low liquidity of the Tokyo session means that trading spreads are also higher during these hours. Besides, most of the transactions of this session are done in the early hours and at the same time as the planned news release.
In the Tokyo or Asia session, the best currency pairs to trade are the "Japanese yen", the "Australian dollar", and the "New Zealand dollar".
"Nikkei" index is also a good option for trading. If you trade in the Tokyo session, you should also be aware of the release of economic news and data from Australian, New Zealand and Japanese financial institutions.
🔵 London trading session (European session)
After the Asian session, it is time for the European session. In this period of time, transactions are very large and many European markets are involved. However, the European session is usually known as the London session.
Because of its specific time zone, London is not only known as the Forex trading center in Europe, but it is also known as the Forex trading center in the world. The London session overlaps with two other major trading sessions in the world, Asia and America. This means that most of the Forex transactions are done in this session. According to the latest statistics, 32% of Forex transactions are related to the London session, which shows that about a third of the activity performed in Forex takes place during this period.
This will increase the volume of Forex transactions and increase liquidity. An event that causes the spread of transactions to decrease. Of course, high liquidity also leads to greater volatility, which is desirable for many traders.
In the European session, the pound and euro currencies and the "DAX", "FTSE100", and "CAC40" indices are known as the best tradable assets. Also, traders of this session should pay attention to the news and data published by the "European Central Bank" and the "Bank of England". The news of countries like Germany, France and Italy are also very important.
🔵 American trading session (New York session)
When the New York session begins, several hours have passed since the end of the Tokyo session, but the European session is in the middle. In this session, they usually affect the financial activities carried out in America, but they also affect other countries such as Canada, Mexico and several South American countries.
The "US dollar" and stock indices such as "S&P", "Dow Jones" and "Nasdaq" are the most important assets that are traded in this session.
The early hours of the American session have a lot of liquidity and volatility due to the overlap with the European session, but with the end of the European session, the activity in the American session also decreases.
You can trade all major Forex currency pairs in the New York trading session. In this session, the "Federal Reserve", as the most important central bank in the world, is the institution that you should pay attention to its news and data.
The trading session indicator is an analytical tool in the financial markets that is used to display and analyze specific trading periods during a day. These indicators are generally useful for determining support and resistance levels during any trading session and for detecting different trading patterns.
For example, usually these indicators display the open and close price levels, the highest and lowest prices during a trading session. Also, you may notice various price patterns such as price channels, price phase phases and market trend changes during different trading sessions using these indicators.
🔵 cause of construction
In particular, the session light indicator version is designed and built for those traders who use many different tools on their chart at the same time. These traders can include "Volume Traders", "ICT traders", "Day Traders" and... These individuals can use "Session Lite" without disturbing the display of their other trading tools such as "Order Blocks", "Liquidity", "Zigzag", "FVG" etc.
But in general, there are several reasons for making tools like trading session indicators in financial markets, some of which include the following :
1. Analysis of specific time frames : Some traders and investors like to consider specific time frames for price analysis and review. For example, analyzing price changes during each trading session can help analyze trading patterns and identify trading opportunities.
2. Recognize different price patterns : Different price patterns may be observed during trading sessions. Trading session indicators can help to make better trading decisions by analyzing these patterns and their strengths and weaknesses.
3. Identifying Support and Resistance Levels : These tools may help to identify support and resistance levels during any trading session which can be helpful in deciding whether to enter or exit the market.
🔵 How to use
The Session Lite indicator displays 8 sessions by default. Asia session, Sydney session, Tokyo session, Shanghai session, Europe session, London session, New York session and New York Stock Exchange (NYSE) session are the sessions that are displayed.
You can activate or deactivate the display of each session by using the tick button next to the name of each session.
Two gray vertical dashes are also displayed by default, which indicate the beginning of the European session and the New York session. This feature is available for all sessions, but it is enabled by default only for these two sessions, and you can activate it for the rest of the session. You can enable or disable the display of this line by using the Start Session tick key.
Likewise, the information table is displayed by default, which includes the open or closed information of each session and the start and end times of each session. These timings are based on the UTC time zone.
Accordingly, the schedule of trading sessions is as follows :
Asia session from 23:00 to 06:00
Sydney session from 23:00 to 05:00
Tokyo session from 00:00 to 00:06
Shanghai session from 01:30 to 06:57
European session from 07:00 to 16:30
London session from 08:00 to 16:30
New York session from 13:00 to 22:00
New York Stock Exchange (NYSE) session from 14:30 to T 22:00
Important note : the beginning of the European session coincides with the opening of the Frankfurt market.
🔵 Settings
• In the settings section, there are customization capabilities according to the type of use of each user. The settings related to showing or not showing the box of each session, the start indicator of each session, setting the start and end time of the session and choosing the desired color to display each session are among the things that can be set from this section.
• At the end of the settings, you will see the "Info Table" option; By disabling this option, the "sessions" clock table displayed on the upper right side will be disabled.

[TA] Breaker BlocksDescription:
The Breaker Blocks Finder is a sophisticated tool designed for traders who seek to identify key market structures algorithmically. This indicator meticulously scans for both bullish and bearish breaker blocks, visually delineating them on the chart for easy identification.
Exploring ICT Breaker Blocks: Enhancing Your Trading with Precision
Understanding ICT Breaker Blocks: ICT Breaker Blocks are a nuanced trading concept that leverages market liquidity and manipulation to identify potential breakout points. This strategy is particularly effective in pinpointing moments where the market is poised for a significant directional move.
Mechanics of ICT Breaker Blocks: The essence of this strategy lies in detecting manipulation phases where liquidity is being accumulated, typically around critical market highs or lows. This setup leads to a Stop Hunt, a tactical move to trigger stop orders and fuel a breakout in the opposite direction.
Detailed Breakdown of Breaker Block Types:
Bullish Breaker Blocks:
• Bullish Order Block: The precursor to a bullish breakout, setting the stage for a potential upward move.
• Bullish Breaker Candle: An upward-closing candle that forms just before breaking past an old low, signaling a bullish reversal.
• Confirmation: Achieved when the price dips below the prior low and subsequently rises above the high of the swing, solidifying the bullish breakout.
• Identification: Look for a failed bearish order block, indicated by an initial drop in prices that ultimately reverses, hinting at a bullish shift.
• Key Elements: Monitor the pattern of lows and highs (low, high, lower low, higher high), which suggests an emerging bullish trend.
Bearish Breaker Blocks:
• Bearish Breaker Candle: A downward-closing candle that appears right before an old high is surpassed, indicating a bearish reversal.
• Confirmation: Occurs when prices climb above the previous high and then descend below the swing's low, confirming the bearish move.
• Identification: Initiate by identifying a failed bullish order block, where initial upward price momentum falters and reverses, signaling bearish potential.
• Key Elements: Focus on the sequence of highs and lows (high, low, higher high, lower low), which may denote a looming bearish trend.
Spotting High Probability Breaker Blocks: To enhance the reliability of breaker block identification, incorporate patterns that exhibit a Fair Value Gap (FVG), which typically indicates a stronger likelihood of a successful breakout.
Leveraging ICT Breaker Blocks in Trading: Our Inner Circle Trading mentorship delves into these concepts and more, providing you with comprehensive education and weekly market insights.
By mastering ICT Breaker Blocks, you're equipped with a powerful tool to navigate the intricacies of the market, making informed and strategic trading decisions.
This channel provides you with comprehensive education and weekly market insights. If you enjoyed this thread, like, share, and follow. Join us for an in-depth exploration of advanced trading strategies, and elevate your trading proficiency.
Still confused about Breaker Blocks?
Follow these steps for Bullish Breaker Blocks and reverse them for Bearish Breaker Blocks.
Think:
Bullish BB = Low, High, Lower Low, then Higher High
Bearish BB = High, Low, Higher High, then Lower Low
While this tool is a powerful addition to your trading strategy, it's important to note that it is not an autotrader. Traders should use this indicator as part of a comprehensive trading plan, considering other market factors and personal risk tolerance.
Risk Disclaimer:
Trading financial markets involves significant risk and can result in the loss of your invested capital. You should not invest more than you can afford to lose and should ensure that you fully understand the risks involved. Before trading, please take into consideration your level of experience, investment objectives, and seek independent financial advice if necessary. This indicator is provided as-is without any guarantees or warranty. Use of this indicator is at your own risk, and the creator is not responsible for any financial losses or damages.

Volume Footprint Voids [BigBeluga]Volume Footprint Voids is a unique tool that uses lower timeframe calculation to plot different styles of single candle POC.
This indicator is very powerful for scalping and finding very precise entry and exits, spotting potential trapped traders, and more.
Unlike many other volume profiles, this aims to plot single candle profiles as well as their own footprints.
🔶 FEATURES
The script includes the following settings:
Windows: Plotting style and calculations
Coloring modes
Display modes
lower-timeframe calculations
🔶 CALCULATION
In the image above we can see how the script calculates each level position that will serve as a calculation process to see how much volume/closes there are within the levels.
In the image above, we can have a more clear example of how we count each candle close.
We use the prior screenshot as an example, after setting each level we will use the lower-timeframe input to measure the amount of closes within the ranges.
Depending on the lot size, the box will be larger or smaller, usually the POC will always have the highest box size.
NOTE: Size is the starting point, always from the low of the candle.
To find more voids, select a closer LTF to the current one you're using.
To find fewer voids, select a timeframe away from your current one.
Due to Pine Script limitations, we are only able to plot a certain amount of footprints, and we can't plot the whole history chart.
POC will be the largest block displayed, indicating the time point of control
Gray areas are closes above the average
Black are Void or imbalance that price will fill in the future, like FVG
The image above shows an incorrect size input that will lead to bad calculations, while on the other side, a correct size input that will lead to a clear vision and better calculation.
🔶 WINDOWS
The "▲▼" Mode will display delta buyers and delta sellers coloring with voids as black.
It also offers a gradient mode for a beautier visualization
The "Total Volume" mode will display the net volume within the lot size (closes within the levels).
This is useful to spot possible highest net volume within the same highest lot size.
The "POC + Gaps" will show both POC and Gaps as the highest block while all the rest will be considered as the smaller block.
This is useful to see where the highest lot were and if there are higher or lower imbalances within the candle
The last option "Gaps" will simply display the gaps as the highest block, while the POC as the lowest block.
This is useful to have a better view of the gaps areas
🔶 EXAMPLE
This is one of the most basic examples of how this script can be used. POC at the bottom creating a strong support area as price holds and creates higher voids gap that price fills while rising.
🔶 SETTINGS
Users have full control over the script, from colors to choosing the lower-timeframe inputs to disabling the lot size.

Order Blocks | Flux Charts💎 GENERAL OVERVIEW
Introducing our new Volumized Order Blocks indicator! This new indicator can render order blocks with their volumetric information. It's highly customizable with detection, invalidation and style settings.
Features of the new Volumized Order Blocks indicator :
Render Bullish & Bearish Order Blocks
Enable / Disable Volumetric Information
Enable / Disable Historic Zones
Visual Customizability
📌 HOW DOES IT WORK ?
Order blocks occur when there is a high amount of market orders exist on a price range. It is possible to find order blocks using specific formations on the chart.
The high & low volume of order blocks should be taken into consideration while determining their strengths. The determination of the high & low volume of order blocks are similar to FVGs, in a bullish order block, the high volume is the last 2 bars' total volume, while the low volume is the oldest bar's volume. In a bearish order block scenario, the low volume becomes the last 2 bars' total volume.
🚩UNIQUENESS
The ability to render the total volume of Order Blocks as well as bullish / bearish volume ratio is what sets this Order Block indicator apart from others. Also the ability to combine overlapping Order Block zones will result in cleaner charts for traders.
⚙️SETTINGS
1. General Configuration
Volumetric Info -> The volumetric information of the Order Blocks will be rendered if activated.
Zone Invalidation -> Select between Wick & Close price for Order Block Invalidation.
Swing Length -> Swing length is used when finding order block formations. Smaller values will result in finding smaller order blocks.

Spike RangeGuided by new ICT tutoring, I create this versatile Spike Range
This indicator shows a different way on how to display "Spikes or Shadows" based on their size,
the indicator divides the "Spike or Shadows" into levels 0.5 - 0.75 - 0.25 Fibonacci, giving the possibility of viewing the "Spike or Shadows" with a certain size and being able to use them as continuation or reversal zones
The user has the possibility to:
- Choose the size of the "Spike or Shadows"
- Choose to view "Spike or Shadows" levels
- Choose to show only bullish or only bearish "Spike or Shadows" levels
The indicator should be used as ICT shows in its concepts.
The indicator takes into account the "Spades or Shadows" that have a certain size (based on the minimum range set)
These Spikes can be rated as "FVG" so you can expect reactions on the levels it marks, considering a reversal or continuation based on the range being respected
If the Spike is Bullish and the Price closes by invalidating 50% of the range we can evaluate a possible entry up to the High of the Spike
Below is an example of how to use them:
Invalidades Range
Respect Range
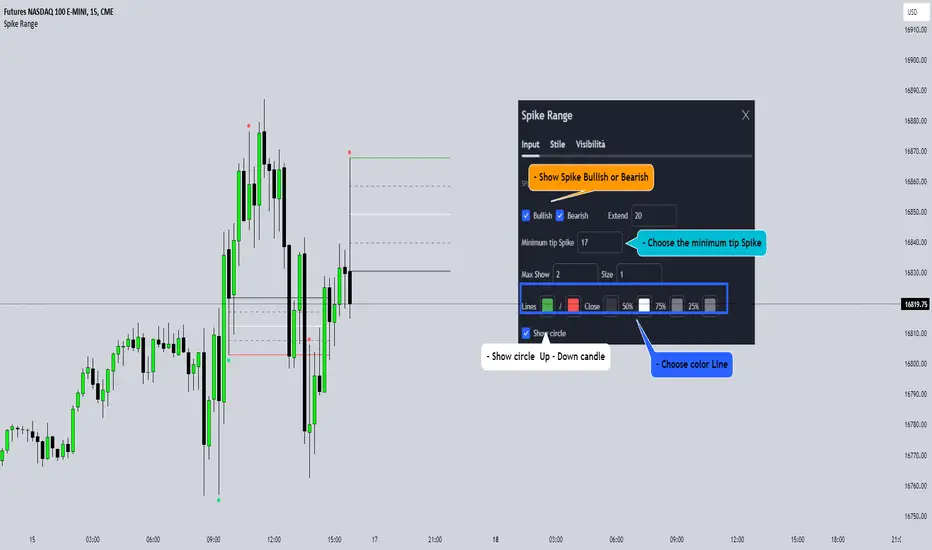
EXOFADEEXOFADE is an incredible trading indicator designed help give traders a visual clue of price momentum by combining Linear regression calculations with volume.
Overview:
ExoFade is a unique and dynamic trading indicator designed for both beginner and professional traders. At its core, it uses a sophisticated blend of multiple linear regression analysis, incorporating price, time, and volume-weighted moving average (VWMA) to predict potential price movements. By analyzing these key factors, EXOFade offers an innovative approach to understanding market trends and identifying trade opportunities.
Why It Works:
ExoFade works by calculating a regression line that adapts to market conditions, factoring in both price trends and trading volumes. This approach provides a more nuanced view of market momentum, going beyond traditional price-only indicators. The inclusion of time as a variable offers unique insights into market dynamics, making ExoFade a valuable tool for various trading strategies.
Key Features to Look Out For:
Regression Line: The heart of ExoFade, offering visual cues about the market's direction.
ATR-Based Fade Levels: Utilizes Average True Range (ATR) to set dynamic levels that signal potential reversals or continuation. The indicator comes with three fade levels, which are described below
Alert Conditions: You can set up for alerts for when any of the fade levels have been been reached, indicating potential entry points.
What Are Fade Levels And How To Use The Enter Trades:
The exofade line always moves with price, this indicates that the current volume is moving in the same direction.
When you see the exofade start to move ahead of price. For example, in an Uptrend, if price stops making new highs and you see the exofade line continue moving up ahead of price as price stagnates, this is the first time that you should be expecting pull back or reversal. When the line starts to visibly curve, this when you want to enter the trade.
Sometimes, the exofade line will move just a little bit ahead of price, and sometimes it will move a clear distance ahead of price.
From my experience, the further ahead it moves from price without price keeping up, the higher the probability of a pullback or reversal.
The actual pullback then starts when the exofade line starts to curve, which signifies the start if the actual pullback.
Since we cannot sit and watch for when the line has either moved further ahead enough or started to curve, thats why i figured to use ATR as the best way to measure the distance the exofade line moves ahead of price and the ATR also happens to measure Volatility, which makes it a perfect match.
From forward testing this for months, i have found the pullbacks typically start when the exofade line has moved ahead of price by atleast 2 ATR's. A distance of 2 ATR and above are the ones i consider the best setups. This also marks the point for your stop loss, since 2 ATR is generally used stoploss level.
To catch and sell a pullback in an uptrend, you can set alert for one or both of these alerts
Fade Level 2 abv price - This alert will trigger once Exofade line reached 2 ATR ABOVE price (Just means it has reached 2 atr, dosent mean it has started curving yet)
Curve lvl 2 - SELL - This alert means the exofade line has started to curve at 2 ATR
To buy pullbacks in a downtrend you set the opposite alerts of the one above for curve below price
There are also same alerts for level 3 as well, which is 2.5 ATR
IMPORTANT NOTES - DONT SKIP THIS
For daily and intra-day swings - Use this on 1hr trend upwards - The exofade line much slower on higher timeframe, so when you get a curve on a high time frame, like the 4HR or Daily timeframe, those are excellent signals
For scalpers trading 1hr below - The exofade moves faster on lower timeframes, so more caution should be used with these on lower timeframes , you this with other confluences like a good momentum oscillator oversold/overbought regions StochRSI, MACD etc
EXTRA TIPS
- Since the curve forms slower on higher time frames, it means getting a curve the on daily and weekly chart can help in your trend analysis to detect early signs of potential trend reversals
-I typically pair this with my customized version of Nadaraya watsons envelope ( a free indicator on tradingview) It will further improve your entry and winrate. Biggest advantage is for setting a profit target. In a buy trade for example, you buy the curve below price and set your profit target for the top band of the nadaraya watson envelope. Very efficient for scalping
- Unique areas were you want to pay attention to the exofade is when price enters points of interest, this depending on your trading style could be a
-FVG - fair value gaps
-Order blocks
- Supply / Demand areas
-Volume profile Value area High and Value area Low
The are two scenarios i would like you to be cautious of
1. As with every indicator and strategy, i most definitely wouldn't use this during high impact news.
2. If price is trending very strongly in one direction only, such that even barely gives any decent pull backs at all. Most especially if that strong push is happening between the 4hr to Daily time frame. Do not attempt to counter those trends unless you know what you are doing. Its not advisable.
Instead i'll recommend using the Exofade to catch an entry in the direction of the trade for a continuation.
And Lastly
Since this indicator uses VOLUME data as part of its calculations. It will not work on any pairs that tradingview does not provide volume data for, like Gold. But it will work normally on Gold Futures, since that has volume data

itradesize /\ Model x RTH Gap
I’m happy to announce my model and sharing it with you as an indicator.
About the model
The model is based on a range from 18:00 until 1:30. If you are keen you probably know that it's something that based on a bit of Daye's Theory. As Daily Q4 is from 18:00 until 0:00 and I've added a 90's Q1 to it as well that's why it ended up at 1:30.
It's an accumulation range and where we are looking for some opportunities above or below it when the algo is trying to fake the traders as the high and the low of the range are both important zones for liquidity pools. This model works on almost every pair but I've been mostly focusing on indices, especially on ES, NQ, and EUR/USD.
Do not trade before 1:30 AM and do not trade this model after 6:00 AM. So any tradable setup must be valid until 6:00 AM.
*All the mentioned times are based on America/NewYork timezone.
A simple sell setup
∆ If it takes the high of the model, then look for short opportunities.
∆ The best reliable scenario is when a high is taken while retracing back to an HTF PD Array so it will end up in a failure swing, Judas swing, you name it.
∆ When a high is taken you should wait for a market structure shift then it should give a nice displacement where it should retrace.
∆ The imbalance after the shift can be on every timeframe, based on your trade idea.
∆ If there are more imbalances, your decision on which to go with (as if there is a BPR, Breaker, OB, etc.. - can change the view of an FVG).
The same story goes for a buy setup.
∆ The first target is always the EQ of the model's range.
∆ The second target could be liquidity inside the EQ and the other side of the model (optional).
∆ The third target is the other side of the model.
∆ You can always leave a runner there if you eyeing some levels outside the model.
Additional information
∆ You can use silver bullet range as an extra confirmation when you looking for the actual displacement.
∆ An RTH range is also added to the indicator (starts drawing at 9:30 when the futures market opens) as it can be used to trade in the NY session and it is a must-have thing when trading indices.
∆ The colors of every label are switched automatically based on your chart's coloring.

SMC Indicator With WebhookThis indicator includes
- Liquidity sweeps
- FVG
- MSS
- Sessions
The alert system is set up for Discord webhooks. Discord webhook can be set up by creating a webhook in your Discord server then pasting the webhook url into the webhook url input box for the alert you create on the indicator.
You can create different alerts for different timeframes and symbols. E.g. HTF liquidity sweeps and LTF MSS.
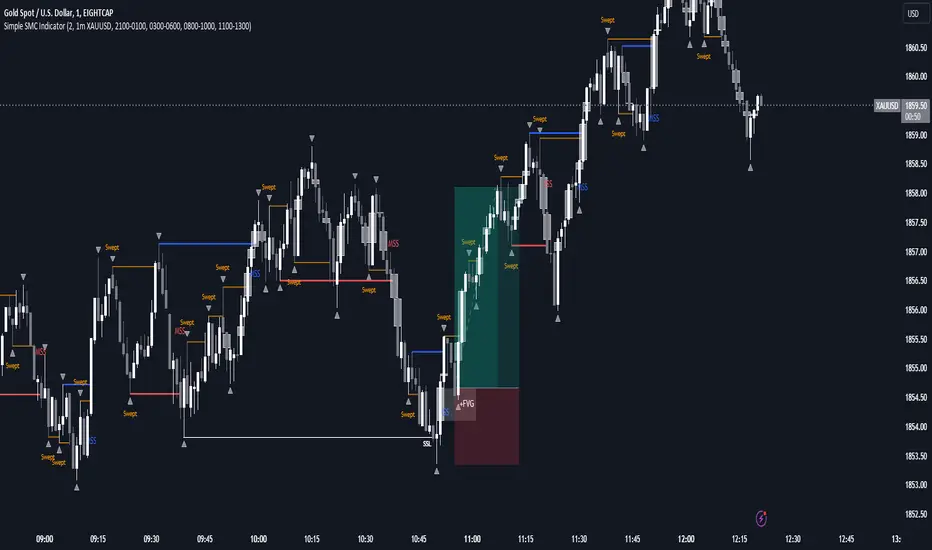
OrderBlock_TradingHubAn order block refers to a specific area on chart that represents a significant level of support or resistance where institutional traders have placed large orders. By identifying order blocks, traders can gain insights into the intentions and actions of the smart money participants.
Typically, the order block is represented by the last bullish (bearish) candle before a downtrend (uptrend) initiate. Whereas this indicator is quite different from the existing order block detection tools. It categorizes order blocks into different types (Main order blocks, Unmitigated shadow order blocks and Single candle order blocks), checking the following criteria based on TradingHUB-3 technical method:
1) Take out liquidity
2) Cause imbalance
3) Not to be inside-bar
How it works:
This indicator identifies 3 types of order blocks through the following procedure:
1) Main Order Blocks (Extreme, Decisional, and SMT(smart money trap)):
• Check that the candle is not inside bar.
• Check that the candle has taken out the liquidity beyond the previous candle's high/low.
• Check that the candle has created an imbalance (FVG) after; if not: the order block will be transferred to the first following candle that created imbalance. We check up to three following candles to find any imbalance.
2) Unmitigated Shadow Order Blocks:
• Check that the candle has taken out the liquidity beyond the previous candle's high/low.
• Check that the price has not touched the shadow so far.
3) Single Candle Order Blocks (SCOB):
• Check that the candle is not inside bar.
• Check that the candle has taken out the liquidity beyond the previous candle's high/low.
• Check confirmation:
- If the candle is closed higher/lower than the previous candle high/low, it is confirmed as a SCOB; otherwise:
- Move forward up to a specified number (determined by the user) to find a confirmation candle. A confirmation is a candle that closed higher/lower than the SCOB and its following candles high/low. The SCOB's following candles, and the confirmation candle should not take out the SCOB's liquidity again.
How to use it:
• This indicator can be used in all time frames.
• If the liquidity is taken out in an uptrend (downtrend) market structure, when the price meets the order blocks, we can go to lower timeframes and look for a trigger to enter the long (short) trade.
• It is essential for smart money traders to diagnose the market structure accurately. The "Structure_TradingHub " indicator is recommended for its ability to analyze the market structure effectively.
Indicator options:
• Show/Hide mitigated order Blocks: By this option, the user can choose whether to delete the touched order blocks or trimmed them.
• Show/Hide the unmitigated shadows. They are displayed by dashed lines.
• Show/Hide single candle order blocks: They are displayed by two lines placed above and below the candle.
• Changing the color and style of uptrend and downtrend order blocks.
