Pivot Point SupertrendHello All,
There are many types of SuperTrend around. Recently I thought about a Supertrend based on Pivot Points then I wrote "Pivot Point SuperTrend" script. It looks it has better performance on keeping you in the trend more.
The idea is behind this script is finding pivot point, calculating average of them and like in supertrend creating higher/lower bands by ATR. As you can see in the algorithm the script gives weigth to past pivot points, this is done for smoothing it a bit.
As I wrote above it may keep you in the trend more, lets see an example:
As an option the script can show main center line and I realized that when you are in a position, this line can be used as early exit points. (maybe half of the position size)
While using Pivot Points, I added support resistance lines by using Pivot Point, as an option the script can show S/R lines:
And also it can show Pivot Points:
When you changed Pivot Point Period you can see its reaction, in following example PP period is 4 (default value is 2). Smaller PP periods more sensitive trendlines.
Alerts added for Buy/Sell entries and Trend Reversals. (when you set alerts use the option " Once Per Bar Close ")
ENJOY!
在腳本中搜尋"trendline"

[Coingrats] Trading strategie v1 [BETA]//=================================================================================================
THIS IS A BETA VERSION AND FREE TO USE FOR EVERYONE.
BECOME BETA TESTER, PLACE A COMMENT. FEEDBACK IS VALUED.
WHEN THE BETA PERIOD IS EXPIRED THIS SCRIPT WILL BE ADAPTED TO A FREE VERSION
FOR THE BETA TESTERS (DON'T FORGET YOUR COMMENT) THERE IS A LIFETIME OFFER FOR THE PREMIUM
I DEVELOPED THIS STRATEGY TO QUICKLY DISCOVER TREND CHANGES OR WHERE INDECISION IS PRESENT
DO NOT TRADE BLINDLY, BUT CHECK THE FINDINGS THAT YOU SEE ON THE CHART
USE WITH HOLLOW CANDLES ONLY!!!!
ALL PROCESSED IN ONE INDICATOR, ALSO WITH A FREE TRADINGVIEW ACCOUNT YOU CAN USE HIM.
FOR CONFIRMTION YOU CAN ADD THE INDICATORS RSI AND MACD
WE ARE ALSO DEVELOPING OUR OWN CRYPTORADAR THAT CAN GIVE YOU VARIOUS SIGNALS ON TELEGRAM.
CHECK THE WEBSITE MYCRYPTORADAR.COM
//=================================================================================================
//INFO DIVERGENCE STRATEGIE
- When there is a line visible the bull(green)/bear(red) divergence is legit. Go long or short
- When there is a green triangle above a candle, take some profits on the bull divergence
- When there is a red triangle below a candle, take some profits on the bear divergence
- You can play with the settings but i think this are the best settings.
- Standard settings work best on higher timeframe (4H or higher)
//INFO PIVOT REVERSAL STRATEGIE
- When there is a green cross under a candle = possible signal to go long
- When there is a red cross above a candle = possible signal to go short
//INFO S/R LINES AND TRENDLINES
- Automatic set S/R levels on the timeframe on your chart
- In the settings you can enable trendlines on your chart
- Calculation mode = strict. You get a clean chart with major S/R lines
- Calculation mode = loose. You get a chart with more S/R lines. It helps to find orderblocks
- Top and bottom fractal source. Choose what you like for setting the S/R lines
//INFO CANDLE STRATEGIE
- Paints outside candles green
- Paints inside candles blue
- Paints highwave candles purple
- Paints morning star patterns red
- Paints evening star patterns grey
- Marked bullish engulfing with a green BE mark
- Marked bearish engulfing with a red BE mark
//INFO EMA - SMA
- You have the choice of 5x EMA and 3X SMA lines
- Including crossover alerts for all crossovers
- Standard only crossover EMA8 - EMA21, Golden cross & Death cross (SMA) signals are enabled
- Signal// EMA8 - EMA21 crossover marked a bleu/purple dot on the crossover
- Signal// Golden cross marked a golden cross on the crossover
- Signal// Death cross marked a red cross on the crossover
- In the settings you can set your own crossover alerts
unRekt Multi 'Type' MA+unRekt Moving Averages with Mutliple MA Types, Guppy, Ribbons and Trendline.
This script has 8 Adjustable Moving Averages that default to 8, 13, 21, 34, 55, 100, 200, 300.
Select what type of moving average you want to use including; EMA, SMA, WMA, VWMA, SMMA, DEMA, TEMA, HullMA, SSMA, ZEMA, TMA
All options can be turned on or off using input switch:
Trendline will show current trend based on price.
MA Ribbons have 9 MA's.
Guppy option is designed to be used with MA Ribbon.

[AN] Traders Magic OscilatorsOscillator that determines the current trend and signals possible trend reversals.
Best used alongside Gaussian Trendlines ()

[LAVA] Relative Price DifferenceThis script shows the relative price difference based off the last high and low, so many bars ago. Bollinger bands are also included by default for closer inspection on the intensity of the movement or the lack thereof. Bollinger bands will follow the smoothed line which will allow the reactionary line to cross the boundary during an intense movement. With the colors selected, a gray color will appear after the color to the zero line to announce a deep correction is possible. Buy/Sell indicators show up as crosses to indicate when the price is moving in a certain direction. Sideways stagnation will have several crosses due to the close proximity to the zero line.
I use 21 in the demo here without the bollinger bands or buy/sell indicators to show the power of the script to identify bottoms and tops using the tips and hand drawn trendlines.
(This script is actually the same script as before, but listed here as the final version. Hopefully this will be my last update with this script.)
If you use and enjoy this script, please like it!

Exponential Trend [AlgoAlpha]OVERVIEW
This script plots an adaptive exponential trend system that initiates from a dynamic anchor and accelerates based on time and direction. Unlike standard moving averages or trailing stops, the trend line here doesn't follow price directly—it expands exponentially from a pivot determined by a modified Supertrend logic. The result is a non-linear trend curve that starts at a specific price level and accelerates outward, allowing traders to visually assess trend strength, persistence, and early-stage reversal points through both base and volatility-adjusted extensions.
CONCEPTS
This indicator builds on the idea that trend-following tools often need dynamic, non-static expansion to reflect real market behavior. It uses a simplified Supertrend mechanism to define directional context and anchor levels, then applies an exponential growth function to simulate trend acceleration over time. The exponential growth is unidirectional and resets only when the direction flips, preserving trend memory. This method helps avoid whipsaws and adds time-weighted confirmation to trends. A volatility buffer—derived from ATR and modifiable by a width multiplier—adds a second layer to indicate zones of risk around the main trend path.
FEATURES
Exponential Trend Logic : Once a directional anchor is set, the base trend line accelerates using an exponential formula tied to elapsed bars, making the trend stronger the longer it persists.
Volatility-Adjusted Extension : A secondary band is plotted above or below the base trend line, widened by ATR to visualize volatility zones, act as soft stop regions or as a better entry point (Dynamic Support/Resistance).
Color-Coded Visualization : Clear green/red base and extension lines with shaded fills indicate trend direction and confidence levels.
Signal Markers & Alerts : Triangle markers indicate confirmed trend reversals. Built-in alerts notify users of bullish or bearish direction changes in real-time.
USAGE
Use this script to identify strong trends early, visually measure their momentum over time, and determine safe areas for entries or exits. Start by adjusting the *Exponential Rate* to control how quickly the trend expands—the higher the rate, the more aggressive the curve. The *Initial Distance* sets how far the anchor band is placed from price initially, helping filter out noise. Increase the *Width Multiplier* to widen the volatility zone for more conservative entries or exits. When the price crosses above or below the base line, a new trend is assumed and the exponential projection restarts from the new anchor. The base trend and its extension both shift over time, but only reset on a confirmed reversal. This makes the tool especially useful for momentum continuation setups or trailing stop logic in trending markets.

Market StructureThis is an advanced, non-repainting Market Structure indicator that provides a robust framework for understanding market dynamics across any timeframe and instrument.
Key Features:
- Non-repainting market structure detection using swing highs/lows
- Clear identification of internal and general market structure levels
- Breakout threshold system for structure adjustments
- Integrated multi-timeframe compatibility
- Rich selection of 30+ moving average types, from basic to advanced adaptive variants
What Makes It Different:
Unlike most market structure indicators that repaint or modify past signals, this implementation uses a fixed-length lookback period to identify genuine swing points.
This means once a structure level or pivot is identified, it stays permanent - providing reliable signals for analysis and trading decisions.
The indicator combines two layers of market structure:
1. Internal Structure (lighter lines) - More sensitive to local price action
2. General Structure (darker lines) - Shows broader market context
Technical Details:
- Uses advanced pivot detection algorithm with customizable swing size
- Implements consecutive break counting for structure adjustments
- Supports both close and high/low price levels for breakout detection
- Includes offset option for better visual alignment
- Each structure break is validated against multiple conditions to prevent false signals
Offset on:
Offset off:
Moving Averages Library:
Includes comprehensive selection of moving averages, from traditional to advanced adaptive types:
- Basic: SMA, EMA, WMA, VWMA
- Advanced: KAMA, ALMA, VIDYA, FRAMA
- Specialized: Hull MA, Ehlers Filter Series
- Adaptive: JMA, RPMA, and many more
Perfect for:
- Price action analysis
- Trend direction confirmation
- Support/resistance identification
- Market structure trading strategies
- Multiple timeframe analysis
This open-source tool is designed to help traders better understand market dynamics and make more informed trading decisions. Feel free to use, modify, and enhance it for your trading needs.

Linear Regression Channel [TradingFinder] Existing Trend Line🔵 Introduction
The Linear Regression Channel indicator is one of the technical analysis tool, widely used to identify support, resistance, and analyze upward and downward trends.
The Linear Regression Channel comprises five main components : the midline, representing the linear regression line, and the support and resistance lines, which are calculated based on the distance from the midline using either standard deviation or ATR.
This indicator leverages linear regression to forecast price changes based on historical data and encapsulates price movements within a price channel.
The upper and lower lines of the channel, which define resistance and support levels, assist traders in pinpointing entry and exit points, ultimately aiding better trading decisions.
When prices approach these channel lines, the likelihood of interaction with support or resistance levels increases, and breaking through these lines may signal a price reversal or continuation.
Due to its precision in identifying price trends, analyzing trend reversals, and determining key price levels, the Linear Regression Channel indicator is widely regarded as a reliable tool across financial markets such as Forex, stocks, and cryptocurrencies.
🔵 How to Use
🟣 Identifying Entry Signals
One of the primary uses of this indicator is recognizing buy signals. The lower channel line acts as a support level, and when the price nears this line, the likelihood of an upward reversal increases.
In an uptrend : When the price approaches the lower channel line and signs of upward reversal (e.g., reversal candlesticks or high trading volume) are observed, it is considered a buy signal.
In a downtrend : If the price breaks the lower channel line and subsequently re-enters the channel, it may signal a trend change, offering a buying opportunity.
🟣 Identifying Exit Signals
The Linear Regression Channel is also used to identify sell signals. The upper channel line generally acts as a resistance level, and when the price approaches this line, the likelihood of a price decrease increases.
In an uptrend : Approaching the upper channel line and observing weakness in the uptrend (e.g., declining volume or reversal patterns) indicates a sell signal.
In a downtrend : When the price reaches the upper channel line and reverses downward, this is considered a signal to exit trades.
🟣 Analyzing Channel Breakouts
The Linear Regression Channel allows traders to identify price breakouts as strong signals of potential trend changes.
Breaking the upper channel line : Indicates buyer strength and the likelihood of a continued uptrend, often accompanied by increased trading volume.
Breaking the lower channel line : Suggests seller dominance and the possibility of a continued downtrend, providing a strong sell signal.
🟣 Mean Reversion Analysis
A key concept in using the Linear Regression Channel is the tendency for prices to revert to the midline of the channel, which acts as a dynamic moving average, reflecting the price's equilibrium over time.
In uptrends : Significant deviations from the midline increase the likelihood of a price retracement toward the midline.
In downtrends : When prices deviate considerably from the midline, a return toward the midline can be used to identify potential reversal points.
🔵 Settings
🟣 Time Frame
The time frame setting enables users to view higher time frame data on a lower time frame chart. This feature is especially useful for traders employing multi-time frame analysis.
🟣 Regression Type
Standard : Utilizes classical linear regression to draw the midline and channel lines.
Advanced : Produces similar results to the standard method but may provide slightly different alignment on the chart.
🟣 Scaling Type
Standard Deviation : Suitable for markets with stable volatility.
ATR (Average True Range) : Ideal for markets with higher volatility.
🟣 Scaling Coefficients
Larger coefficients create broader channels for broader trend analysis.
Smaller coefficients produce tighter channels for precision analysis.
🟣 Channel Extension
None : No extension.
Left: Extends lines to the left to analyze historical trends.
Right : Extends lines to the right for future predictions.
Both : Extends lines in both directions.
🔵 Conclusion
The Linear Regression Channel indicator is a versatile and powerful tool in technical analysis, providing traders with support, resistance, and midline insights to better understand price behavior. Its advanced settings, including time frame selection, regression type, scaling options, and customizable coefficients, allow for tailored and precise analysis.
One of its standout advantages is its ability to support multi-time frame analysis, enabling traders to view higher time frame data within a lower time frame context. The option to use scaling methods like ATR or standard deviation further enhances its adaptability to markets with varying volatility.
Designed to identify entry and exit signals, analyze mean reversion, and assess channel breakouts, this indicator is suitable for a wide range of markets, including Forex, stocks, and cryptocurrencies. By incorporating this tool into your trading strategy, you can make more informed decisions and improve the accuracy of your market predictions.

Hodrick-Prescott Cycle Component (YavuzAkbay)The Hodrick-Prescott Cycle Component indicator in Pine Script™ is an advanced tool that helps traders isolate and analyze the cyclical deviations in asset prices from their underlying trend. This script calculates the cycle component of the price series using the Hodrick-Prescott (HP) filter, allowing traders to observe and interpret the short-term price movements around the long-term trend. By providing two views—Percentage and Price Difference—this indicator gives flexibility in how these cyclical movements are visualized and interpreted.
What This Script Does
This indicator focuses exclusively on the cycle component of the price, which is the deviation of the current price from the long-term trend calculated by the HP filter. This deviation (or "cycle") is what traders analyze for mean-reversion opportunities and overbought/oversold conditions. The script allows users to see this deviation in two ways:
Percentage Difference: Shows the deviation as a percentage of the trend, giving a normalized view of the price’s distance from its trend component.
Price Difference: Shows the deviation in absolute price terms, reflecting how many price units the price is above or below the trend.
How It Works
Trend Component Calculation with the HP Filter: Using the HP filter, the script isolates the trend component of the price. The smoothness of this trend is controlled by the smoothness parameter (λ), which can be adjusted by the user. A higher λ value results in a smoother trend, while a lower λ value makes it more responsive to short-term changes.
Cycle Component Calculation: Percentage Deviation (cycle_pct) calculated as the difference between the current price and the trend, divided by the trend, and then multiplied by 100. This metric shows how far the price deviates from the trend in relative terms. Price Difference (cycle_price) simply the difference between the current price and the trend component, displaying the deviation in absolute price units.
Conditional Plotting: The user can choose to view the cycle component as either a percentage or a price difference by selecting the Display Mode input. The indicator will plot the chosen mode in a separate pane, helping traders focus on the preferred measure of deviation.
How to Use This Indicator
Identify Overbought/Oversold Conditions: When the cycle component deviates significantly from the zero line (shown with a dashed horizontal line), it may indicate overbought or oversold conditions. For instance, a high positive cycle component suggests the price may be overbought relative to the trend, while a large negative cycle suggests potential oversold conditions.
Mean-Reversion Strategy: In mean-reverting markets, traders can use this indicator to spot potential reversal points. For example, if the cycle component shows an extreme deviation from zero, it could signal that the price is likely to revert to the trend. This can help traders with entry and exit points when the asset is expected to correct back toward its trend.
Trend Strength and Cycle Analysis: By comparing the magnitude and duration of deviations, traders can gauge the strength of cycles and assess if a new trend might be forming. If the cycle component remains consistently positive or negative, it may indicate a persistent market bias, even as prices fluctuate around the trend.
Percentage vs. Price Difference Views: Use the Percentage Difference mode to standardize deviations and compare across assets or different timeframes. This is especially helpful when analyzing assets with varying price levels. Use the Price Difference mode when an absolute deviation (price units) is more intuitive for spotting overbought/oversold levels based on the asset’s actual price.
Using with Hodrick-Prescott: You can also use Hodrick-Prescott, another indicator that I have adapted to the Tradingview platform, to see the trend on the chart, and you can also use this indicator to see how far the price is deviating from the trend. This gives you a multifaceted perspective on your trades.
Practical Tips for Traders
Set the Smoothness Parameter (λ): Adjust the λ parameter to match your trading timeframe and asset characteristics. Lower values make the trend more sensitive, which might suit short-term trading, while higher values smooth out the trend for long-term analysis.
Cycle Component as Confirmation: Combine this indicator with other momentum or trend indicators for confirmation of overbought/oversold signals. For example, use the cycle component with RSI or MACD to validate the likelihood of mean-reversion.
Observe Divergences: Divergences between price movements and the cycle component can indicate potential reversals. If the price hits a new high, but the cycle component shows a smaller deviation than previous highs, it could signal a weakening trend.

Hermes Reg FIBONACCI V.4Hermes Reg Fibonacci V.4 Indicator User Guide
Overview
The Hermes Reg Fibonacci V.4 indicator is a versatile tool used for identifying market trends and channels. This indicator analyzes price movements using logarithmic regression and Fibonacci levels, helping users determine the direction of the trend and identify support/resistance levels.
Parameters and Inputs
Source: The price data to be used in the calculations of the indicator. The default is the close price.
Length: The period length for the calculations of the indicator. The default is 262 and the minimum value is 10.
Deviation Multiplier (devlen): Set to 1.6.
Extend Lines: Determines whether the lines should be extended to the right of the chart.
Show Fibonacci Levels: Determines whether Fibonacci levels should be displayed.
Show Broken Channel: Determines whether to display the broken channel lines.
Up Trend Color (upcol): The color of the uptrend line.
Down Trend Color (dncol): The color of the downtrend line.
Fibonacci Up Trend Color (fibupcol): The color of the Fibonacci uptrend line.
Fibonacci Down Trend Color (fibdncol): The color of the Fibonacci downtrend line.
Channel Line Width (widt): The width of the channel line.
Fibonacci Line Width (fibwidt): The width of the Fibonacci line.
Working Mechanism of the Indicator
Logarithmic Source and Regression Channel Calculations:
The indicator takes the logarithm of the price data and calculates the logarithmic regression channel.
It calculates the middle line of the channel, slope, and the starting and ending points.
The standard deviation and the upper/lower boundaries of the channel are determined.
Channel and Fibonacci Levels:
Depending on user preferences, channel lines and Fibonacci levels are drawn on the chart.
Channel lines and Fibonacci levels are dynamically updated based on the slope and price movement.
When the channel is broken, it is displayed with the specified color and style.
Trend Direction and Alert Conditions:
The direction of the trend is determined based on whether the slope is positive or negative.
Alert conditions are defined for trend changes and channel breaks.
Symbols indicating the trend direction are displayed on the chart.
Usage Recommendations
Trend Following: The Hermes Reg Fibonacci V.4 indicator can be used to determine the current trend direction and identify potential trend reversal points.
Support and Resistance Levels: The indicator helps identify support and resistance levels by observing how the price moves within the channel.
Fibonacci Analysis: Fibonacci levels can be used to identify potential retracement and extension points.
Alerts and Notifications: Set alerts for trend changes and channel breaks to avoid missing important price movements.
The Hermes Reg Fibonacci V.4 indicator, with its user-friendly interface and flexible parameters, can be effectively used in different market conditions. By customizing the indicator, you can tailor it to suit your trading strategy.

Price Action Toolkit Lite [UAlgo]The Price Action Toolkit Lite is a comprehensive indicator designed to enhance your chart analysis with advanced price action tools. This powerful toolkit combines multiple technical analysis concepts to provide traders with a clear visualization of market structure, liquidity levels, order blocks, and trend lines. By integrating these elements, the indicator aims to offer a holistic view of price action, helping traders identify potential entry and exit points, as well as key levels of interest in the market.
🔶 Key Features
Market Structure Analysis: The indicator includes a ZigZag feature to highlight significant market highs and lows, aiding in the visualization of market structure changes and trends.
Liquidity Sweeps Detection: It identifies and displays liquidity sweeps, which are crucial for recognizing potential market reversals and areas of interest where significant price action is likely to occur.
Order Blocks: Automatically detects and draws order blocks, highlighting areas of institutional buying and selling pressure, which can serve as key support and resistance levels.
Trend Lines: The toolkit can draw and extend trend lines based on pivot points, providing a clear view of prevailing market trends and potential breakout points.
Customizable Settings: Users can adjust various settings, including the length of the ZigZag, liquidity detection sensitivity, the number of order blocks to display, and trend line detection parameters, allowing for a tailored analysis experience.
🔶 Disclaimer
The "Price Action Toolkit Lite " is intended for educational and informational purposes only.
It is not financial advice and should not be construed as such. Trading in financial markets involves substantial risk, including the risk of loss.
Past performance is not indicative of future results.
🔷 Similar Scripts

Returns Since PivotReturns Since Pivot (RSP) helps to analyze the trend and seasonality.
This indicator draws 2 separate lines
green - upward movement
red - downward movement
Unlike other trend indicators, it's important that even while uptrend you can still see the power of downward moves that occurred during move up.
Hints and setups:
1) Helps to identify clear up trend from the noisy/mixed one: clearly growing non-interrupted green line, without significant negative red lines.
2) Helps to see potential trend reversal: for example, clear strong green line was interrupted for a brief price drop. Then the uptrend continues, you see clear green line again. But -- it's visible that new green line is way less strong, so the price might have exhausted.
3) While trading on 5 min chart, you can set RSP to 1 hour, or 4 hours to get a clear picture of price action on macro timeframe.
4) Indicator is normalized, so you can compare different coins. For example, after the big drop and rebound, you can use RSP to understand which coin had more powerful rebound, thus potentially will be a best gainer in case if the market continues go up.

Price and Volume Breakout Buy Strategy [TradeDots]The "Price and Volume Breakout Buy Strategy" is a trading strategy designed to identify buying opportunities by detecting concurrent price and volume breakouts over a specified range of candlesticks.
This strategy is optimized for assets demonstrating high volatility and significant momentum spikes.
HOW IT WORKS
The strategy first takes the specific number of candlesticks as the examination window for both price and volume.
These values are used as benchmarks to identify breakout conditions.
A trade is initiated when both the closing price and the trading volume surpass the maximum values observed within the predetermined window.
Price must be above a designated moving average, serving as the trend indicator, ensuring that all trades align with the prevailing market trend.
APPLICATION
This strategy is particularly effective for highly volatile assets such as Bitcoin and Ethereum, capitalizing on the cues from sudden price and volume breakouts indicative of significant market movement, often driven by market smart money traders.
However, for broader markets like the S&P 500, this strategy may be less effective due to less pronounced volume and price shifts compared to the cryptocurrency markets.
DEFAULT SETUP
Commission: 0.01%
Initial Capital: $10,000
Equity per Trade: 70%
Backtest result sometimes gives fewer than 100 trades under certain higher timeframes, as most trades tend to have a long holding period. Entry conditions are also more stringent, which, combined with the relatively brief history of cryptocurrencies, results in fewer trades on longer timeframes.
Users are advised to adjust and personalize this trading strategy to better match their individual trading preferences and style.
RISK DISCLAIMER
Trading entails substantial risk, and most day traders incur losses. All content, tools, scripts, articles, and education provided by TradeDots serve purely informational and educational purposes. Past performances are not definitive predictors of future results.

Jemmy Trade Whales Multiple Signal Options - Nine in One $$$This script is a combination of several indicators and trading strategies.
Let's break down each part:
1. MACD Indicator (My MACD Indicator – Nabil's Version): This calculates the Moving Average Convergence Divergence (MACD) using Heikin Ashi candles. It uses Exponential Moving Averages (EMA) to compute the fast and slow lengths and then calculates the MACD line, signal line, and histogram based on the difference between these EMAs.
2. Smoothed Moving Average (SMMA): This calculates a smoothed moving average using a user-defined length.
3. Least Squares Moving Average (LSMA): This calculates a least squares moving average using a user-defined length.
4. High Low SAR - Nabil's Version: This section calculates various levels based on SAR (Stop and Reverse) indicator. It also plots lines based on certain conditions and includes SAR lines with specific properties.
5. Volume-Weighted Hull Moving Average (VHMA) - Nabil's Version: This calculates a volume-weighted Hull moving average.
6. SAR (Stop and Reverse): This calculates the SAR indicator with user-defined parameters.
7. Mean Reversion Strategy: This part calculates upper and lower bands based on a multiplier of Standard Deviation from a mean. It also generates buy and sell signals based on crossing these bands.
8. SSL Hybrid - Nabil's Version: This calculates various indicators like SSL (Stochastic Scaled Levels), ATR (Average True Range) bands, and Keltner Channels. It also plots buy and sell signals based on certain conditions.
9. Buy Signal Options: This section defines several conditions for generating buy signals based on different combinations of indicators and plots corresponding buy signals.
Each section seems to be relatively independent and focused on calculating specific indicators or trading strategies. The script combines these components to provide a comprehensive trading setup with various buy signal options based on user preferences.
BUY SIGNALS EXPLAINATION:
1. MAIN - Price: This signal triggers when the current candle's close price crosses above the lookback average line (lookbackavg). It indicates a bullish momentum when the price moves above the average line.
2. MAIN - Price - SMMA - LSMA / Crossing: This signal combines multiple conditions:
• The current candle's close price crosses above the lookback average line.
• The smoothed moving average (SMMA) crosses above the lookback average line.
• The least squares moving average (LSMA) crosses above the lookback average line. This signal confirms a bullish trend when all three moving averages cross above the average line simultaneously.
3. MAIN - Price - (SMMA > LSMA) / No Crossing: This signal triggers when the following conditions are met:
• The current candle's close price crosses above the lookback average line.
• The SMMA is above the LSMA. This signal confirms a bullish trend when the SMMA remains consistently above the LSMA without crossing.
4. MAIN - Price - SMMA - LSMA - SAR - SSL / Crossing: This signal combines multiple conditions:
• The current candle's close price, SMMA, and LSMA cross above the lookback average line.
• The SAR (Stop and Reverse) indicator is above the SSL (Stochastic Scaled Levels). This signal indicates a strong bullish momentum when all conditions align.
5. MAIN - Price - (SMMA > LSMA) - SAR - SSL / No Crossing: This signal triggers when the following conditions are met:
• The current candle's close price crosses above the lookback average line.
• The SMMA is consistently above the LSMA.
• The SAR is above the SSL. This signal confirms a bullish trend without any crossing of moving averages.
6. MAIN - Price - SMMA - LSMA - SAR - SSL / Crossing - Coloring: Similar to signal 4, this signal additionally checks for specific colors of SAR and SSL lines to confirm a bullish momentum.
7. MAIN - Price - (SMMA > LSMA) - SAR - SSL / No Crossing - Coloring: Similar to signal 5, this signal also checks for specific colors of SAR and SSL lines to confirm a bullish trend without any crossing of moving averages.
8. MAIN Support line - 2 Candles: This signal triggers when the price pulls back from below the support line within the last two candles. It indicates a potential reversal from a support level.
9. MAIN Support line - lookBack Candles: This signal is similar to signal 8 but considers a specified lookback range for checking the pullback from below the support line.
These buy signals aim to identify various bullish scenarios based on combinations of price action, moving averages, SAR, and SSL indicators. Each signal offers different levels of confirmation for potential buying opportunities in the market.
USE IT WITH YOUR RISK MANAGEMENT STRATEGIES.
Future Updates "Coming Soon"
Targets - Under processing.
Stop loss - Under Processing.
Trailing - Under Processing.
Historical Data Table - Under processing.
Strength Table - Under Processing.
Whales Catcher - Under Processing.
Order Book Analyzer - Under Processing.
NABIL ELMAHDY $$

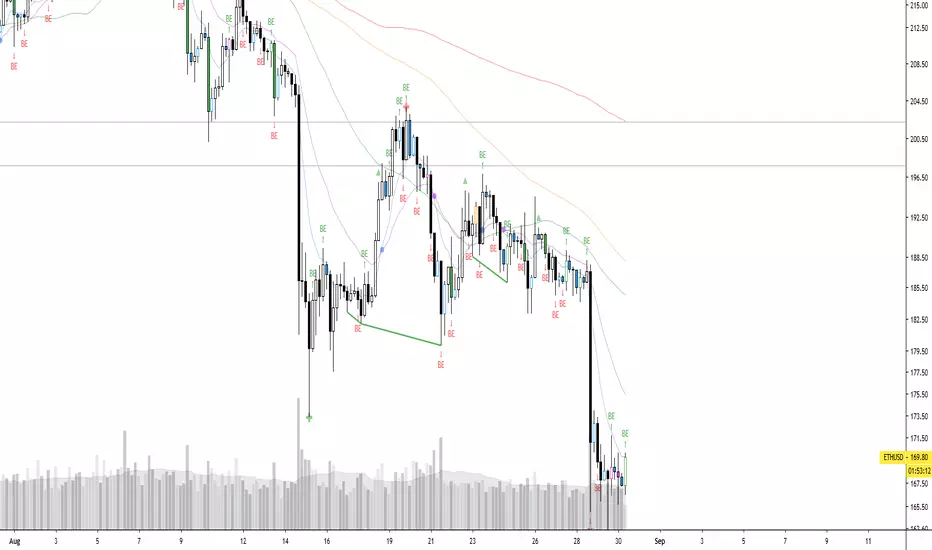
AllTheUpsTheresAlwaysDowns "AllTheUpsTheresAlwaysDowns" ☆ATUTAD☆ // w%r + ma indicator designed for forex trading.
This indicator combines the Williams %R, moving averages, and session tracking.
Key Inputs:
Williams%Range Period: Adjusts the sensitivity of the Williams %R calculation.
Moving Average Period: Defines the period for the moving average used in the indicator.
Overbought and Oversold Thresholds: Sets the thresholds for identifying overbought and oversold conditions.
Features:
Williams %R Calculation: Calculates the Williams %R, a momentum oscillator that measures overbought and oversold levels.
Moving Averages: Plots two moving averages to capitalize on and visualize trend direction.
Session Tracking: Identifies the start and end of trading sessions (Tokyo, London, New York) for better session-based analysis.
Signal Generation: Generates buy/sell signals based on Williams %R levels and moving average crossovers.
Color Coding: Visualizes color-coded bars and shapes to highlight different market conditions and signal types.
Alerts: For buy/sell signals and overbought/oversold conditions to prompt timely actions.
Usage Tips:
Interpret Signals: Trend direction through buy/sell signals and overbought/oversold trend,- reversal / breakout line conditions for potential trading opportunities.
Session Awareness: Take into account the trading sessions (Tokyo, London, New York) to move along with the market dynamics during different times of the day.
Confirmation: Use additional technical analysis tools to confirm signals before executing trades. For example the Williams Percetange Range indicator.
Risk Management: Trade with proper risk management strategies to avoid potential losses.
HappyTrading
ORB Heikin Ashi SPY 5min Correlation StrategyOverview:
The ORB (Opening Range Breakout) strategy combined with Heikin Ashi candles and Relative Volume (RVOL) indicator aims to capitalize on significant price movements that occur shortly after the market opens. This strategy identifies breakouts above or below the opening range, using Heikin Ashi candles for smoother price visualization and RVOL to gauge the strength of the breakout.
Components:
Opening Range Breakout (ORB): The strategy starts by defining the opening range, typically the first few minutes of the trading session. It then identifies breakouts above the high or below the low of this range as potential entry points.
Heikin Ashi Candles: Heikin Ashi candles are used to provide a smoother representation of price movements compared to traditional candlesticks. By averaging open, close, high, and low prices of the previous candle, Heikin Ashi candles reduce noise and highlight trends more effectively.
Relative Volume (RVOL): RVOL compares the current volume of a stock to its average volume over a specified period. It helps traders identify abnormal trading activity, which can signal potential price movements.
Candle for correlation : In this case we are using SPY candles. It can also use different asset
Strategy Execution:
Initialization: The strategy initializes by setting up variables and parameters, including the ORB period, session timings, and Heikin Ashi candle settings.
ORB Calculation: It calculates the opening range by identifying the high and low prices during the specified session time. These values serve as the initial reference points for potential breakouts. For this we are looking for the first 30 min of the US opening session.
After that we are going to use the next 2 hours to check for breakout opportunities.
Heikin Ashi Transformation: Optionally, the strategy transforms traditional candlestick data into Heikin Ashi format for smoother visualization and trend identification.
Breakout Identification: It continuously monitors price movements within the session and checks if the current high breaches the ORB high or if the current low breaches the ORB low. These events trigger potential long or short entry signals, respectively.
RVOL Analysis: Simultaneously, the strategy evaluates the relative volume of the asset to gauge the strength of the breakout. A surge in volume accompanying the breakout confirms the validity of the signal. In this case we are looking for at least a 1 value of the division between currentVolume and pastVolume
Entry and Exit Conditions: When a breakout occurs and is confirmed by RVOL and is within our session time, the strategy enters a long or short position accordingly. It does not have a stop loss or a takie profit level, instead it will always exit at the end of the trading session, 5 minutes before
Position Sizing and Commissions: For the purpose of this backtest, the strategy allocated 10% of the capital for each trade and assumes a trading commission of 0.01$ per share ( twice the IBKR broker values)
Session End: At the end of the trading session, the strategy closes all open positions to avoid overnight exposure.
Conclusion:
The combination of ORB breakout strategy, Heikin Ashi candles, and RVOL provides traders with a robust framework for identifying and capitalizing on early trends in the market. By leveraging these technical indicators together, traders can make more informed decisions and improve the overall performance of their trading strategies. However, like any trading strategy, it's essential to backtest thoroughly and adapt the strategy to different market conditions to ensure its effectiveness over time.

Trend Lines with Break Signals [UAlgo]🔶 Description:
The "Trend Lines with Breaks " indicator is designed to identify and visualize trend lines on a price chart, allowing traders to observe potential trend reversals or continuations. This script implements a method to draw trend lines based on pivot points (highs and lows) within a specified sensitivity range. It also provides an option to display breaks in these trend lines, aiding traders in recognizing significant market movements.
🔶 Key Features:
Trend Line Sensitivity Adjustment: Users can adjust the sensitivity of the trend lines using the "Trend Line Sensitivity" parameter, allowing customization based on market conditions and preferences.
Visualization of Trend Lines: The indicator visually represents trend lines on the chart, distinguishing between upward and downward trends. Users can customize the appearance of these trend lines, including color, style, and width.
Detection of Trend Line Breaks: Trend line breaks are identified by comparing the current price with the slope of the trend line. If the price breaks below (for bullish trend lines) or above (for bearish trend lines) the slope of the trend line, indicating a potential reversal, a "B" label is displayed on the chart. Trend line breaks are only displayed if the "showBreaks" parameter is enabled.
Before Bearish Trend Line Break :
If the price "Close" value closes above the trend line :
Before Bullish Trend Line Break :
If the price "Close" value closes below the trend line :
🔶 Disclaimer:
Not Financial Advice: This indicator is intended for educational and informational purposes only. It does not constitute financial advice or recommendations to buy, sell, or hold any financial instruments.
Use at Own Risk: Trading involves substantial risk of loss and is not suitable for all investors. Users of this indicator should exercise caution and conduct their own research and analysis before making any trading decisions.
Performance Not Guaranteed: Past performance is not indicative of future results. While the indicator aims to assist traders in analyzing market trends, there is no guarantee of accuracy or success in trading operations.

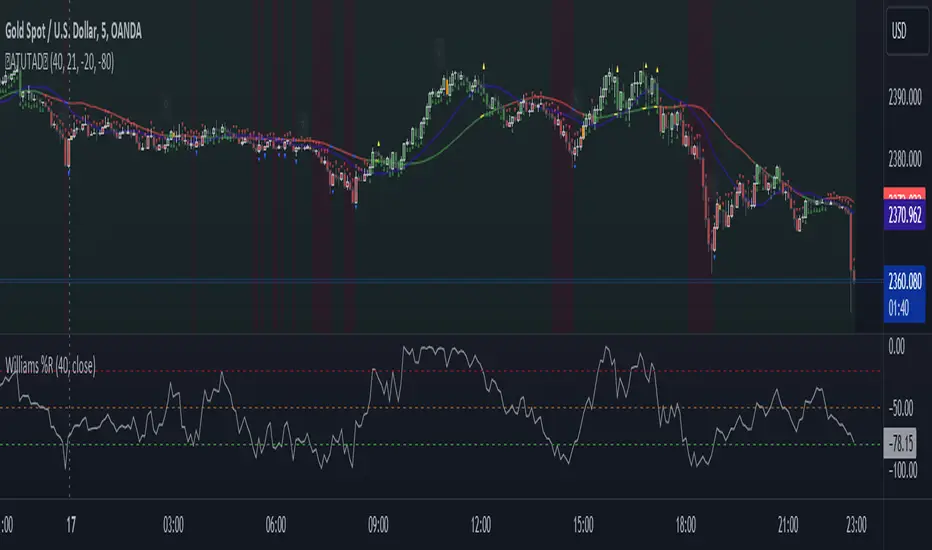
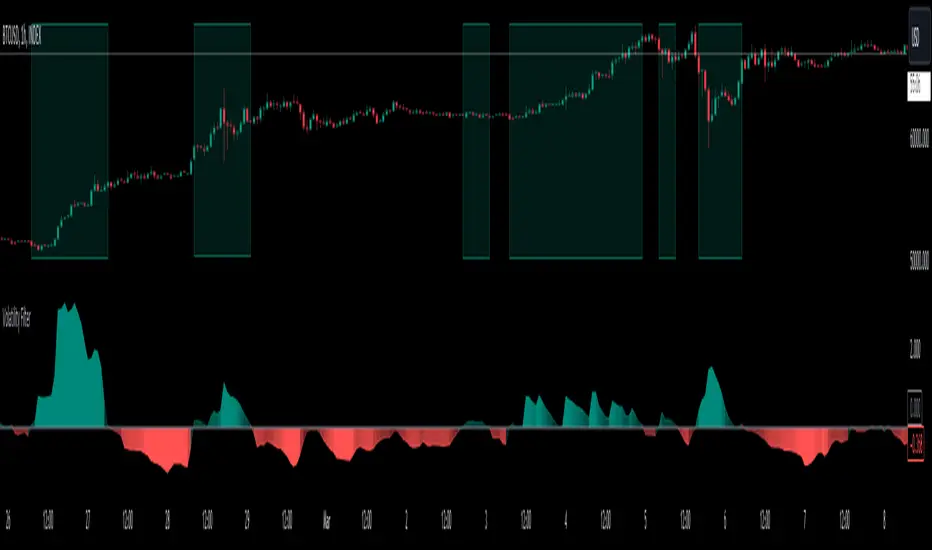
Volatility Filter v2VF v2 is a new iteration of my tool designed for traders who wish to gain a deeper understanding of market dynamics, specifically to distinguish periods of high volatility, which often correspond to strong market trends. By identifying these periods, traders can make more informed decisions, potentially leading to better trading outcomes.
Understanding Market Volatility:
At the heart of this script lies the concept of market volatility, a statistical measure reflecting the degree of variation in trading prices. Volatility is pivotal for traders; it provides insights into the market's emotional state, indicating periods of uncertainty or confidence. High volatility often correlates with strong trends, making it a critical indicator for trend-followers. By identifying when volatility crosses a certain threshold, traders can discern whether the market is likely to be in a trending phase or a more subdued, range-bound state.
How the Script Works:
The core functionality of the script revolves around a signal line that oscillates around a zero threshold. When the signal line is above zero, it indicates increased market volatility, suggesting the presence of a trend. The farther the oscillator deviates from zero, the stronger the implied trend. This mechanism enables traders to visually gauge market conditions and adjust their strategies accordingly.
Controlling the Indicator:
To cater to diverse trading styles and preferences, the script is equipped with several customizable settings:
Filter Threshold: This 'zero line' acts as the baseline for distinguishing between different volatility regimes. Crossing this threshold is a primary signal for changes in market volatility.
Moving Average Type: With over 30 types of moving averages to choose from, traders can select the one that best fits their analysis style. Each type offers a different perspective on price data, allowing for a tailored approach to trend identification.
Colorize Indicator: This feature enhances the visual representation of the indicator, making it easier to interpret. When enabled, the oscillator's color intensity varies with its proximity to the extremes, providing a quick visual cue about trend strength.
Advanced Settings – Length and Multiplier:
The script introduces an innovative approach to time frame analysis through its length and multiplier settings:
Length: This parameter sets the base period for all metrics within the script, similar to traditional indicators.
Multiplier: This unique feature differentiates the script by incorporating three distinct timeframes into the analysis: a lower timeframe, the main (current) timeframe, and a higher timeframe. The multiplier adjusts these timeframes relative to the main one. For instance, with a daily main timeframe and a multiplier of 2, the lower timeframe would be 12 hours, and the higher timeframe would be 2 days. This tri-timeframe approach aims to provide a more comprehensive volatility assessment.
Volatility Filter Indicators Section:
The script utilizes nine different, undisclosed metrics within its volatility filter. Traders have the flexibility to enable or disable these metrics based on their preferences, allowing for a customizable trading experience. Additionally, the script offers alert functionality for when the indicator crosses the threshold, either upwards or downwards, facilitating timely decision-making.
P.S
With better understanding of markets over time, I designed a new iteration of my volatility filter indicator. The second version provides faster, more precise way to analyze markets, but I also wanted to keep my first version untouched in case if some people find it better for their purposes. As I mentioned above, this version is calculated in a very different way from a previous one, so if you never tried it you can do it here
Break of Structure with trend table by GadatasThis indicator is designed to identify and track swing highs and lows in a given market on chart timeframe. It plots these swing highs and lows as solid lines on the chart. The indicator allows for customization of the line color and width. The selected timeframe trend is visually represented in a table located in the upper right corner of the chart. To enhance consistency, the background color of the timeframe column now elegantly matches the color of the BOS line.
The indicator follows specific rules to determine when a new high or low is created. If the current range is considered bullish (meaning the most recent breakout was to the topside), the indicator will only update the low if a candle's body falls below the current low. However, if the current range is bearish (most recent breakout to the downside), the indicator will only update the high if a candle's body rises above the current high.
When a range is identified as bullish, the indicator will continue updating the high until a swing high is formed, denoting the high of the range. The high will only change if a candle's body surpasses the previous high. The low, on the other hand, will be updated based on the last time a candle's body falls below a previous candle's low. The lowest low after this condition is met will be assigned as the low of the range.
Conversely, when a range is identified as bearish, the indicator will continue updating the low until a swing low is formed, denoting the low of the range. The low will only change if a candle's body falls below the previous low. The high, in this case, will be updated based on the last time a candle's body rises above a previous candle's high. The highest high after this condition is met will be assigned as the high of the range.
Swing highs are determined by having lower highs to the left and right, while swing lows have higher lows to the left and right. These swings are used to determine the final high or low of a bullish or bearish range, respectively.
Tis Indicator differs from other indicators by incorporating this concept to track market structure. The indicator assumes that significant market players sell before making heavy purchases in bullish ranges and buy before selling heavily in bearish ranges. The lines on the chart represent prior highs and lows, as well as the current updated highs and lows based on this theory. By using this indicator, one can gain insights into the structure of price movement and potentially identify bullish or bearish continuations. It can also provide confluence when analyzing multiple timeframes to validate trend-following strategies.
Open-source script.
It now displays both short and long condition changes along with their respective arguments:
1. In the case of a high Bos line break followed by a fall, a very long condition change is made when at least three breaks of Bos Low are observed, transitioning from very short to short then distribution , and after that to long.
2. Short conditions are indicated when a high Bos falls and the condition changes from very long to long and then accumulation, short, and very short with each break.
Additionally, the break counter column now shows positive numbers for long situations, indicating each low Bos break, and negative numbers for short situations, indicating each high Bos break.
The background color of the break counter column now changes to green for positive numbers and red for negative numbers.

Price Action Pattern Breakout Strategy: Wedge,Triangle,ChannelIntroducing the Price Action Pattern Breakout Strategy: Wedge,Triangle,Channel 💹🚀
The "Price Action Pattern Breakout Strategy: Wedge, Triangle, Channel" is a dynamic and automated trading strategy that excels in recognizing and capitalizing on breakout opportunities within the realm of powerful price action patterns. It is finely tuned to achieve exceptional precision in detecting three distinct pattern types: Wedge, Triangle, and Channel. This diversity equips you to confidently navigate a wide range of market scenarios and opportunities.
This strategy automates trade entries and exits upon confirmed pattern breakouts, this eliminates human errors in correctly recognizing patterns and prevents emotional decisions. This strategy is designed to work across different time frames, making it suitable for both short-term and long-term traders. Whether you're a day trader, swing trader, or investor, this strategy provides the flexibility you need to thrive in diverse market conditions.
💎 How it Works:
▶️ In this strategy, three price action patterns have been utilized, one of which is the "Wedge" pattern. The Wedge pattern has consistently demonstrated a high level of credibility, typically resulting in sharp and rapid price movements following a confirmed breakout from this pattern. This characteristic makes the Wedge pattern highly noteworthy in our strategy. The second pattern is the "Triangle" pattern, which, depending on its formation, whether ascending or descending, can indicate a strong continuation or reversal of the trend. The last pattern is the "Channel" pattern. The reason for using the Channel pattern is its versatility in various market conditions and its tendency to produce reliable results.
In the snapshot below, you can observe the types of patterns that this strategy is capable of identifying at a glance:
▶️ This strategy employs two types of targeting systems: Fixed Targets and Trailing Targets.
Fixed Targets is the default targeting system of the strategy, incorporating two primary targets: TP1 (Target Point 1) and TP2 (Target Point 2). These targets are thoughtfully adjusted in alignment with specific rules for each pattern. With Fixed Targets, you have the flexibility to designate the position size percentage for your exits at TP1 and TP2. For instance, should you opt to allocate 60% of your position size to TP1, as soon as the price triggers the first take profit level, 60% of your initial position is gracefully closed, leaving the remaining 40% to exit the trade upon reaching TP2.
Trailing Targets represent the strategy's alternative targeting system. With this system, the trailing stop becomes active once the price reaches the specified trigger point. The strategy then exits the trade based on the defined offset percentage and price retracement from the trailing limit.
▶️ This strategy relies on a single type of stop loss, determined by previous pivot points and adjusted based on the trade's direction, whether long or short, placing the stop loss above or below the prior pivot. This stop loss approach has demonstrated reliability when used alongside price action patterns.
In addition to this fixed stop loss, you can specify a percentage buffer, offering protection against potential stop hunting due to market fluctuations. This buffer helps protect your positions from sudden price swings. For example, selecting a 1% buffer means your stop loss will be positioned 1% higher or lower concerning the last pivot, depending on your trade's direction. This added layer of security ensures your trades remain resilient and less vulnerable to market volatility.
▶️ A practical feature of this strategy is the "Risk-Free" option. Once activated, it continuously monitors price movements, and as soon as the price progresses in the trade's direction and surpasses the designated Risk-Free Trigger Point in percentage, the stop loss is dynamically shifted from its initial position to the entry price, effectively making the trade "risk-free." This means that if the trade doesn't go as expected, we exit at the entry point, incurring neither profit nor loss from the trade.
Additionally, you have the flexibility to fine-tune the modified stop loss, positioning it slightly above or below the entry price through the configuration of a specified percentage. This allows for effective consideration of commission fees in your trading strategy.
▶️ Risk management is a crucial concept in trading, playing a significant role in a trader's long-term success. This strategy introduces a unique feature called "Fixed Loss Position Sizing", where upon activation, you can limit the risk exposure to a specified percentage of your capital per trade. Set your preferred risk percentage along with the intended leverage. The strategy independently considers your available capital and designated leverage, determining the position size before executing any trade.
In the case of a stop loss, your loss is limited to the specified risk percentage. For instance, with a $1000 account and a 1% risk set, the strategy adjusts each trade's size to ensure a maximum loss of $10 if the stop loss is triggered. Enabling this feature will ensure disciplined risk management, aligning potential losses precisely with your predetermined risk percentage, contingent upon your total available capital.
▶️ Another feature of this strategy is a sophisticated mechanism called "Loss Compensation". When enabled, Loss Compensation dynamically adjusts the position size after a loss, aiming to recover from previous losses in subsequent trades. This adaptive mechanism continually modifies the position size to mitigate the impact of consecutive losses until reaching a user-defined limit for consecutive loss compensations.
The feature's configurability allows users to set the maximum number of consecutive losses to compensate for and also includes an option to factor in trading fees from prior trades into the compensation calculation. Loss Compensation operates in conjunction with the 'Fixed Loss Position Sizing' setting, ensuring that once losses are sufficiently compensated, subsequent entries revert to the predefined configurations within the 'Fixed Loss Position Sizing' settings.
This advanced tool ensures a stable risk management approach by changing trade sizes dynamically according to past results during consecutive loss periods.
▶️ This strategy incorporates a feature known as the "Counter-Pattern Breakout", altering its approach to wedge, triangle, and channel pattern breakouts. Normally, the strategy relies on standard pattern signals to determine whether to enter long or short positions based on breakout directions.
For example, in an ascending channel or a rising wedge pattern, the strategy typically seeks a short position opportunity upon a confirmed breakout in the lower line, and breakouts from the upper line are disregarded by the strategy. But with this feature enabled, strategy disregards the conventional pattern signals, seizing breakouts from upper or lower lines to open corresponding positions. For instance, in the ascending channel or the rising wedge pattern example, the strategy might enter a long position if the upper line breaks or a short position if the lower line breaks.
This introduces a more adaptive and opportunistic trading style, allowing you to capitalize on price movements, irrespective of the typical signal direction indicated by the pattern.
▶️ This strategy is fully compatible with third-party trading bots, allowing for easy connectivity to popular trading platforms. By leveraging the TradingView webhook functionality, you can effortlessly link the strategy to your preferred bot and receive accurate signals for position entry and exit. The strategy provides all the necessary alert message fields, ensuring a smooth and user-friendly trading experience. With this integration, you can automate the execution of trades, saving time and effort while enjoying the benefits of this powerful strategy.
⚙️ How to Use & Configure User Settings:
To fully utilize the "Price Action Pattern Breakout Strategy: Wedge, Triangle, Channel," it's essential to consider and comprehend the following steps. They play a crucial role in enhancing its functionality and achieving its utmost potential outcomes:
1. General Strategy Settings:
Enable Dark Mode if using a dark TradingView theme for improved chart visibility.
Select the Strategy's Trade Direction: Long, Short, or Both.
Choose Pattern Recognition Accuracy: High for precise recognition but fewer positions, Low for more positions with slightly less accuracy.
Enable 'Prevent New Entry on Opposite Signal While In Position' to avoid new trades if the opposite signal occurs.
Switch to Indicator Mode if solely using the strategy as an indicator or in combination with other strategies.
2. Pattern and Pivot Configuration:
Consider configuring the Number of Patterns and Pivot Lookback Lengths. Here, you can personalize the pivot lookback lengths for wedge, triangle, and channel patterns across eight different settings on your chart. For lower time frames, consider larger lengths to reduce chart noise. Alternatively, to maintain clarity on your chart, you can disable multiple patterns with different lengths while ensuring at least one pattern remains enabled.
Note that enabling more patterns doesn't always equate to increased potential profit. Sometimes, fewer patterns result in greater profit potential, and vice versa. Experiment with lengths and the number of patterns to determine the most profitable and optimal outcome for your trading symbol and timeframe.
3. Targeting System Selection:
Choose between 'Fixed Targets' or 'Trailing Targets' for your targeting system.
'Fixed Targets' is the default setting, operational when 'Trailing Targets' are turned off.
Set the TP1 Position Size as a percentage, defining the size for TP1, and the rest exits at TP2.
Optionally activate 'Skip Entry if TP1 is Passed' to bypass entering positions if the price has exceeded TP1.
Alternatively, opt for the 'Trailing Target' for dynamic exits based on trigger points and offsets. Note that this option disables fixed targets.
4. Stop Loss Configuration:
Determine the number of candles to consider for stop loss placement based on the last pivot.
Optionally add a percentage to the stop loss to create a buffer against market fluctuations, guarding your positions from sudden price swings.
5. Risk Management Configuration:
You can activate the 'Risk-Free' feature, making your trades risk-free by moving the stop loss to the entry price upon reaching a specified trigger point.
You have the possibility to enable 'Fixed Loss Position Sizing' to limit risk to a percentage of total capital per trade, ensuring prudent risk management.
You can employ 'Use Real-Time Balance for Each Entry' to precisely calculate fixed loss position sizing according to the real-time balance for every entry.
The 'Loss Compensation' feature can be activated to automatically adjust trade sizes during consecutive losses and compensate for prior incurred losses.
Loss compensation continues adjusting trade sizes until it reaches the defined limit of consecutive losses specified in the 'Maximum Consecutive Losses To Compensate' field.
You can factor in commission fees by specifying a percentage in the 'Include Trading Fees in Compensation (%)' field, providing an option for more accurate loss compensation calculations.
You have the option to enable 'Limit Compensation to Real-Time Balance' to prevent consecutive loss compensation from exceeding your current real-time account balance.
It's important to note that for the 'Loss Compensation' feature to operate, the 'Fixed Loss Position Sizing' must be enabled.
6. Counter-Pattern Breakout Configuration:
In this section you have the option to enable the "Counter-Pattern Breakout" feature to adjust the strategy's approach to wedge, triangle, and channel pattern breakouts. Once enabled, the strategy disregards traditional pattern signals and capitalizes on breakouts from either the upper or lower lines, initiating corresponding positions accordingly.
Choose between 'Fixed Target' or 'Trailing Target' for your targeting system. If you opt for the 'Fixed Target', set a specific target point as a percentage, serving as the default target for counter-pattern breakouts. Alternatively, choose the 'Trailing Target' for dynamic exits based on trigger points and offsets. Do keep in mind that selecting the 'Trailing Target' option disables the fixed target setting.
Keep in mind that for standard, non-counter-pattern breakouts, the target point settings in their respective sections remain applicable, distinct from the settings configured for targeting within this section.
Note that the stop loss configurations are shared across standard pattern and counter-pattern breakouts and can be adjusted within the stop loss section.
7. Info Tables:
In the info tables section, you can show or hide different tables on the charts. This includes the backtest table, the current balance table displaying available funds, and a table showcasing Maximum Consecutive Wins or Losses. Choose which to display according to your preferences and specific needs.
8.Date & Time Range Filter:
Utilize the Date & Time Range filter feature to precisely select a start and end date, including time, to filter data within the chosen range.
When connecting this strategy to a trading bot for automated trades, ensure to set the start date and time to the intended initiation moment to avoid undesired outcomes as this directly affects the real-time balance calculations of the strategy.
8. Integration with Third-Party Bots:
To automate trading, leverage the strategy's compatibility with third-party trading bots. Seamlessly integrate the strategy into well-known trading platforms by using alert message fields to input commands from third-party trading bots, enabling automated trade execution for both long and short positions.
By furnishing these adjustable settings, the strategy empowers you to personalize it according to your unique requirements, thereby bolstering the adaptability and efficacy of your trading approach.
🔐 Source Code Protection:
The 'Price Action Pattern Breakout Strategy: Wedge, Triangle, Channel' source code is engineered for precision, reliability, and effectiveness. Its original and innovative design warrants protection and restricted access, preserving the strategy's exclusivity. Safeguarding the code maintains the strategy's integrity and distinctiveness, providing users with a competitive advantage in their trading endeavors.

VWAP with CharacterizationThis indicator is a visual representation of the VWAP (Volume Weighted Average Price), it calculates the weighted average price based on trading volume. Essentially, it provides a measure of the average price at which an asset has traded during a given period, but with a particular focus on trading volume. In our case, the indicator calculates the VWAP for the current trading symbol, using a predefined simple moving average (SMA) with a period of 14. This volume-weighted moving average offers a clearer view of the behavior of the VWAP and, of consequence of market dynamics.
One of the distinctive features of this indicator is its ability to provide a more "linear" representation of the data. This means that the data is "smoothed" to remove noise, allowing you to more easily identify the direction of the market trend. This smoother representation is especially useful because the financial market can be subject to significant fluctuations and volatility, and this indicator can help get a more stable view of the trend.
The indicator also offers a visualization of the market trend in a very intuitive way. Using an evaluation of the highs and lows of the last 10 days, determine whether the market is in an uptrend, downtrend, or no trend at all. To make this evaluation even clearer and more immediate, the indicator line is colored dynamically. When the trend is bullish, the line is blue, while in case of a bearish trend, it takes on a distinctive color, such as pink. If the trend is not defined, the line will be colored differently, for example light yellow. This coloration gives traders an immediate visual indication of the prevailing trend, allowing them to make more informed decisions regarding trading operations.
One potential strategy involves watching candles when they cross the VWAP line strongly. If, for example, a candlestick breaks above the VWAP line, we may look for retest areas near key support levels to gauge a potential long entry. In other words, we would consider that the price may have the potential to rise further after breaking above the VWAP line, and we would look to enter a long position to take advantage of this opportunity.
On the other hand, if a candlestick crosses below the VWAP line, we might consider looking for retest areas near the VWAP line itself, which now serves as potential resistance. This could indicate a possible short entry opportunity, as the price may struggle to break above the resistance represented by the VWAP line after breaking it down. In this case, we would look to take advantage of the expected continuation of the downtrend.
In both cases, the idea is to exploit significant movements across the VWAP line as signals of potential reversal or continuation of the trend. This strategy can help identify key entry points based on price behavior relative to the VWAP line.

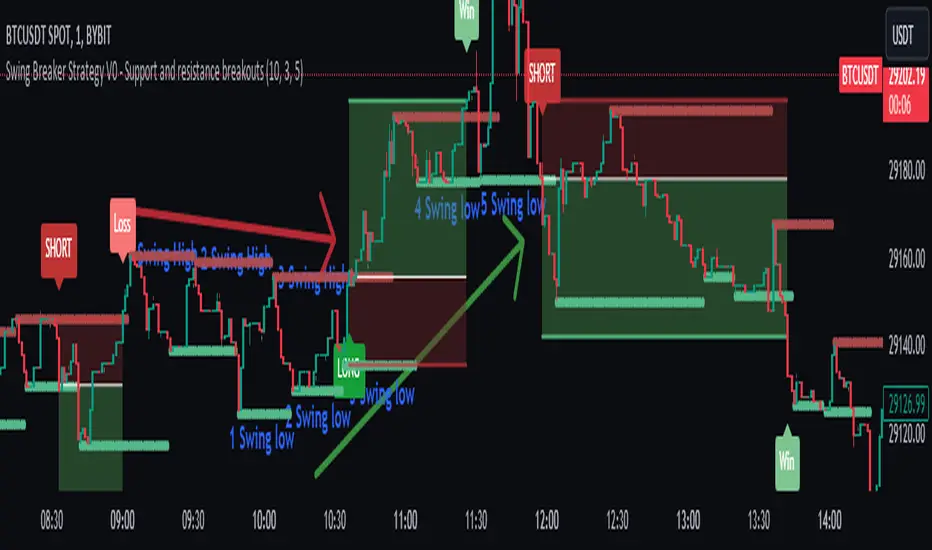
Swing Breaker Strategy [v0.1] - Support and resistance breakoutSwing Breaker Strategy - Support and Resistance Breakouts
This strategy has no repainting.
Default settings:
Swing Barsback: 10
Number of Swings: 3
Stoploss Candles Lookback: 5
Why these default settings?
This strategy has been backtested with over 100 trades, and on a larger scale of 1000 trades, it has reported a 1.33 profit factor with a maximum 5% cumulative drawdown, using no leverage. In this backtest, the settings (10,3,5) were used, becoming the default settings as they are more adaptable to different market conditions.
How does this strategy work?
Defining swing lows (support) and swing highs (resistance): We can locate these candles by looking at a symmetrical candle unit around them. For example, the default settings present a 10 swing bars back, which means there is no superior level within a 10-candle radius in the case of a swing high, and the opposite for a swing low. Swings are located a few candles after, just the number of swing bars back (width), because it is needed to ensure it is a swing.
Locating trends: We locate trends by looking at consecutive swings. For example, in the default settings, to determine a bullish trend, we need 3 consecutive ascending swing lows; for a bearish trend, 3 consecutive descending swing highs. You can find this parameter in settings as "Number of swings."
When a trend is formed, a stop entry is placed at the last swing until it is broken.
Just after the entry, the stop is placed at the lowest (in the case of a long) or the highest (in the case of a short) of the last candles. You can define that number in the settings as "Stoploss candles lookback," which default is 5. The take profit is placed at 2 times the stop value, resulting in a 2 risk-reward ratio.
Why is this strategy protected?
No other strategy combines the way of locating swings and turning it into a strategy, including customizable parameters such as stop loss, swing width and introducing the number of swings. That's why we decided to protect it.
Stocashi + CaffeineCrush Momentum Indicator by CoffeeShopCryptoThis is just a fun script to give a different representation to the ever popular Stochastic RSI
Even for me over the years the stochastic has been a difficult one to use in trading merely because of its choppy look.
Since Heikin-Ashi Candles do such a powerful job in smoothing out the look of choppy markets,
I decided to test it out on the look of the Stochastic RSI.
From an initial visual standpoint it worked out WAY better than I thought but it seemed to need something more.
I decided to use the PineScript "Color.From_Gradient" feature to give the Stochastic a more 3 dimensional look, which really brought the "old-school" indicator to life.
Description:
The CaffeineCrush Momentum Indicator is your ultimate trading companion, blending the invigorating world of coffee with the excitement of market momentum. Just like a finely brewed cup of joe,
This indicator provides you with a powerful insight into market dynamics, helping you stay in the trading groove.
As you sip on this caffeinated delight, CaffeineCrush monitors the velocity and strength of price movements,
measuring the momentum of the market. But here's where it gets even more enticing – it goes a step further by incorporating a pressure indication, adding a stimulating twist to your trading experience.
Imagine yourself in a bustling coffee shop, surrounded by the aroma of freshly roasted beans and the energetic buzz of conversations.
CaffeineCrush mimics that atmosphere, keeping you on your toes, always aware of market forces at play.
With CaffeineCrush, you'll never miss a beat. It identifies and highlights moments of heightened momentum and increased pressure,
giving you an edge in capturing profitable opportunities. Just like a perfectly extracted espresso shot, this indicator helps you maintain your trading momentum and navigate the market with confidence.
So, grab your favorite cup of joe, fire up your trading charts, and let CaffeineCrush awaken your trading prowess.
Stay in the groove, embrace the buzz, and master the momentum with this flavorful indicator by your side.
Divergence -
Regular Divergence shows when there is a conflict between the strength of the trend and the swing of the price movement.
Hidden Divergence -
Are to be traded using the same methods as hidden divergences of the MACD or the RSI. A hidden divergence is commonly a trend CONTINUATION move.
Pink Pause -
This shows a ranging area where price is taking a pause. It can be a single candle or a string of candles. But histogram with continue with its RED / GREEN colors once the pause is over.
Stocashi + CaffeineCrush is not an entry / exit indicator. It's designed to help you understand:
1. Weather your trend is continuing
2. When it pauses
3. Has your pullback started / ended
Its best used near area of conflict. For example:
1. If you have a breakout to the low side of support zone, and you get a BULLISH divergence, this can be viewed as a false breakout.
2. If you trading towards the opposite area of a range or key level and you get conflicting movement in the Stocashi + CaffeineCrush, then you should take ur profits and wait for the next move.
3. If you are following through with example 2 above, but get NO conflicts, you can immediately look for a secondary take profit area and split / hedge your take profits.
