Sector ETF macro trendThe Sector ETF Macro Trend indicator is designed for technical analysis of broad economic trends through sector-specific exchange-traded funds (ETFs). It uses logarithmic price transformation, linear regression, and volatility analysis to examine sector trends and stability, providing a technical basis for analytical assessment.
Core Analysis Techniques
Logarithmic Transformation and Regression: Converts ETF closing prices logarithmically to reveal sector growth patterns and dynamics. Linear regression on these prices defines the main trend direction, essential for trend analysis.
Volatility Bands for Market State Assessment: Applies standard deviation on logarithmic prices to create dynamic bands around the trendline, identifying overbought or oversold sector conditions by marking deviations from the central trend.
Sector-Specific Analysis: Selection among different sector ETFs allows for precise examination of sectors like technology, healthcare, and financials, enabling focused insights into specific market segments.
Adaptability and Insight
Customizable Parameters: Offers flexibility in modifying regression length and smoothing factors to accommodate various analysis strategies and risk preferences.
Trend Direction and Momentum: Evaluates the ETF's trajectory against historical data and volatility bands to determine sector trend strength and direction, aiding in the prediction of market shifts.
Strategic Application
Without providing explicit trading signals, the indicator focuses on trend and volatility analysis for a strategic view on sector investments. It supports:
Identifying macroeconomic trends through ETF performance analysis.
Informing portfolio decisions with insights into sector momentum and stability.
Forecasting market movements by analyzing overbought or oversold conditions against the ETF price movement and volatility bands.
The Sector ETF Macro Trend indicator serves as a technical tool for analyzing sector-level market trends, offering detailed insights into the dynamics of economic sectors for thorough market analysis.
在腳本中搜尋"trendline"

Institutional Supply and Demand ZonesThis indicator aims to identify price levels where institutional investors have positioned their buy or sell orders. These buy orders establish "demand zones," while sell orders create "supply zones." Identifying these zones enables us to anticipate potential reversals in price trends, allowing us to profitably engage in these significant market movements alongside major institutions. These zones are formed when price action goes from balanced to imbalanced. These zones are based on orders. Unlike standard support and resistance levels, when price breaks below a demand zone or above a supply zone, these zones disappear from the chart.
Supply is formed by a green candle followed by a major red candle that is at least double the size of previous green candle. The zone is then charted from the open of the green candle to the highest point in the candle. Vice versa for a demand zone (red into green).
These zones are traded by:
1. Look for a volume spike in a zone
2. A trend/trendline break out of the zone

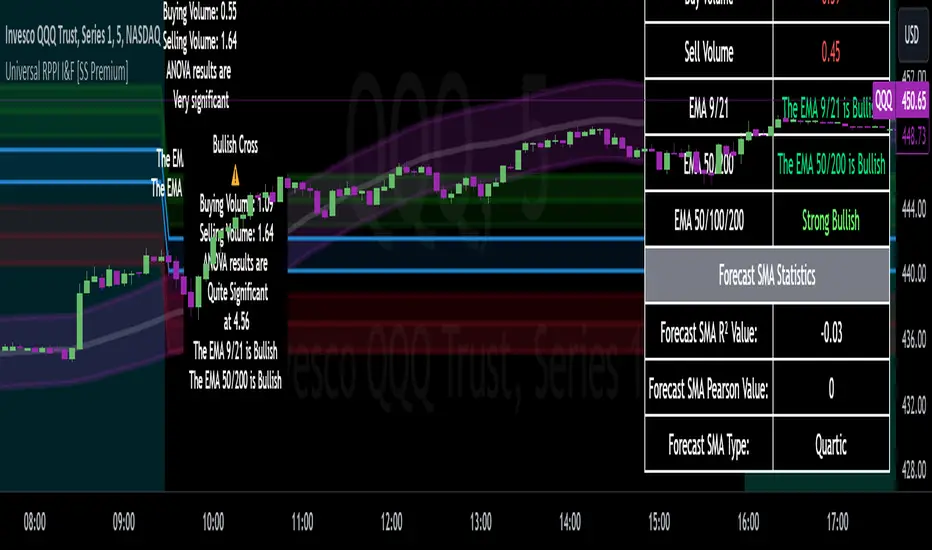
Universal RPPI Indices & Futures [SS Premium]Hello everyone,
For the much-anticipated indicator release, the universal RPPI for Futures and Indices!
If you follow me, chances are you know this indicator by now, since its the basis of all of my analyses and target prices, but if not, let me introduce you!
What is it?
The RPPI for Indices & Futures is essentially a compendium indicator. It contains hundreds of, just over 100 different math models of various futures and indices.
These models are designed to forecast the current targets on multiple timeframes including:
1. The daily
2. The weekly
3. The monthly
4. The Three Month (for SPY and QQQ ONLY)
5. The 6 Month (for DJI, SPX and USOIL/CLI1! ONLY)
6. The annual (for DJI, SPX and USOIL/CLI1! ONLY)
7. The 3 hour
So I will go over the details of the models within the indicators compendium and how they are produced. If you are not interested, just skip to the next section!
What is a model and how is it produced?
Models are math equations and frameworks that attempt to predict future behavior. They are developed in many ways and through many methods. In this particular indicator, each index and future is unique and has been created in various ways, such as using principles of data smoothing, data interpolation, data substitution and data omission.
All this means is, I have manually adjusted model parameters to correct for rare, outlier events. The outcome is having a more accurate model that is better prepared to predict what you want it to predict.
Now let's get into the indicator use.
The first thing we need to talk about is selecting a model type. Different model types are available on a handful of stocks in the indicator, such as SPY, QQQ, DJI and DIA, and so it is important to explain the difference.
Corrected vs Uncorrected Models (i.e. Low Precision vs High Precision Models)
In the settings menu, you will see the second option that reads "Precision". This is where you have the ability to select the model type.
"High Precision" is a corrected model. It is a model that I have used data manipulation for (like the examples above) to enhance its accuracy.
"Low Precision" is a UNCORRECTED model. These models have undergone no data manipulation and are just raw projections.
Which do you use?
There are only a handful of tickers that have both models, like SPY, GLD1! and DJI (among others). Some tickers perform better with low precision models, others perform better with high precision models.
To know what model works best with which stock, the indicator will tell you. At the bottom of the settings table, simply select "Show Model Data":
Selecting this, you will get a table that looks like this:
It will tell you the available model types and which one works best. For IWM, the high-precision corrected model is best. This is true for QQQ and NQ1! as well. However, for SPY and ES1!, the uncorrected model is actually better:
Sometimes, different models perform better at various levels of precision, for example, high on the monthly but low on the daily.
This is why I have omitted this option for the majority of stocks. I don't want this to be confusing to use. For 90% of the included tickers, I have selected the model of best fit. However, for a few of the very popular and volatile tickers (ES, NQ specifically), I have included the ability to use both.
Rule of Thumb:
The rule of thumb with selecting high vs low, is essentially this:
a) If the market is hugely volatility with major swings intraday that exceed its normal behaviour, switch to the low precesion model. This will not be skewed by the massive swings.
b) If the market is stable, trendy or range bound, but not trending beyond its normal, general behaviour, keep it at high precision.
With that, you will be good to go!
Using the indicator:
The indicator is intended as a standalone indicator. Of course, you can combine other indicators that you like to help you out, but there is a strategy version of this that will be released within the coming days/weeks, as this is intended to be a full strategy in and of itself.
As with the universal forecaster, you are given threshold levels that are labelled "Bullish Condition" and "Bearish Condition", a break and hold of the "Bullish Condition" and it is a long to the high targets. Inverse for the bearish condition.
In addition to these conditionals, the indicator also provides you with a high probability retracement level. These are available on the weekly, monthly and higher timeframes. A special moving retracement level is available for SPY only, however it moves based on the PA to give you a sort of POC.
Testing Model Performance:
It is possible to see model performance. At the bottom of the settings menu, select the option to "Show Demographic Data". You need to be sure you are on the chart of the selected timeframe.
This is ES1! on the daily timeframe. It shows you the demographics, i.e. the extent targets are hit, the extent that the high prob retracement targets are missed, the extent that ES closes in and out of its daily range.
This is very valuable information. This table is essentially saying there is only a 10% chance that ES will close above its range and a 9% chance ES closes below its range. This means, that the most ideal setups are a move outside of its range!!
You can view it on all timeframes. If your chart isn't aligned with the lookback, you will get a warning sign:
Misc Functions:
Show price accumulation:
There is an option to toggle on price accumulation. It will show you the amount of accumulation in each of the ranges:
This will show where the accumulation of price rests in relation to the targets.
Autoregression Assessment:
You can have the indicator plot an autoregressive trendline of the expected stock trajectory. You can select the forecast length and it will plot the direction it suspects the stock will go:
Show Standard Deviation:
In the menu, you can toggle on the show standard deviation function. This will plot the standard deviation that each price rests at. The default timeframe for standard deviation is the daily. If you are looking at the weekly, please select the weekly timeframe.
This is helpful because you can see which targets are likely based on where the standard deviation rests. In the above example, a move to the low range would be a move to -2 standard deviations and beyond. This is not something that a ticker would normally do in general circumstances.
FAQ Table:
There is also an option to display an FAQ table. This will show you model revisions and pending revision dates. This will allow you to see when each model was last updated and when new updates will be pushed:
Which models does this contain?
The indicator contains models for the following stocks:
SPY
QQQ
DIA
DJI
ES1!
SPX
NQ1!
NDX
SOXX
IWM
RTY
GCL1! (Gold)
CL1! / USOIL (Oil)
XLE
XLF
YM1!
And some more are in the works (like JETS).
NOTE: Feel free to leave a comment of future ones you would like to see!
The indicator will automatically select the model for whichever ticker you are on.
Some models are cross-compatible, such as CL1! and USOIL, but the indicator is programmed to recognize those that are cross-compatible and auto-select those models.
From there, you just need to select the timeframe you wish to view!
And that is the indicator! I know very wordy explanation but wanted to cover all basis on the indicator so you can be well prepared!
As always, leave your questions, and comments below, and safe trades!
lib_mathLibrary "lib_math"
a collection of functions calculating without history operator to avoid max_bars_back errors
mean(value, reset)
Parameters:
value (float) : series to track
reset (bool) : flag to reset tracking
@return returns average/mean of value since last reset
vwap(value, reset)
Parameters:
value (float) : series to track
reset (bool) : flag to reset tracking
@return returns vwap of value and volume since last reset
variance(value, reset)
Parameters:
value (float) : series to track
reset (bool) : flag to reset tracking
@return returns variance of value since last reset
trend(value, reset)
Parameters:
value (float) : series to track
reset (bool) : flag to reset tracking
@return where slope is the trend direction, correlation is a measurement for how well the values fit to the trendline (positive means ), stddev is how far the values deviate from the trend, x1 would be the time where reset is true and x2 would be the current time

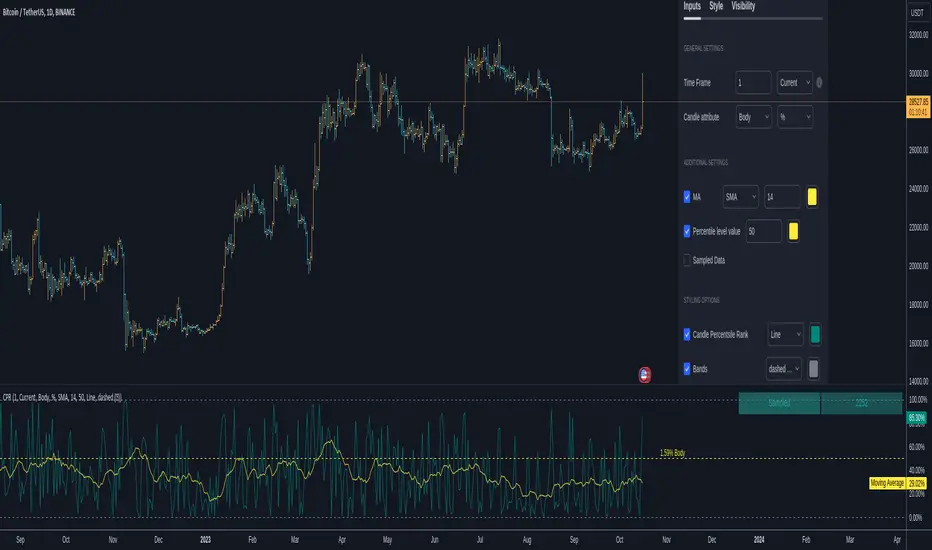
Candlestick Percentile RankCANDLESTICK PERCENTILE RANK
█ OVERVIEW
This script is designed to sample all available candles within a chosen time frame and provide a candlestick percentile rank to each candle. This script works by measuring a candle's body or its low to high value to the upside, or to the downside in percentage or in dollar value. Once the candle is measured its given a value based on all the previous measurements. You will be able to know if a body ( or a full candle/bar ) is above, or below a certain percentile level. By doing this you're effectively going to know if a candle is under performing or under-performing compared to the chart's history.
Example : A candle that did a 30% move vs another did a 10% and a third did a 5%. Here we 3 candles. The one that did a 30% is going to be ranked at 100 because it's the highest while the 5% candle ranks at 0 and the 10% candles ranks at 50. you see how this works. Having a candle in the 90th percentile means at that time it scored better than 90% of the preceding candles based on its move ( in dollar or percentage ).
So imagine you have an organic move of an up trend, ideally and what you want to see is this ; a candle with a low rank followed by one that's higher, followed by one that's also higher until the trend stops and you see a pin bar or whatever topping candle. You expect to see a rank going from low value to high value to suddenly sharply decrease to low value.
Constant low values may indicate lower volatility or time to change. For example, a doji candle will create a very low percentile rank value ( body-wise ). A high percentile rank value means high volatility on body and full candle calculations.
^ This is only one use of it.
A trendline may also form with a breakout points and information about the trend of the volatility of recent candles. Moving averages when applied to these calculations and to the percentile ranks can absolutely help in making these trends a bit smoother which is why you can add them to the graph. if you wish.
This script can be used in multiple ways including as a measure of volatility. or for statistical purposes. If I know the 50th percentile of a candle value I can know a very critical information about an asset's behavior and how volatile it is compared to another. There are many questions that can be answered using this script. How many times has this asset printed a candle of x% in the past y amount of time and how often does that happen. Is this candle or that truly rare ?
This script also has an option to highlight a specific percentile level showing its value. You can also see the number of sampled candles for clarity on the reliability of the data.
In conclusion, candlesticks effect each others. The whole candlestick/bars patterns is based on this. The percentile Rank is an effective way to observe and study these effects. The percentile rank shows you how on a measuring stick from 0 to 100 how a candle ( body or full low-high ) ranks compared to other candles in the past based on dollar value or percentage value. There are many untapped usages of the percentile rank when applied to candlesticks calculations and I hope this script can help you with this. If one can study the behavior of an asset and its bars percentile ranks they can unlock some probabilistic advantages.
█ Future Plans and upgrades to this script may include :
1. Count the times a percentile level is hit.
2. Display details about the highest/lowest levels.
and more! feel free to let me know what you'd like to see!
█ How to use :
1. Put the script on your chart
2. Navigate to the settings
give the script a few seconds and you should be set.
[AIO] Multi Collection Moving Averages 140 MA TypesAll In One Multi Collection Moving Averages.
Since signing up 2 years ago, I have been collecting various Сollections.
I decided to get it into a decent shape and make it one of the biggest collections on TV, and maybe the entire internet.
And now I'm sharing my collection with you.
140 Different Types of Moving Averages are waiting for you.
Specifically :
"
AARMA | Adaptive Autonomous Recursive Moving Average
ADMA | Adjusted Moving Average
ADXMA | Average Directional Moving Average
ADXVMA | Average Directional Volatility Moving Average
AHMA | Ahrens Moving Average
ALF | Ehler Adaptive Laguerre Filter
ALMA | Arnaud Legoux Moving Average
ALSMA | Adaptive Least Squares
ALXMA | Alexander Moving Average
AMA | Adaptive Moving Average
ARI | Unknown
ARSI | Adaptive RSI Moving Average
AUF | Auto Filter
AUTL | Auto-Line
BAMA | Bryant Adaptive Moving Average
BFMA | Blackman Filter Moving Average
CMA | Corrected Moving Average
CORMA | Correlation Moving Average
COVEMA | Coefficient of Variation Weighted Exponential Moving Average
COVNA | Coefficient of Variation Weighted Moving Average
CTI | Coral Trend Indicator
DEC | Ehlers Simple Decycler
DEMA | Double EMA Moving Average
DEVS | Ehlers - Deviation Scaled Moving Average
DONEMA | Donchian Extremum Moving Average
DONMA | Donchian Moving Average
DSEMA | Double Smoothed Exponential Moving Average
DSWF | Damped Sine Wave Weighted Filter
DWMA | Double Weighted Moving Average
E2PBF | Ehlers 2-Pole Butterworth Filter
E2SSF | Ehlers 2-Pole Super Smoother Filter
E3PBF | Ehlers 3-Pole Butterworth Filter
E3SSF | Ehlers 3-Pole Super Smoother Filter
EDMA | Exponentially Deviating Moving Average (MZ EDMA)
EDSMA | Ehlers Dynamic Smoothed Moving Average
EEO | Ehlers Modified Elliptic Filter Optimum
EFRAMA | Ehlers Modified Fractal Adaptive Moving Average
EHMA | Exponential Hull Moving Average
EIT | Ehlers Instantaneous Trendline
ELF | Ehler Laguerre filter
EMA | Exponential Moving Average
EMARSI | EMARSI
EPF | Edge Preserving Filter
EPMA | End Point Moving Average
EREA | Ehlers Reverse Exponential Moving Average
ESSF | Ehlers Super Smoother Filter 2-pole
ETMA | Exponential Triangular Moving Average
EVMA | Elastic Volume Weighted Moving Average
FAMA | Following Adaptive Moving Average
FEMA | Fast Exponential Moving Average
FIBWMA | Fibonacci Weighted Moving Average
FLSMA | Fisher Least Squares Moving Average
FRAMA | Ehlers - Fractal Adaptive Moving Average
FX | Fibonacci X Level
GAUS | Ehlers - Gaussian Filter
GHL | Gann High Low
GMA | Gaussian Moving Average
GMMA | Geometric Mean Moving Average
HCF | Hybrid Convolution Filter
HEMA | Holt Exponential Moving Average
HKAMA | Hilbert based Kaufman Adaptive Moving Average
HMA | Harmonic Moving Average
HSMA | Hirashima Sugita Moving Average
HULL | Hull Moving Average
HULLT | Hull Triple Moving Average
HWMA | Henderson Weighted Moving Average
IE2 | Early T3 by Tim Tilson
IIRF | Infinite Impulse Response Filter
ILRS | Integral of Linear Regression Slope
JMA | Jurik Moving Average
KA | Unknown
KAMA | Kaufman Adaptive Moving Average & Apirine Adaptive MA
KIJUN | KIJUN
KIJUN2 | Kijun v2
LAG | Ehlers - Laguerre Filter
LCLSMA | 1LC-LSMA (1 line code lsma with 3 functions)
LEMA | Leader Exponential Moving Average
LLMA | Low-Lag Moving Average
LMA | Leo Moving Average
LP | Unknown
LRL | Linear Regression Line
LSMA | Least Squares Moving Average / Linear Regression Curve
LTB | Unknown
LWMA | Linear Weighted Moving Average
MAMA | MAMA - MESA Adaptive Moving Average
MAVW | Mavilim Weighted Moving Average
MCGD | McGinley Dynamic Moving Average
MF | Modular Filter
MID | Median Moving Average / Percentile Nearest Rank
MNMA | McNicholl Moving Average
MTMA | Unknown
MVSMA | Minimum Variance SMA
NLMA | Non-lag Moving Average
NWMA | Dürschner 3rd Generation Moving Average (New WMA)
PKF | Parametric Kalman Filter
PWMA | Parabolic Weighted Moving Average
QEMA | Quadruple Exponential Moving Average
QMA | Quick Moving Average
REMA | Regularized Exponential Moving Average
REPMA | Repulsion Moving Average
RGEMA | Range Exponential Moving Average
RMA | Welles Wilders Smoothing Moving Average
RMF | Recursive Median Filter
RMTA | Recursive Moving Trend Average
RSMA | Relative Strength Moving Average - based on RSI
RSRMA | Right Sided Ricker MA
RWMA | Regressively Weighted Moving Average
SAMA | Slope Adaptive Moving Average
SFMA | Smoother Filter Moving Average
SMA | Simple Moving Average
SSB | Senkou Span B
SSF | Ehlers - Super Smoother Filter P2
SSMA | Super Smooth Moving Average
STMA | Unknown
SWMA | Self-Weighted Moving Average
SW_MA | Sine-Weighted Moving Average
TEMA | Triple Exponential Moving Average
THMA | Triple Exponential Hull Moving Average
TL | Unknown
TMA | Triangular Moving Average
TPBF | Three-pole Ehlers Butterworth
TRAMA | Trend Regularity Adaptive Moving Average
TSF | True Strength Force
TT3 | Tilson (3rd Degree) Moving Average
VAMA | Volatility Adjusted Moving Average
VAMAF | Volume Adjusted Moving Average Function
VAR | Vector Autoregression Moving Average
VBMA | Variable Moving Average
VHMA | Vertical Horizontal Moving Average
VIDYA | Variable Index Dynamic Average
VMA | Volume Moving Average
VSO | Unknown
VWMA | Volume Weighted Moving Average
WCD | Unknown
WMA | Weighted Moving Average
XEMA | Optimized Exponential Moving Average
ZEMA | Zero Lag Moving Average
ZLDEMA | Zero-Lag Double Exponential Moving Average
ZLEMA | Ehlers - Zero Lag Exponential Moving Average
ZLTEMA | Zero-Lag Triple Exponential Moving Average
ZSMA | Zero-Lag Simple Moving Average
"
Don't forget that you can use any Moving Average not only for the chart but also for any of your indicators without affecting the code as in my example.
But remember that some MAs are not designed to work with anything other than a chart.
All MA and Code lists are sorted strictly alphabetically by short name (A-Z).
Each MA has its own number (ID) by which you can display the Moving Average you need.
Next to the ID selection there are tooltips with short names and their numbers. Use them.
The panel below will help you to read the Name of the selected MA.
Because of the size of the collection I think this is the optimal and most convenient use. Correct me if this is not the case.
Unknown - Some MAs I collected so long ago that I lost the full real name and couldn't find the authors. If you recognize them, please let me know.
I have deliberately simplified all MAs to input just Source and Length.
Because the collection is so large, it would be quite inconvenient and difficult to customize all MA functions (multipliers, offset, etc.).
If you need or like any MA you will still have to take it from my collection for your code.
I tried to leave the basic MA settings inside function in first strings.
I have tried to list most of the authors, but since the bulk of the collection was created a long time ago and was not intended for public publication I could not find all of them.
Some of the features were created from scratch or may have been slightly modified, so please be careful.
If you would like to improve this collection, please write to me in PM.
Also Credits, Likes, Awards, Loves and Thanks to :
@alexgrover
@allanster
@andre_007
@auroagwei
@blackcat1402
@bsharpe
@cheatcountry
@CrackingCryptocurrency
@Duyck
@ErwinBeckers
@everget
@glaz
@gotbeatz26107
@HPotter
@io72signals
@JacobAmos
@JoshuaMcGowan
@KivancOzbilgic
@LazyBear
@loxx
@LuxAlgo
@MightyZinger
@nemozny
@NGBaltic
@peacefulLizard50262
@RicardoSantos
@StalexBot
@ThiagoSchmitz
@TradingView
— 𝐀𝐧𝐝 𝐎𝐭𝐡𝐞𝐫𝐬 !
So just a Big Thank You to everyone who has ever and anywhere shared their codes.

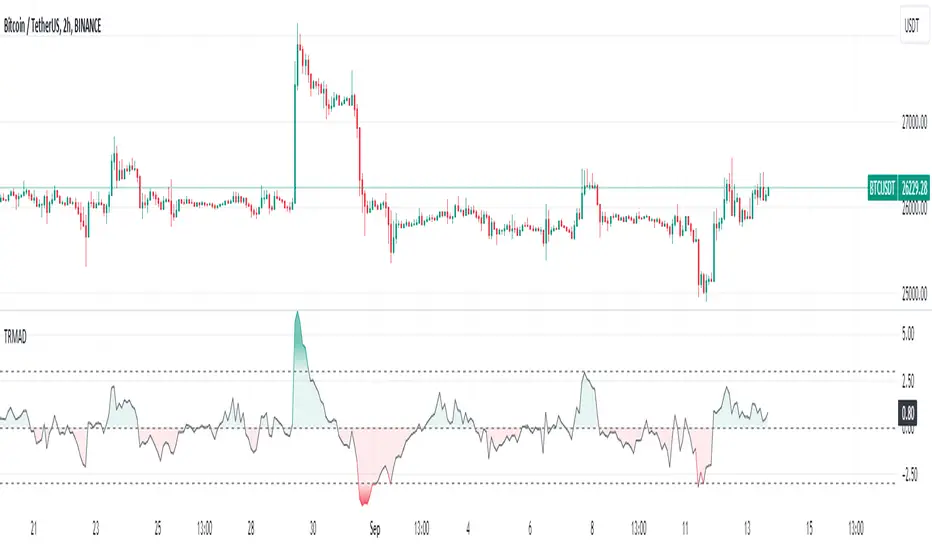
True Range Moving Average Deviation🔶 Overview
The True Range Moving Average Deviation Indicator (TRMAD) is a technical analysis tool that combines elements of price deviation, volatility, and overbought/oversold conditions.
🔶 Key Components
Current price (Close) : most recent closing price of the asset.
Moving Average (MA) : represents a smoothed trendline of the asset's closing prices over a specified period. By default, TRMAD uses the Simple Moving Average (SMA) with a 20-period setting.
Average True Range (ATR) : reflects the average price range between the high and low over a given time frame. By default, TRMAD uses a 14-period ATR setting with a Simple Moving Average (SMA) calculation. ATR quantifies the historical price volatility of the asset, which is crucial for normalizing the price deviation.
🔶 Calculation
(Close - MA) / ATR
🔶 Interpretation
When TRMAD is above +3 ATR , it is often considered an indication that the asset may be overbought, suggesting a potential reversal or correction to the downside.
When TRMAD is below -3 ATR , it is often considered an indication that the asset may be oversold, suggesting a potential reversal or bounce to the upside.
TRMAD values around 0 ATR may indicate a balanced market condition.
🔶 Usage
🔹 Overbought and Oversold Conditions:
TRMAD can help identify overbought and oversold conditions. When TRMAD reaches or exceeds certain user-defined thresholds (e.g., +3 ATR or -3 ATR), it can signal that the asset is in an extreme condition.
Traders can use these extreme conditions to adjust their positions or look for potential reversal opportunities.
🔹 Divergence Analysis:
Traders often analyze divergences between the TRMAD indicator and price movements. For example, if the price is making higher highs while TRMAD is making lower highs (bearish divergence), it could indicate a potential trend reversal.
🔹 Trend Confirmation:
TRMAD can be used in conjunction with other technical indicators to confirm trends. For example, if TRMAD is consistently positive during an uptrend, it can provide confirmation of the trend's strength.
Positive TRMAD : When TRMAD is positive but hasn't reached the overbought threshold (e.g., +3 ATR), it suggests that there is some bullish momentum, but traders may exercise caution and look for other confirming signals before considering a long position.
Negative TRMAD : When TRMAD is negative but hasn't reached the oversold threshold (e.g., -3 ATR), it suggests some bearish sentiment, but traders may want to seek additional confirmation before considering a short position.
🔹 Risk Management:
Traders can use TRMAD as part of their risk management strategy. For instance, if TRMAD suggests that an asset is overbought, a trader might consider tightening their stop-loss orders to manage potential downside risk.
🔶 Credits
The idea about this indicator came from Fabio Figueiredo (Vlad)
Gann swings [promuckaj]This indicator is a tool that could help the users what the market trend is at any time, based on legendary trader, Mr. William D. Gann .
Gann it self called this the “Trendline Indicator”, but modern traders call it Swing.
Gann’s primary use his techniques in correlation with this trading tool helping him achieve his phenomenal trading results.
Gann swings automatically displays the swing chart and trend on any timeframe you choose. There is option to set desired color and width of the trend line.
There is 3 types of settings to determine the swings, from 1 to 3 which represent the number of bars as confirmation for the swing bar. Default is 2.
There is labels on bars that gives information about each bar, is it up, down, inside or outside bar. This can be turned off/on.
🡱 - Up bar
🡳 - Down bar
⬍ - Outside bar
x - Inside bar
Indicator is also fully customizable to display break-out lines, which indicate potential trend changes ahead of time. There is option to choose whether you want to mark only first breaks in a row or you want all of them in case there is multiple ones in the same direction.
Gann swings is an indicator that EVERY trader and investor should have, it can provide vital information that can help to determine the trend of any market and information about the upswings and downswings.
Everyone enjoy trading !
P.S.:
I have in my mind some additional features as upgrade that can include data about each swing, like data for tops/bottoms date, time, price, range in % between swings, and bar count of each swing that is formed on the chart.

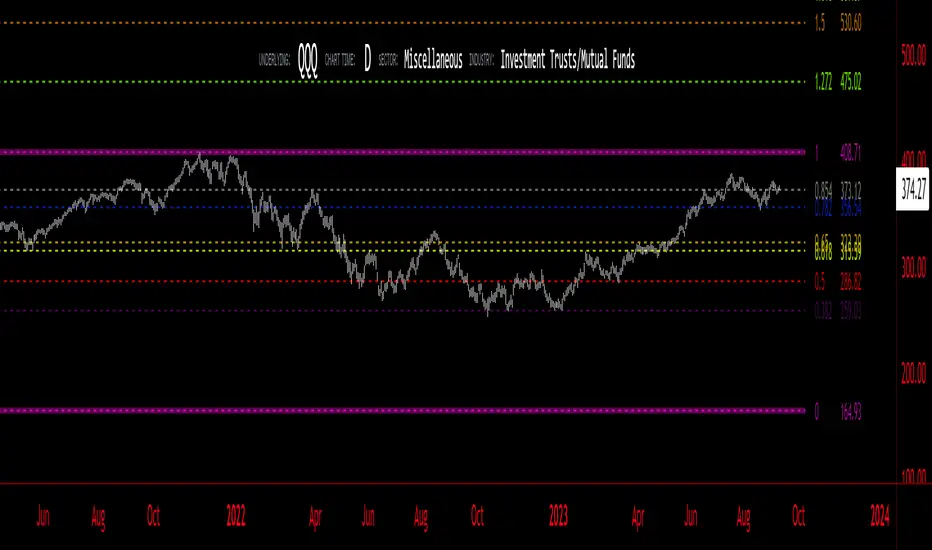
High/Low Fibs using Bullish Anchors I do Love me some fibs!!
i used a lot of 30 min Opening Range Fibs for interday trading, but have found that using more bars back can make for stronger levels just like when we use higher time frame to see support & resistant levels.
You can just find high and lows for making an easy auto draw fib retracment, I think you will find these to be fairly accurate or at least just entertaining .
Here are some basics on how to use FIb Retracments
Fibonacci retracement is a popular technical analysis tool used by traders to identify potential levels of support and resistance in financial markets, including stocks. It is based on the Fibonacci sequence, a series of numbers where each number is the sum of the two preceding ones (e.g., 0, 1, 1, 2, 3, 5, 8, 13, 21, ...). The key Fibonacci retracement levels are 23.6%, 38.2%, 50%, 61.8%, and 78.6%. These levels are used to identify potential reversal points or areas of price consolidation. Here's how to use Fibonacci retracement in stock trading:
1. Identify a Significant Price Move:
Start by identifying a significant price move in the stock you are analyzing. This move can be either an uptrend or a downtrend. For uptrends, you'll be measuring from the low point to the high point, and for downtrends, you'll measure from the high point to the low point.
2. Draw Fibonacci Levels: *With this indicator We do this for you
Once you have identified the price move, use a Fibonacci retracement tool available on most trading platforms to draw the retracement levels. Typically, you will draw lines from the low point to the high point for uptrends and vice versa for downtrends.
3. Analyze Key Levels:
Pay attention to the key Fibonacci retracement levels, especially the most commonly used ones, which are 38.2%, 50%, and 61.8%. These levels are considered significant in determining potential support and resistance areas. The 23.6% and 78.6% levels are also used but are considered secondary.
4. Look for Confluence:
Consider other technical analysis tools and indicators to look for confluence at these Fibonacci retracement levels. For example, if a 50% retracement level coincides with a moving average or a trendline, it may strengthen the level's significance.
5. Monitor Price Action:
Watch how the stock's price reacts when it approaches these Fibonacci retracement levels. If the price stalls, reverses direction, or shows signs of consolidation around a particular level, it may act as support or resistance.
6. Set Entry and Exit Points:
Based on your analysis, you can set entry and exit points for your trades. Traders often look for buying opportunities near Fibonacci support levels and selling opportunities near resistance levels. Stop-loss orders can be placed just below support or above resistance levels to manage risk.
7. Practice Risk Management:
Always use proper risk management techniques in your trading. This includes setting stop-loss orders, determining your position size, and not risking more than you can afford to lose on a single trade.
8. Monitor Market Conditions:
Be aware that Fibonacci retracement levels are not foolproof and should be used in conjunction with other analysis methods and market conditions. Market sentiment, news events, and economic factors can also influence stock prices.
9. Continuously Learn and Adapt:
As with any trading strategy, it's essential to continuously learn and adapt. Test the effectiveness of Fibonacci retracement levels on different time frames and with different stocks to refine your trading strategy.
** Special Thanks to @KioseffTrading for doing most all of the HEAVY LIFTING on the code here... he is beyond a Top G!!
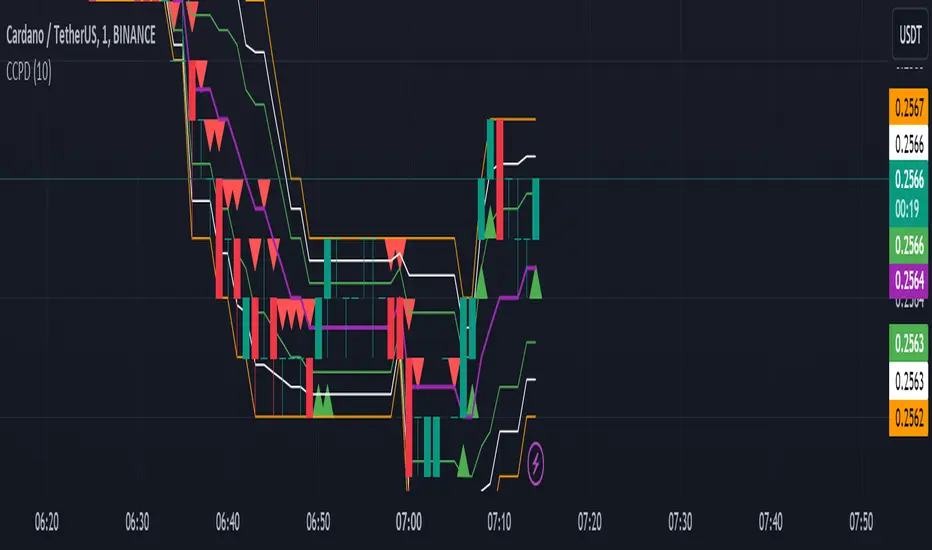
CCPD Candle Color Price DetectorThe "CCPD Candle Color Price Detector" is a custom indicator developed for TradingView, a popular platform for technical analysis and trading. This indicator assists traders in identifying potential trend reversals and assessing market sentiment based on candlestick color changes and key price levels.
This indicator operates as follows:
Color Change Detection: It primarily focuses on the color of candlesticks (green for bullish and red for bearish). When a candlestick closes higher than it opens, it is considered green (bullish), and when it closes lower, it is red (bearish).
High and Low Analysis: The indicator calculates the highest high and lowest low over a user-defined number of bars (specified by the 'Bars for High/Low' input parameter). This helps identify recent price extremes.
Midpoint Calculation: It then computes the midpoint between the highest high and lowest low, effectively determining a central reference point within the specified period.
Signal Generation: Buy and sell signals are generated based on the relationship between the current candlestick's close price, the midpoint, and the candlestick color. Buy signals occur when a green candle closes above the midpoint, suggesting potential bullish momentum. Conversely, sell signals trigger when a red candle closes below the midpoint, indicating possible bearish pressure.
Visualization: The indicator visualizes the highest high, lowest low, midpoint, and additional lines to aid in understanding the price action and potential reversal points.
Alerts: It provides alerts for buy and sell signals, allowing traders to receive notifications when potential trading opportunities arise.
Usage:
Traders can utilize the "CCPD Candle Color Price Detector" in the following ways:
Trend Reversal Identification: This indicator can help traders spot potential trend reversals by signaling when candlestick colors change and close near the midpoint. Buy and sell signals offer entry points for trades based on these reversals.
Confirmation Tool: It can be used in conjunction with other technical analysis tools to confirm trading decisions. For example, a buy signal from this indicator, coupled with a bullish trendline break or a bounce from a key support level, may provide a stronger bullish signal.
Risk Management: By understanding potential reversal points and using stop-loss orders, traders can better manage their risk and protect their capital when entering positions based on the indicator's signals.
Customization: The indicator allows users to adjust the number of bars for high/low calculations, making it adaptable to different trading strategies and timeframes.
In summary, the "CCPD Candle Color Price Detector" is a versatile indicator that can aid traders in spotting potential trend changes, enhancing trading decisions, and managing risk effectively. However, like any trading tool, it should be used in conjunction with other analysis methods and risk management strategies for optimal results.
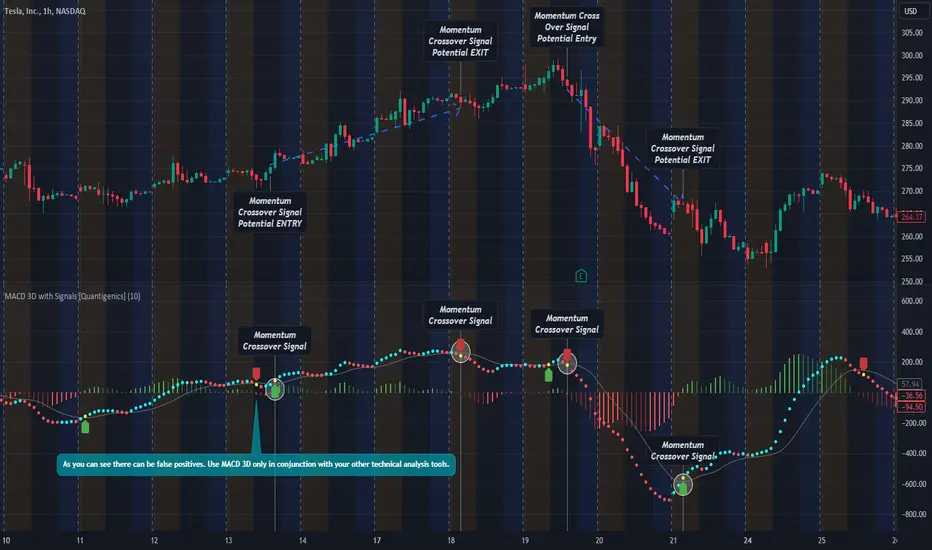
MACD 3D with Signals [Quantigenics]Quantigenics MACD 3D with Buy Sell Signals is a MACD-based trading indicator that aims to identify market trends and potential turning points, for Buy/Sell opportunities, by leveraging price data and volatility.
Unlike the traditional MACD indicator, the average price is calculated from the high, low, and close prices, from which a specialized MACD value is derived. This MACD value, combined with an average and standard deviation, takes into account volatility, and is used to generate an upper and lower boundary.
The indicator color-codes market trends: aqua indicates upward trends (signifying increased buying pressure), red suggests downward trends (increased selling pressure). When the MACD value crosses above the upper boundary or falls below the lower boundary, the color changes to yellow indicating a possible reversal point and "Momentum Crossover Signals" can be plotted at this point. "Standard Signal" arrows can also plotted when the MACD 3D changes from auqa to red and vice-versa.
A trendline is drawn at the median value, providing a baseline for comparison. A differential value, which measures the distance between the MACD value and the median line, provides additional insight into the price's deviation from this baseline (divergences from the underlying price can be spotted using this data as well). The differential is color-coded: green when MACD is above the median, and red when it's below, with darker shades representing a decreasing gap.
Alerts can be set to trigger with the "Standard Signal" arrows appearing after MACD 3D changes from auqa to red and vice-versa and when the "Momentum Crossover Signal" arrows appear when the MACD value crosses above the upper boundary or falls below the lower boundary indicating a potential reversal. Providing immediate notifications which can be especially helpful in larger time frames where it may take time for a trade setup to develop.
CME_MINI:NQ1!
OANDA:XAUUSD
Enjoy the MACD 3D indicator. Happy Trading!
Gradient Money Flow Divergence DetectorThe "Gradient Money Flow Divergence Detector" indicator has several use cases for traders. Let's explore the main use cases:
1. Money Flow Analysis : The primary purpose of this indicator is to analyze money flow in a particular asset. The Money Flow Index (MFI) is a momentum indicator that uses price and volume data to assess the buying and selling pressure in a market. Traders can use the MFI to identify overbought and oversold conditions, potential trend reversals, and divergences between the MFI and price movement.
2. Divergence Detection : The indicator incorporates a divergence detection mechanism for multiple timeframes (micro, sub-mid, mid, and macro). Divergence occurs when the price movement and an indicator (MFI in this case) move in opposite directions, signaling a potential shift in the price trend. Traders can use divergences to anticipate trend reversals or trend continuation.
3. Multiple Lookback Analysis : The indicator allows traders to assess divergences and money flow trends across various time horizons by providing divergence detection for different lengths. This can help traders identify confluence areas where divergences align on multiple timeframes, strengthening the potential signal.
4. Overbought and Oversold Conditions : The indicator plots horizontal lines at MFI levels of 20, 50, and 80. These levels can be used to identify overbought (MFI above 80) and oversold (MFI below 20) conditions. Traders may look for potential reversal signals when the MFI reaches extreme levels.
5. Confirmation of Price Trends : The indicator's color gradient visually represents the MFI value, which can help traders confirm the strength of a prevailing price trend. For example, an uptrend with a consistently high MFI might suggest strong buying pressure, reinforcing the bullish bias.
6. Fine-Tuning Divergence Signals : Traders can adjust the parameters of divergence detection (e.g., pivot points, rangeUpper, rangeLower) to fine-tune the sensitivity of the divergence signals. This allows for greater customization based on individual trading preferences.
7. Combining with Other Indicators : The indicator can be used in combination with other technical indicators or price action analysis to strengthen trading decisions. For example, traders may look for divergences in conjunction with support and resistance levels or chart patterns to increase the probability of successful trades.
8. Trend Reversal Confirmation : When a divergence is detected, it may indicate a potential trend reversal. Traders can use other confirmation signals (e.g., candlestick patterns, trendline breaks) to validate the reversal before making trading decisions.
Remember that no single indicator should be used in isolation, and it's essential to use the indicator in combination with other confirmations such as support and resistance, and analysis methods for more robust trading strategies. Additionally, thorough backtesting and practice in a demo environment are recommended before using the indicator in live trading.

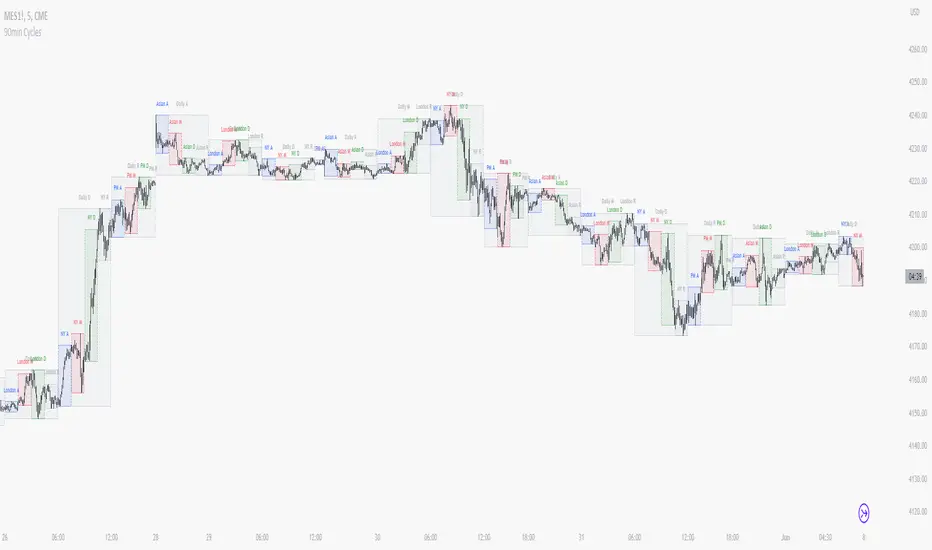
90 Minute Cycles + MTFCredit goes to LuxAlgo for the inspiration from 'Sessions' which allowed users to analyse specific price movements within a user defined period with tools such as trendline, mean and vwap.
Settings
Sessions
Enable Session: Allows to enable or disable all associated elements with a specific user set session.
Session Time: Opening and closing times of the user set session in the hh:mm format.
Range: Highlights the associated session range on the chart.
Ranges Settings
Range Area colour: Set each range to a specific colour.
Range Label: Shows the session label at the mid-point of the session interval.
Usage
By breaking 24hrs in quarters, starting with an Asian range of 18:00 NY time you can visualise the principles of Accumulation, Manipulation, Distribution and Rebalance. Know as AMD or PO3 (Power of Three), the principle is that the Manipulation phase will break above or below the Accumulation, before moving in an apposing direction and then rebalancing. This only works when there is a higher timeframe PD array or liquidity to support an apposing move.
Further to the daily quarters, each one can then be broken down again into 90min cycles. Again, each represents AMD, allowing the user an opportunity to watch for reversals during the 90min manipulation phase.
Note: Ensure the Asian Cycle always begins at 18:00 NY time.
The example shows that the 90min cycle occurs, followed by an apposing move away in price action
Here is the Daily cycle, highlighting the Manipulation phase.
Enjoy!
ICT Donchian Smart Money Structure (Expo)█ Concept Overview
The Inner Circle Trader (ICT) methodology is focused on understanding the actions and implications of the so-called "smart money" - large institutions and professional traders who often influence market movements. Key to this is the concept of market structure and how it can provide insights into potential price moves.
Over time, however, there has been a notable shift in how some traders interpret and apply this methodology. Initially, it was designed with a focus on the fractal nature of markets. Fractals are recurring patterns in price action that are self-similar across different time scales, providing a nuanced and dynamic understanding of market structure.
However, as the ICT methodology has grown in popularity, there has been a drift away from this fractal-based perspective. Instead, many traders have started to focus more on pivot points as their primary tool for understanding market structure.
Pivot points provide static levels of potential support and resistance. While they can be useful in some contexts, relying heavily on them could provide a skewed perspective of market structure. They offer a static, backward-looking view that may not accurately reflect real-time changes in market sentiment or the dynamic nature of markets.
This shift from a fractal-based perspective to a pivot point perspective has significant implications. It can lead traders to misinterpret market structure and potentially make incorrect trading decisions.
To highlight this issue, you've developed a Donchian Structure indicator that mirrors the use of pivot points. The Donchian Channels are formed by the highest high and the lowest low over a certain period, providing another representation of potential market extremes. The fact that the Donchian Structure indicator produces the same results as pivot points underscores the inherent limitations of relying too heavily on these tools.
While the Donchian Structure indicator or pivot points can be useful tools, they should not replace the original, fractal-based perspective of the ICT methodology. These tools can provide a broad overview of market structure but may not capture the intricate dynamics and real-time changes that a fractal-based approach can offer.
It's essential for traders to understand these differences and to apply these tools correctly within the broader context of the ICT methodology and the Smart Money Concept Structure. A well-rounded approach that incorporates fractals, along with other tools and forms of analysis, is likely to provide a more accurate and comprehensive understanding of market structure.
█ Smart Money Concept - Misunderstandings
The Smart Money Concept is a popular concept among traders, and it's based on the idea that the "smart money" - typically large institutional investors, market makers, and professional traders - have superior knowledge or information, and their actions can provide valuable insight for other traders.
One of the biggest misunderstandings with this concept is the belief that tracking smart money activity can guarantee profitable trading.
█ Here are a few common misconceptions:
Following Smart Money Equals Guaranteed Success: Many traders believe that if they can follow the smart money, they will be successful. However, tracking the activity of large institutional investors and other professionals isn't easy, as they use complex strategies, have access to information not available to the public, and often intentionally hide their moves to prevent others from detecting their strategies.
Instantaneous Reaction and Results: Another misconception is that market movements will reflect smart money actions immediately. However, large institutions often slowly accumulate or distribute positions over time to avoid moving the market drastically. As a result, their actions might not produce an immediate noticeable effect on the market.
Smart Money Always Wins: It's not accurate to assume that smart money always makes the right decisions. Even the most experienced institutional investors and professional traders make mistakes, misjudge market conditions, or are affected by unpredictable events.
Smart Money Activity is Transparent: Understanding what constitutes smart money activity can be quite challenging. There are many indicators and metrics that traders use to try and track smart money, such as the COT (Commitments of Traders) reports, Level II market data, block trades, etc. However, these can be difficult to interpret correctly and are often misleading.
Assuming Uniformity Among Smart Money: 'Smart Money' is not a monolithic entity. Different institutional investors and professional traders have different strategies, risk tolerances, and investment horizons. What might be a good trade for a long-term institutional investor might not be a good trade for a short-term professional trader, and vice versa.
█ Market Structure
The Smart Money Concept Structure deals with the interpretation of price action that forms the market structure, focusing on understanding key shifts or changes in the market that may indicate where 'smart money' (large institutional investors and professional traders) might be moving in the market.
█ Three common concepts in this regard are Change of Character (CHoCH), and Shift in Market Structure (SMS), Break of Structure (BMS/BoS).
Change of Character (CHoCH): This refers to a noticeable change in the behavior of price movement, which could suggest that a shift in the market might be about to occur. This might be signaled by a sudden increase in volatility, a break of a trendline, or a change in volume, among other things.
Shift in Market Structure (SMS): This is when the overall structure of the market changes, suggesting a potential new trend. It usually involves a sequence of lower highs and lower lows for a downtrend, or higher highs and higher lows for an uptrend.
Break of Structure (BMS/BoS): This is when a previously defined trend or pattern in the price structure is broken, which may suggest a trend continuation.
A key component of this approach is the use of fractals, which are repeating patterns in price action that can give insights into potential market reversals. They appear at all scales of a price chart, reflecting the self-similar nature of markets.
█ Market Structure - Misunderstandings
One of the biggest misunderstandings about the ICT approach is the over-reliance or incorrect application of pivot points. Pivot points are a popular tool among traders due to their simplicity and easy-to-understand nature. However, when it comes to the Smart Money Concept and trying to follow the steps of professional traders or large institutions, relying heavily on pivot points can create misconceptions and lead to confusion. Here's why:
Delayed and Static Information: Pivot points are inherently backward-looking because they're calculated based on the previous period's data. As such, they may not reflect real-time market dynamics or sudden changes in market sentiment. Furthermore, they present a static view of market structure, delineating pre-defined levels of support and resistance. This static nature can be misleading because markets are fundamentally dynamic and constantly changing due to countless variables.
Inadequate Representation of Market Complexity: Markets are influenced by a myriad of factors, including economic indicators, geopolitical events, institutional actions, and market sentiment, among others. Relying on pivot points alone for reading market structure oversimplifies this complexity and can lead to a myopic understanding of market dynamics.
False Signals and Misinterpretations: Pivot points can often give false signals, especially in volatile markets. Prices might react to these levels temporarily but then continue in the original direction, leading to potential misinterpretation of market structure and sentiment. Also, a trader might wrongly perceive a break of a pivot point as a significant market event, when in fact, it could be due to random price fluctuations or temporary volatility.
Over-simplification: Viewing market structure only through the lens of pivot points simplifies the market to static levels of support and resistance, which can lead to misinterpretation of market dynamics. For instance, a trader might view a break of a pivot point as a definite sign of a trend, when it could just be a temporary price spike.
Ignoring the Fractal Nature of Markets: In the context of the Smart Money Concept Structure, understanding the fractal nature of markets is crucial. Fractals are self-similar patterns that repeat at all scales and provide a more dynamic and nuanced understanding of market structure. They can help traders identify shifts in market sentiment or direction in real-time, providing more relevant and timely information compared to pivot points.
The key takeaway here is not that pivot points should be entirely avoided or that they're useless. They can provide valuable insights and serve as a useful tool in a trader's toolbox when used correctly. However, they should not be the sole or primary method for understanding the market structure, especially in the context of the Smart Money Concept Structure.
█ Fractals
Instead, traders should aim for a comprehensive understanding of markets that incorporates a range of tools and concepts, including but not limited to fractals, order flow, volume analysis, fundamental analysis, and, yes, even pivot points. Fractals offer a more dynamic and nuanced view of the market. They reflect the recursive nature of markets and can provide valuable insights into potential market reversals. Because they appear at all scales of a price chart, they can provide a more holistic and real-time understanding of market structure.
In contrast, the Smart Money Concept Structure, focusing on fractals and comprehensive market analysis, aims to capture a more holistic and real-time view of the market. Fractals, being self-similar patterns that repeat at different scales, offer a dynamic understanding of market structure. As a result, they can help to identify shifts in market sentiment or direction as they happen, providing a more detailed and timely perspective.
Furthermore, a comprehensive market analysis would consider a broader set of factors, including order flow, volume analysis, and fundamental analysis, which could provide additional insights into 'smart money' actions.
█ Donchian Structure
Donchian Channels are a type of indicator used in technical analysis to identify potential price breakouts and trends, and they may also serve as a tool for understanding market structure. The channels are formed by taking the highest high and the lowest low over a certain number of periods, creating an envelope of price action.
Donchian Channels (or pivot points) can be useful tools for providing a general view of market structure, and they may not capture the intricate dynamics associated with the Smart Money Concept Structure. A more nuanced approach, centered on real-time fractals and a comprehensive analysis of various market factors, offers a more accurate understanding of 'smart money' actions and market structure.
█ Here is why Donchian Structure may be misleading:
Lack of Nuance: Donchian Channels, like pivot points, provide a simplified view of market structure. They don't take into account the nuanced behaviors of price action or the complex dynamics between buyers and sellers that can be critical in the Smart Money Concept Structure.
Limited Insights into 'Smart Money' Actions: While Donchian Channels can highlight potential breakout points and trends, they don't necessarily provide insights into the actions of 'smart money'. These large institutional traders often use sophisticated strategies that can't be easily inferred from price action alone.
█ Indicator Overview
We have built this Donchian Structure indicator to show that it returns the same results as using pivot points. The Donchian Structure indicator can be a useful tool for market analysis. However, it should not be seen as a direct replacement or equivalent to the original Smart Money concept, nor should any indicator based on pivot points. The indicator highlights the importance of understanding what kind of trading tools we use and how they can affect our decisions.
The Donchian Structure Indicator displays CHoCH, SMS, BoS/BMS, as well as premium and discount areas. This indicator plots everything in real-time and allows for easy backtesting on any market and timeframe. A unique candle coloring has been added to make it more engaging and visually appealing when identifying new trading setups and strategies. This candle coloring is "leading," meaning it can signal a structural change before it actually happens, giving traders ample time to plan their next trade accordingly.
█ How to use
The indicator is great for traders who want to simplify their view on the market structure and easily backtest Smart Money Concept Strategies. The added candle coloring function serves as a heads-up for structure change or can be used as trend confirmation. This new candle coloring feature can generate many new Smart Money Concepts strategies.
█ Features
Market Structure
The market structure is based on the Donchian channel, to which we have added what we call 'Structure Response'. This addition makes the indicator more useful, especially in trending markets. The core concept involves traders buying at a discount and selling or shorting at a premium, depending on the order flow. Structure response enables traders to determine the order flow more clearly. Consequently, more trading opportunities will appear in trending markets.
Structure Candles
Structure Candles highlight the current order flow and are significantly more responsive to structural changes. They can provide traders with a heads-up before a break in structure occurs
-----------------
Disclaimer
The information contained in my Scripts/Indicators/Ideas/Algos/Systems does not constitute financial advice or a solicitation to buy or sell any securities of any type. I will not accept liability for any loss or damage, including without limitation any loss of profit, which may arise directly or indirectly from the use of or reliance on such information.
All investments involve risk, and the past performance of a security, industry, sector, market, financial product, trading strategy, backtest, or individual's trading does not guarantee future results or returns. Investors are fully responsible for any investment decisions they make. Such decisions should be based solely on an evaluation of their financial circumstances, investment objectives, risk tolerance, and liquidity needs.
My Scripts/Indicators/Ideas/Algos/Systems are only for educational purposes!

Low-lag TrendlineWe apply the LLT trend timing to daily data of market indices such as the Shanghai and Shenzhen 300, Shanghai Composite Index, and Shenzhen Composite Index, and use the tangent method to make direction judgments, obtaining a good risk return situation. Compared to MA trend timing, we found that the LLT model has a shorter timing period and better stability. However, there is a problem with using the tangent method to track trend lines, which is that near the turning point of the trend, the tangent slope is prone to oscillate near zero, resulting in multiple timing judgments and a decrease in accuracy. This is equivalent to embedding a certain stop loss mechanism in the timing model, so we call this type of timing method transactional timing. For the LLT indicator, once the trend is established, holding positions can maintain a relatively long profit period, and although there are many volatile trading times near the inflection point, the holding time is often very short. Therefore, for transactional timing, when the accuracy of judgment is relatively low, the proportion of correct judgment time is often high, and profits mainly come from this part of the contribution.

support and resistance on multi timeframe [parsimaj] Description:
support and resistance and trendline on two timeframes by your choice
This indicator is capable of showing you the current and higher timeframe support and resistance by your strategy choice (two timeframes alongside each other). It also helps you to monitor the trend direction in short and long term by trend lines . You can change the depth of every levels and trend lines from the panel. Use this indicator in all markets because it follows the basic principles of levels but is unique in changing second timeframe by your choice.
_its smart , if the levels are too close together ,it will choose the deeper ones for you.
How it works:
By default, there is no higher timeframe and you can select your desire higher timeframe from the panel. Higher timelines will be displayed thicker and your current levels would be thin lines. (Levels that are higher than the current price will be red and those that are lower will be green). The number of levels to display is also by your choice, the default is 4 levels for each timeframe.
We have two types of trend lines , long terms as trend 1 (blue below and purple above trend line )- short term as trend 2(dashed ones).
Bouncing on levels and breaking trend line are the best triggers for entry and exit points.
Setting:
First, choose your higher timeframe then the depth of levels for each time (current and higher), The deeper it is, the more precise the lines. After that you can set the depth of trend lines by your choice. Trend 1 is the longer term So put it deeper and then set the short trend line (dashed ones) if you want to change it.
We have put the settings in the best mode, but you can also change it according to your strategy and inform us about the results.
This indicator has been obtained with hours of effort and codding , hope you enjoy
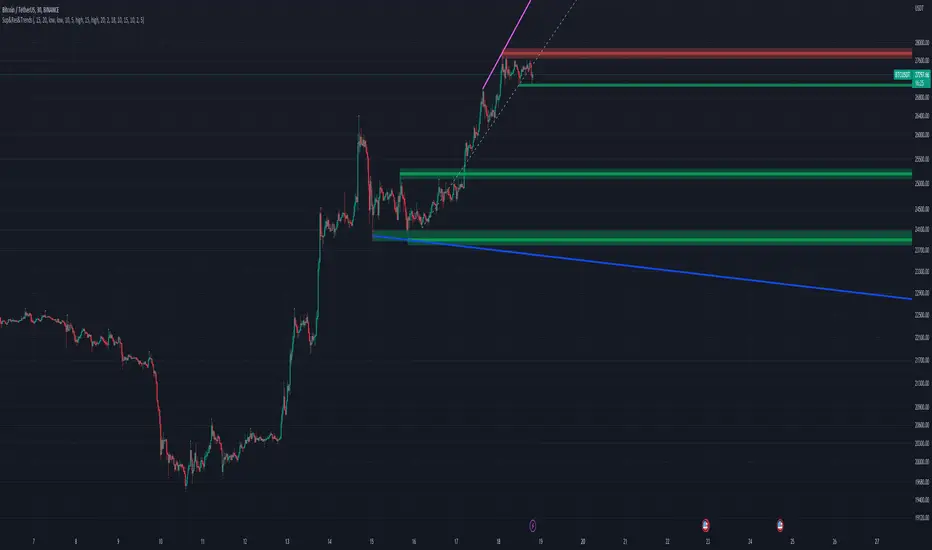
Token Metrics IndicatorThe Token Metrics Combined Indicator v2 is a comprehensive technical analysis tool designed to output Long/Short signals for crypto assets on TradingView. It combines multiple indicators, including Token Metrics Clouds, Token Metrics Trend Lines , Token Metrics Channels, and signals, to give a comprehensive outlook on the market trend and potential entry/exit points.
Users can backtest the signals to understand the strategy's historical performance, learn how to use it, identify its pros and cons, and determine the market conditions it best suits. It is important to note that the backtesting performance does not indicate future results.
The methods for calculating fixed stop-losses vary depending on the trading pattern. A fixed stop-loss is used for long-term trading, while a trading stop-loss is used for high-frequency trading. This provides flexible investment risk management, allowing you to assign different stop-loss percentages to different trading strategies.
The Length input allows users to control the indicator’s sensitivity, with a default value of 20 bars for long-term trading and 9 bars for high-frequency trading. The Adjustment Factor input has a default value of 0.1 and can be adjusted to adapt to changing levels of volatility . The Stop-loss input allows users to control their risk tolerance, with a default value of 8% for long-term trading and 2% for high-frequency trading.
Token Metrics Clouds incorporates a bullish / bearish trend indicator, which uses two adaptive moving averages that adapt to volatility , reducing false trend signals during range-bound environments and providing a more accurate representation of market trends.
The Token Metrics Trendline is a long-term indicator that uses an adaptive moving average to identify long-term trends. This can also be used for long-term resistance and support levels, providing a comprehensive overview of the current market situation for both long-term and high-frequency traders.
The Token Metrics Signals indicator provides long, short, and close signals, indicating when to enter and exit long or short positions based on the TM trend-following strategy.
The Token Metrics Channels indicator is a top/bottom indicator that adjusts to current levels of volatility . This uses adaptive Donchian channels to determine the previous short-term swing high and low, providing insight into where short-term resistance or support might be forming and where breakouts can occur. The look-back periods change according to the strategy time frame, offering a flexible and dynamic approach to market analysis.
Long-term trading is a trend-following strategy best suited for daily and weekly timeframes. This strategy works well in trending markets but may produce false signals in choppy or range-bound markets.
High-frequency trading is a mean-reverting strategy best suited for 15-minute, 30-minute, and 1-hour timeframes. This strategy performs well in choppy or range-bound markets but may not be effective in strong trending markets.

GKD-C Recursive Moving Average [Loxx]Giga Kaleidoscope Recursive Moving Average Averages is a Confirmation module included in Loxx's "Giga Kaleidoscope Modularized Trading System".
█ Giga Kaleidoscope Modularized Trading System
What is Loxx's "Giga Kaleidoscope Modularized Trading System"?
The Giga Kaleidoscope Modularized Trading System is a trading system built on the philosophy of the NNFX (No Nonsense Forex) algorithmic trading.
What is an NNFX algorithmic trading strategy?
The NNFX algorithm is built on the principles of trend, momentum, and volatility. There are six core components in the NNFX trading algorithm:
1. Volatility - price volatility; e.g., Average True Range, True Range Double, Close-to-Close, etc.
2. Baseline - a moving average to identify price trend
3. Confirmation 1 - a technical indicator used to identify trends
4. Confirmation 2 - a technical indicator used to identify trends
5. Continuation - a technical indicator used to identify trends
6. Volatility/Volume - a technical indicator used to identify volatility/volume breakouts/breakdown
7. Exit - a technical indicator used to determine when a trend is exhausted
How does Loxx's GKD (Giga Kaleidoscope Modularized Trading System) implement the NNFX algorithm outlined above?
Loxx's GKD v1.0 system has five types of modules (indicators/strategies). These modules are:
1. GKD-BT - Backtesting module (Volatility, Number 1 in the NNFX algorithm)
2. GKD-B - Baseline module (Baseline and Volatility/Volume, Numbers 1 and 2 in the NNFX algorithm)
3. GKD-C - Confirmation 1/2 and Continuation module (Confirmation 1/2 and Continuation, Numbers 3, 4, and 5 in the NNFX algorithm)
4. GKD-V - Volatility/Volume module (Confirmation 1/2, Number 6 in the NNFX algorithm)
5. GKD-E - Exit module (Exit, Number 7 in the NNFX algorithm)
(additional module types will added in future releases)
Each module interacts with every module by passing data between modules. Data is passed between each module as described below:
GKD-B => GKD-V => GKD-C(1) => GKD-C(2) => GKD-C(Continuation) => GKD-E => GKD-BT
That is, the Baseline indicator passes its data to Volatility/Volume. The Volatility/Volume indicator passes its values to the Confirmation 1 indicator. The Confirmation 1 indicator passes its values to the Confirmation 2 indicator. The Confirmation 2 indicator passes its values to the Continuation indicator. The Continuation indicator passes its values to the Exit indicator, and finally, the Exit indicator passes its values to the Backtest strategy.
This chaining of indicators requires that each module conform to Loxx's GKD protocol, therefore allowing for the testing of every possible combination of technical indicators that make up the six components of the NNFX algorithm.
What does the application of the GKD trading system look like?
Example trading system:
Backtest: Strategy with 1-3 take profits, trailing stop loss, multiple types of PnL volatility, and 2 backtesting styles
Baseline: Hull Moving Average
Volatility/Volume: Volatility Ratio as shown on the chart above
Confirmation 1: Recursive Moving Average Averages as shown on the chart above
Confirmation 2: Williams Percent Range
Continuation: Fisher Transform
Exit: Rex Oscillator
Each GKD indicator is denoted with a module identifier of either: GKD-BT, GKD-B, GKD-C, GKD-V, or GKD-E. This allows traders to understand to which module each indicator belongs and where each indicator fits into the GKD protocol chain.
Giga Kaleidoscope Modularized Trading System Signals (based on the NNFX algorithm)
Standard Entry
1. GKD-C Confirmation 1 Signal
2. GKD-B Baseline agrees
3. Price is within a range of 0.2x Volatility and 1.0x Volatility of the Goldie Locks Mean
4. GKD-C Confirmation 2 agrees
5. GKD-V Volatility/Volume agrees
Baseline Entry
1. GKD-B Baseline signal
2. GKD-C Confirmation 1 agrees
3. Price is within a range of 0.2x Volatility and 1.0x Volatility of the Goldie Locks Mean
4. GKD-C Confirmation 2 agrees
5. GKD-V Volatility/Volume agrees
6. GKD-C Confirmation 1 signal was less than 7 candles prior
Continuation Entry
1. Standard Entry, Baseline Entry, or Pullback; entry triggered previously
2. GKD-B Baseline hasn't crossed since entry signal trigger
3. GKD-C Confirmation Continuation Indicator signals
4. GKD-C Confirmation 1 agrees
5. GKD-B Baseline agrees
6. GKD-C Confirmation 2 agrees
1-Candle Rule Standard Entry
1. GKD-C Confirmation 1 signal
2. GKD-B Baseline agrees
3. Price is within a range of 0.2x Volatility and 1.0x Volatility of the Goldie Locks Mean
Next Candle:
1. Price retraced (Long: close < close or Short: close > close )
2. GKD-B Baseline agrees
3. GKD-C Confirmation 1 agrees
4. GKD-C Confirmation 2 agrees
5. GKD-V Volatility/Volume agrees
1-Candle Rule Baseline Entry
1. GKD-B Baseline signal
2. GKD-C Confirmation 1 agrees
3. Price is within a range of 0.2x Volatility and 1.0x Volatility of the Goldie Locks Mean
4. GKD-C Confirmation 1 signal was less than 7 candles prior
Next Candle:
1. Price retraced (Long: close < close or Short: close > close )
2. GKD-B Baseline agrees
3. GKD-C Confirmation 1 agrees
4. GKD-C Confirmation 2 agrees
5. GKD-V Volatility/Volume Agrees
PullBack Entry
1. GKD-B Baseline signal
2. GKD-C Confirmation 1 agrees
3. Price is beyond 1.0x Volatility of Baseline
Next Candle:
1. Price is within a range of 0.2x Volatility and 1.0x Volatility of the Goldie Locks Mean
3. GKD-C Confirmation 1 agrees
4. GKD-C Confirmation 2 agrees
5. GKD-V Volatility/Volume Agrees
█ Recursive Moving Average Averages
What is Recursive Moving Average Averages?
Dennis Meyers's Recursive Moving Trendline uses a recursive (repeated application of a rule) polynomial fit, a technique that uses a small number of past values estimations of price and today's price to predict tomorrow's price.
Requirements
Inputs
Confirmation 1 and Solo Confirmation: GKD-V Volatility / Volume indicator
Confirmation 2: GKD-C Confirmation indicator
Outputs
Confirmation 2 and Solo Confirmation: GKD-E Exit indicator
Confirmation 1: GKD-C Confirmation indicator
Continuation: GKD-E Exit indicator
Additional features will be added in future releases.

CryptoverseThis Indicator dynamically generates and charts Pivot Points, Support and Resistance Lines, Trend Channels and even Rsi Divergences in every market and every time period.
While it helps you identify your entry points, stop loss and take positions, it certainly does not include trading signals and trading strategy.
Bonus: the indicator contains ema21, ema50, ema100 and ema200 to support the lines created. If you wish, you can change the EMA values in the settings.
Recommendation: RSI is included in the indicator codes in order to detect divergences dataally, but it is not displayed on the chart. I recommend adding an additional RSI indicator to keep track of past and current potential divergences.
USER MANUAL:
----------------------------------------------
General Settings:
Pivot Period: This field determines how many candles before and after a candle should be controlled in order to be able to determine the top and bottom points on the chart.
Support and Resistance Lines and Trend Channels formed on the chart are created by calculating the Pivot points formed according to the period determined here. (Default value: 6)
Pivot Source: Determines the pivot points to be created according to the value of the relevant candle.
(Default and Recommended: closing)
----------------------------------------------
Support And Resistance Settings:
Custom Bars Back: This area allows you to specify how many pivot points from the current candle to the previous candle to create support resistance lines on the Chart. The default value is the last 500 candles.
*Note: The more old candles are checked, the more support and resistance lines will appear. This may prevent you from making sound determinations on the chart.*
Current Bar Decrease: This field works integrated with Custom Bars Back. By subtracting the current candle by the specified number, it provides the formation of lines without including those candles.
Default value: It is set to 0 to include current data.
Example: If Custom Bars Back: 500 and Current Bar Decrease: 10, Support and Resistance lines are created by considering 500 candles before the last 10 candles without including the last 10 candles on the chart.
Show S/R Lines: This field allows you to show or hide the Support and Resistance lines at any time.
Auto Simplification: This field is marked by default. It allows the Simplification Steps value to be determined automatically within the code according to the time period and current volatility of the relevant parity. (It is recommended to use the default version.)
Simplification Steps: This field allows you to get more understandable lines by simplifying the Support and Resistance lines based on Pivot points. If a simplification is not done, the lines to be formed with only the pivot points will be too many and this creates a dirty and useless appearance on the chart.
Each 1 digit you enter as a step combines the lines that are close to each other at a value of 0.01% and creates a common line.
Example: If you enter the number 10 as Steps, it will form a single common line from lines close together, starting at 0.01% respectively. It will continue to increase by 0.02%, 0.03%, 0.04% in its next steps. For the number 10, it will complete its loop by combining lines within the last remaining lines that are as close as 0.1% to each other and creating new lines from their midpoints.
The deafult value is 14. (Max. simplifies lines with closeness up to 1.4%.)
Important Note: If Auto Simplification is on, the entered value has no meaning. The Indicator performs simplification operations automatically. If you want to manage these steps manually, you can turn off Auto Simplification and enter your own value.
S/R Lines Color: Allows you to specify the color of the lines.
Label Location: Allows you to determine how many candles ahead the information label formed for each line will be positioned.
Line Label Descriptions:
Line: It is the price value that the line coincides with.*
Distance: Shows the percentage distance of the line from the current price.
▲ : Shows the percentage distance from the line above it.
▼ : Shows the percentage distance from the line below it.
Strength: Indicates the total number of steps the process has taken during the simplification process. The height of the number indicates the strength of resistance and support in the close price range.
C. Width: stands for Channel Width. It shows the percentage value between the highest price and the lowest price on the past candle as many candles specified by Custom Bars Back.
S. Steps: stands for Simplification Steps. Indicates the number of simplification steps applied. A value of 150 in the image indicates that a 1.5% simplification range has been applied.
----------------------------------------------
Trend Channels Settings:
Show All Trend Lines: Allows you to show and hide trend channels.
Hide Old Trend Lines: If you enable it, it will hide channels created in the past except for Current Trend channels.
Helper Line Format: Allows the auxiliary line that converts a trendline to a channel to be drawn based on percentage or price.
Note: There may be cases where the auxiliary lines do not provide full parallelism when using large time intervals by preferring a percentage.
Up Trend Color: Indicates the color of the Up Trend channel.
Down Trend Color: Specifies the color of the Downtrend channel.
Show Up Trend Overflow, Show Down Trend Overflow:
When the price closes above or below the trend channels, it provides awareness with the help of a text on the chart. Colors can be adjusted according to preference.
----------------------------------------------
RSI Divergences Settings:
This indicator gives you information about 4 different divergences. You can customize the divergence views with the show and hide options.
Bullish Regular, Bullish Hidden, Bearish Regular and Bearish Hidden.
Green divergences from the bottom of the graph represent bullish, and red divergences above the graph represent bearish.
Important note: Seeing a mismatch label definitely indicates that there is a mismatch between prices and rsi, but a mismatch does not always indicate a change in price.
Potential Divergence:
The indicator not only shows you past divergences, but also informs you of potential divergences based on the current status of the chart.
A potential divergence may not turn into a true one if the price flow continues to increase or decrease in the same direction. But all divergences seen in the past must have been shown as potential divergences beforehand.
Rsi Length, Rsi Source: Allows you to change settings for RSI values typically embedded within the indicator.
Note: Pivot Source and RSI Source using the same type of candle data ensures that divergences are displayed correctly.
----------------------------------------------
EMA Settings:
The indicator allows you to use 4 different EMA data in addition to Support and Resistance lines, Trend Channels and RSI divergences. By default, 21, 50, 100 and 200 are used. You can change the EMA values and colors in the Settings section, or you can use the show hide options in the Style section.

Dynamic Fibonacci RetracementA simple fibonacci retracement tool that dynamically updates itself based on current price and previous retracement values.
Features the essential aspects of the built-in tool and more.
Auto Trendline
Auto Reversal
Auto Level Adjustment
Labels indicating retracement value
Customizable lookback range
The top and bottom levels will auto-adjust according to where price currently is, which will also affect fibonacci levels as it progresses.

Musashi_Fractal_Dimension === Musashi-Fractal-Dimension ===
This tool is part of my research on the fractal nature of the markets and understanding the relation between fractal dimension and chaos theory.
To take full advantage of this indicator, you need to incorporate some principles and concepts:
- Traditional Technical Analysis is linear and Euclidean, which makes very difficult its modeling.
- Linear techniques cannot quantify non-linear behavior
- Is it possible to measure accurately a wave or the surface of a mountain with a simple ruler?
- Fractals quantify what Euclidean Geometry can’t, they measure chaos, as they identify order in apparent randomness.
- Remember: Chaos is order disguised as randomness.
- Chaos is the study of unstable aperiodic behavior in deterministic non-linear dynamic systems
- Order and randomness can coexist, allowing predictability.
- There is a reason why Fractal Dimension was invented, we had no way of measuring fractal-based structures.
- Benoit Mandelbrot used to explain it by asking: How do we measure the coast of Great Britain?
- An easy way of getting the need of a dimension in between is looking at the Koch snowflake.
- Market prices tend to seek natural levels of ranges of balance. These levels can be described as attractors and are determinant.
Fractal Dimension Index ('FDI')
Determines the persistence or anti-persistence of a market.
- A persistent market follows a market trend. An anti-persistent market results in substantial volatility around the trend (with a low r2), and is more vulnerable to price reversals
- An easy way to see this is to think that fractal dimension measures what is in between mainstream dimensions. These are:
- One dimension: a line
- Two dimensions: a square
- Three dimensions: a cube.
--> This will hint you that at certain moment, if the market has a Fractal Dimension of 1.25 (which is low), the market is behaving more “line-like”, while if the market has a high Fractal Dimension, it could be interpreted as “square-like”.
- 'FDI' is trend agnostic, which means that doesn't consider trend. This makes it super useful as gives you clean information about the market without trying to include trend stuff.
Question: If we have a game where you must choose between two options.
1. a horizontal line
2. a vertical line.
Each iteration a Horizontal Line or a Square will appear as continuation of a figure. If it that iteration shows a square and you bet vertical you win, same as if it is horizontal and it is a line.
- Wouldn’t be useful to know that Fractal dimension is 1.8? This will hint square. In the markets you can use 'FD' to filter mean-reversal signals like Bollinger bands, stochastics, Regular RSI divergences, etc.
- Wouldn’t be useful to know that Fractal dimension is 1.2? This will hint Line. In the markets you can use 'FD' to confirm trend following strategies like Moving averages, MACD, Hidden RSI divergences.
Calculation method:
Fractal dimension is obtained from the ‘hurst exponent’.
'FDI' = 2 - 'Hurst Exponent'
Musashi version of the Classic 'OG' Fractal Dimension Index ('FDI')
- By default, you get 3 fast 'FDI's (11,12,13) + 1 Slow 'FDI' (21), their interaction gives useful information.
- Fast 'FDI' cross will give you gray or red dots while Slow 'FDI' cross with the slowest of the fast 'FDI's will give white and orange dots. This are great to early spot trend beginnings or trend ends.
- A baseline (purple) is also provided, this is calculated using a 21 period Bollinger bands with 1.618 'SD', once calculated, you just take midpoint, this is the 'TDI's (Traders Dynamic Index) way. The indicator will print purple dots when Slow 'FDI' and baseline crosses, I see them as Short-Term cycle changes.
- Negative slope 'FDI' means trending asset.
- Positive most of the times hints correction, but if it got overextended it might hint a rocket-shot.
TDI Ranges:
- 'FDI' between 1.0≤ 'FDI' ≤1.4 will confirm trend following continuation signals.
- 'FDI' between 1.6≥ 'FDI' ≥2.0 will confirm reversal signals.
- 'FDI' == 1.5 hints a random unpredictable market.
Fractal Attractors
- As you must know, fractals tend orbit certain spots, this are named Attractors, this happens with any fractal behavior. The market of course also shows them, in form of Support & Resistance, Supply Demand, etc. It’s obvious they are there, but now we understand that they’re not linear, as the market is fractal, so simple trendline might not be the best tool to model this.
- I’ve noticed that when the Musashi version of the 'FDI' indicator start making a cluster of multicolor dots, this end up being an attractor, I tend to draw a rectangle as that area as price tend to come back (I still researching here).
Extra useful stuff
- Momentum / speed: Included by checking RSI Study in the indicator properties. This will add two RSI’s (9 and a 7 periods) plus a baseline calculated same way as explained for 'FDI'. This gives accurate short-term trends. It also includes RSI divergences (regular and hidden), deactivate with a simple check in the RSI section of the properties.
- BBWP (Bollinger Bands with Percentile): Efficient way of visualizing volatility as the percentile of Bollinger bands expansion. This line varies color from Iced blue when low volatility and magma red when high. By default, comes with the High vols deactivated for better view of 'FDI' and RSI while all studies are included. DDWP is trend agnostic, just like 'FDI', which make it very clean at providing information.
- Ultra Slow 'FDI': I noticed that while using BBWP and RSI, the indicator gets overcrowded, so there is the possibility of adding only one 'FDI' + its baseline.
Final Note: I’ve shown you few ways of using this indicator, please backtest before using in real trading. As you know trading is more about risk and trade management than the strategy used. This still a work in progress, I really hope you find value out of it. I use it combination with a tool named “Musashi_Katana” (also found in TradingView).
Best!
Musashi

Donchian Trendline - Support Resistance Slope [UhoKang]// This is a strategy that draws a trend line in the form of a slope whenever the high point and low point are updated.
// The upper slope serves as a resistance line, and the lower slope serves as a support line.
// Buy when the of the candle crosses the slope

Fibonacci Plot [ABA Invest]]ABOUT
This Fibonacci tool is easier than the usual Fibonacci drawing. with this, we can use Fibonacci drawing by choosing 2 different candles as starting point and ending point
INPUT SETTING
Fibonacci type: we can choose the type
option 1--> Fibonacci standard: display multiple levels constructed using the starting price point, ending price point, and multiple Fibonacci ratios. These levels can be used as support and resistance
option 2--> Fibonacci musang displays multiple levels constructed using the starting price point, ending price point, and multiple Fibonacci ratios. these levels can be used as taking profit level and also to know the ending of trendline
Drawing point: we can choose the type how we want the tools to draw our starting and ending point at candlestick
- wick to wick
- wick to body
- body to body
