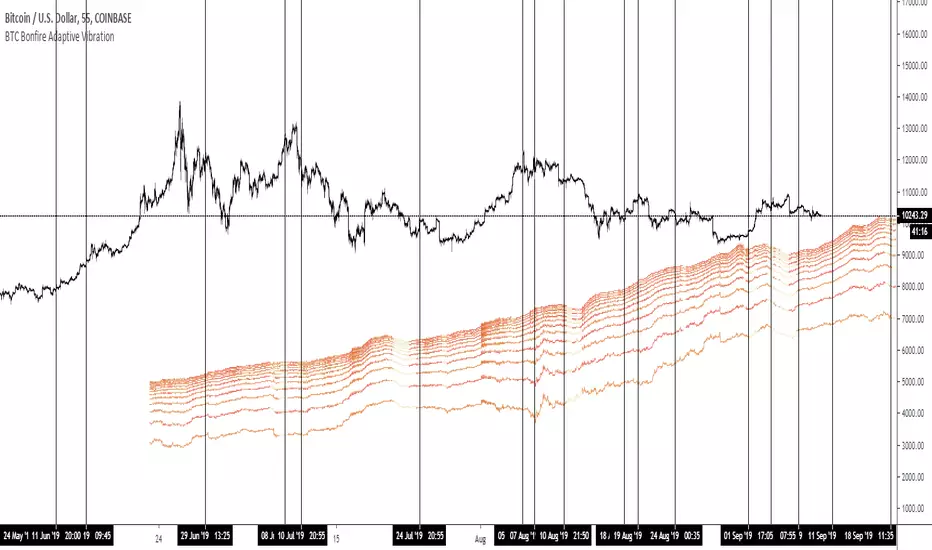
BTC Bonfire Adaptive Vibration*So far mainly tested on BTC
Gives forecasted pivots and trends
Adapts to current Algo
Shows seismic activity with waves oscillating ( neg - , pos +) for big moves and pattern data.
Shows gaps in vibration (gravity ON/OFF)
Projects pivots with trends and outlying vibrations.
Price can follow trend lines, reject trendlines, counter and or use them for support resistance at different levels.
在腳本中搜尋"trendline"
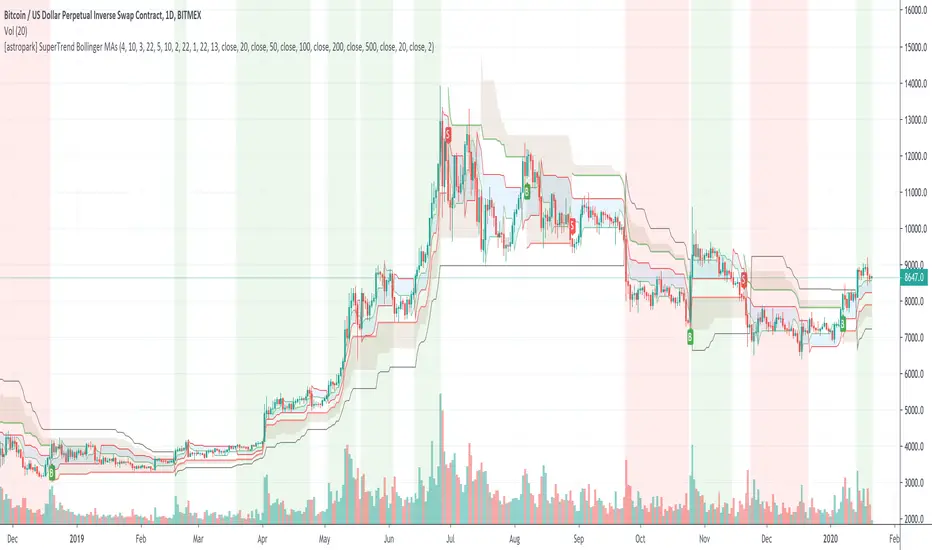
[astropark] SuperTrend Bollinger MAsHi Followers,
here it is a new script, based on SuperTrend indicator!
As plus you will be able to activate Bollinger Bands and 6 simple moving averages.
What's the SuperTrend?
As you can see from the chart, the SuperTrend Indicator
defines moving support & resistance levels for price action with its clouds and trendlines
catches trend changes when black line (the Slow SuperTrend) switches from staying upper price action to down and viceversa
shows you on background bearish momentum in red
shows you on background bullish momentum in green
This is not a free indicator, so send me a private message in order to get access to this script.
Do you like my scripts? Offer me a coffee, a beer, a pizza or whatever :)
BTC jar: 1K5kuYQPEqoNo6GRmJbHWMPmqwKM5S3oRR
ETH jar: 0x091b541a6dd6fe08c4e7bd909baafb2fce9b975e
LTC jar: LSVoAChsZrVsvbNyUfdpxtFpDAUSaUTUig
XRP jar: (XRP deposit tag) 103997763 (XRP deposit address) rEb8TK3gBgk5auZkwc6sHnwrGVJH8DuaLh
PS: Do you need a customization or do you need a dev who implements your strategy? send me a private message ;-)
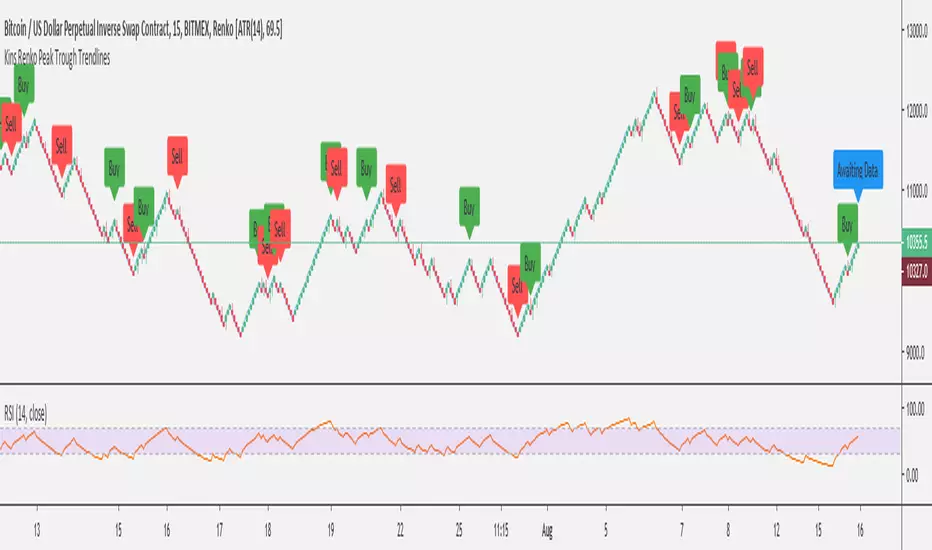
Kins Renko Peak Trough TrendlinesScript is built on the Renko Chart for Bitmex XBT. Looks for swing high/low and RSI divergences as well as some other bits.
This is my first week with Pine Script so there's probably some terrible coding practices in here but the functionality seems acceptable.
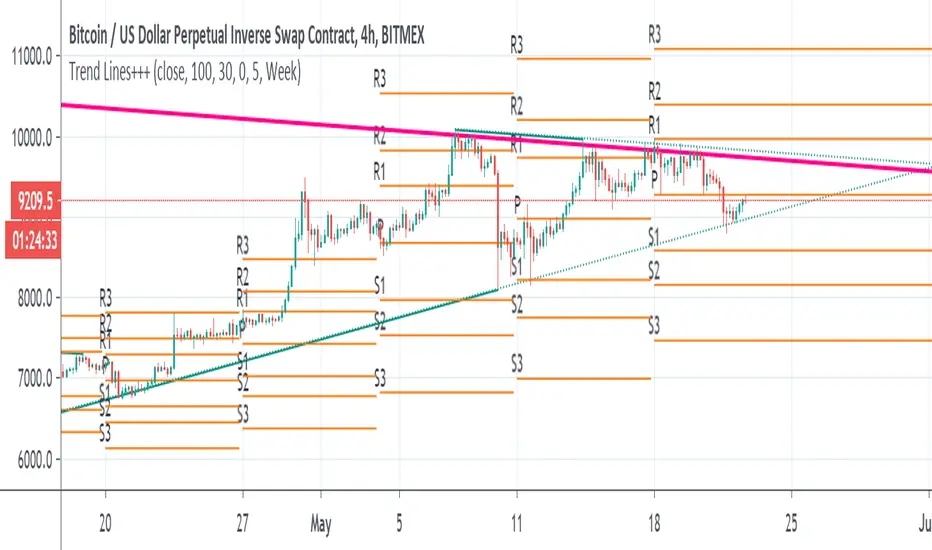
Trend Lines+++scripts taken from
Nothing here is mine , just put it as I like the combination of those script together when I analyse data
so it make life easy to draw line automode
I suggest 4 hours or daily chart with MACD and RSI
Thanks to autors in scripts
Pump Finder v1.0Generally speaking, when a big pump occurs one can expect the price to trend upward.
This script is by default well suited for timeframes larger than 15m. Use on smaller timeframes at your own risk.
When combined with basic TA like trendlines, support and resistance this can be a very powerful indicator.
This indicator performs well for the larger volume crypto's like BTC, BNB, ETH etc. See snapshots below.
Be aware:
- After multiple pumps, the chance of trend reversal becomes more likely.
- False breakouts.
- Always do your own research.
If you have any suggestions, feel free to let me know.

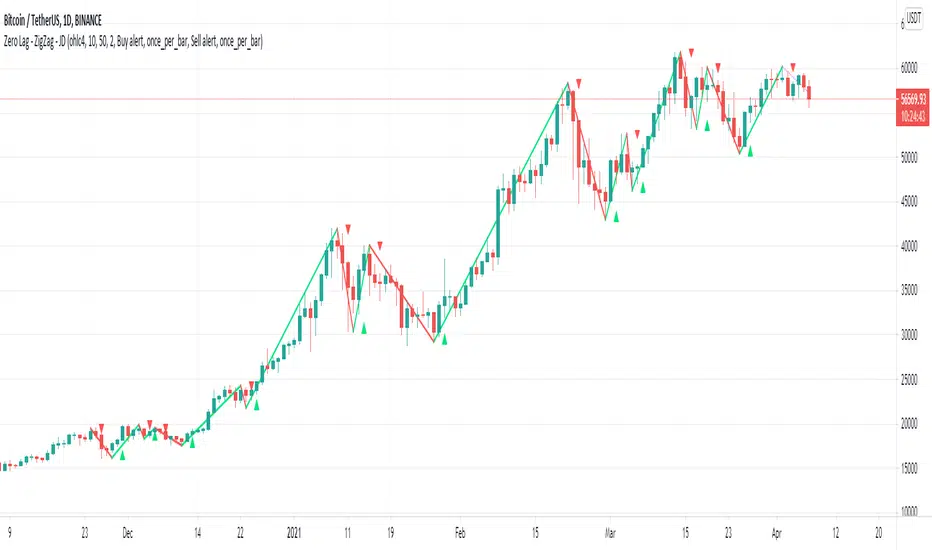
Zero Lag - ZigZag - JDThis is a alternative version of the well known "ZigZag indicator" but it uses turning points of the Jurik ma
instead of the traditional "pivot points" that are by definition lagging by a large lookback period, the (almost-) Zero Lag ZigZag lags by about 2 bars on average (depending on the candles forming)
The ZigZag pattern can be used to draw trendlines and S/R lines
It can also be used for "wave counting" in a way that reduces interpretation.
If you find other uses, please leave your ideas in the comments!
Shoutout to Everget for the awesome Jurik code!!
JD.
#NotTradingAdvice #DYOR
[New series!] [Consistent Losing Strategies] 34 EMA Scalping//---------------------------INTRO------------------------------
Hi All!
Let me introduce myself as a semi-successful forex trader & lover of automation.
I've taken to algo trading and have been hunting down strategies (that usually use indicators) to automate, backtest, and hopefully implement in MT4.
Unfortunately, most strategies are complete bulls*** and the select cases that are shown to "prove" success are limited.
These strategy sources often do not provide useful analytics either.
I want to change that approach to trading! We can really benefit each other and the community by being methodical about backtesting
as well as evaluating our results with some kind of scoring heuristic.
As for what that standardized process looks like..well I'm still working on it.
I'm pretty much on Tv for multiple hours of the day, screening strategies via Pinescript and I'd like to start sharing my progress!
This is a new series I'd like to start on consistently losing strategies. I'll make all the code public, so if you think I've made a blunder
or approached a problem the wrong way, then drop me a DM or paste your fix into the comments.
//---------------------------STRAT------------------------------
34 EMA Scalping strategy (ref. forextradingstrategies4u )
How you're supposed to trade it:
BUY:
1. Market is in an down trend as shown by the 34 EMA
2. Price breaks above a downwards trend line
3. Price breaks above the 34 EMA
4. Look for a very bullish candlestick or chart pattern
SELL:
1. Look for the 34 EMA to show we are in an uptrend
2. Price breaks below an upwards sloping trend line
3. Price breaks below 34 EMA
4. Look for a bearish candlestick or a chart pattern
//---------------------------CONC------------------------------
Q: Why does it fail?
A: I believe this strategy relies too much on subjective input (aka, trendlines).
Q: Why does it fail as an algo?
A: The 34 EMA is no more predictive than any other EMA, although it does a good job at filtering out noise.
Q: Should I try it out?
A: No, it's trash. This is the proof that it is trash.

Arkads HelpThis is a tool used to help inexperienced traders get successful trades. I accept tips as i will continue to update this tool. Thank you. Apply it to the chart, and follow the buy and sell signals. i will continue to update this, making it more accurate and adding more features. Using this with your own TA will make it unstoppable. Buy on signals on trendlines, sell at top. With more updates, i will lessen the amount of signals to make them stronger.
/// BTC --- 1PSWjCpPXQ3uHjdVUJWR5y2Q6aCa3X8Jog
/// XRP --- rEb8TK3gBgk5auZkwc6sHnwrGVJH8DuaLh TAG 107248818
/// TRX --- TEjoZ3qnGxqZBLAfn7z9iAkhjV79MV3F5h
/// ETH --- 0xf5fb4c8e9ff6bf3f0df1648ab4a355b199611c91


RSI with Visual Buy/Sell Setup | Corrective/Impulsive IndicatorRSI with Visual Buy/Sell Setup | 40-60 Support/Resistance | Corrective/Impulsive Indicator v2.15
|| RSI - The Complete Guide PDF ||
Modified Zones with Colors for easy recognition of Price Action.
Resistance @ downtrend = 60
Support @ uptrend = 40
Over 70 = Strong Bullish Impulse
Under 30 = Strong Bearish Impulse
Uptrend : 40-80
Downtrend: 60-20
--------------------
Higher Highs in price, Lower Highs in RSI = Bearish Divergence
Lower Lows in price, Higher Lows in RSI = Bullish Divergence
--------------------
Trendlines from Higher/Lower Peaks, breakout + retest for buy/sell setups.
###################
There are multiple ways for using RSI, not only divergences, but it confirms the trend, possible bounce for continuation and signals for possible trend reversal.
There's more advanced use of RSI inside the book RSI: The Complete Guide
Go with the force, and follow the trend.
"The Force is more your friend than the trend"

RSI 𝝙RSI 𝝙 is a full study system of several RSI analysis that can be used on different timeframes and adapt strategy to trending markets or trading ranges.
Identify better divergences/convergences, alerts for *potential* entry, flat and exit signals. Adapt personal strategy according to the market pace, behaviour and timeframe.
Default Settings:
RSI: 13
Linear Regression of RSI: 34
Signal RSI: 5
Long RSI: 55
RSI 𝝙 Histogram: Delta between RSI and Long RSI based on Signal RS 0.31% Length.
Activate Vertical Bar Highlights and/or Signal Flags for:
- RSI Oversold/Overbought. (Default: Highlight Bar)
- Signal RSI Oversold/Overbought. (Default: Highlight Bar)
- RSI crossing its Linear Regression . (Default: Signal Flag)
- RSI crossing its Long RSI . (Default: Off)
- Signal RSI crossing its RSI . (Default: Off)
- Signal RSI crossing its Long RSI . (Default: Off)
- RSI 𝝙 Histogram crossing baseline. (Default: Off)
Users can also do extra tunning in Style Section of Format options.
Typical use case for Daily timeframe:
RSI cross its Linear Regression produce a close signal of the on-going trend. RSI 𝝙 Histogram crossing could also provide early an signal or a confirmation. Then look RSI or RSI 𝝙 Histogram is forming a Divergence. If divergence is confirmed after candle close you can look into Signal RSI crossing RSI/Long RSI or RSI breaking the support/resistance horizontal/trendlines OR if you are more conservative wait until RSI cross Long RSI . The different markets will show slightly diff behaviours but with this indicator, we can capture its essence independently of timeframe.
RSI being above/bellow Long RSI establishes the relatively long-term bias in trending markets. This is also valid for Weekly and Monthly timeframes.
This is just a guideline suggestion. The reality is users of this indicator need to observe the market's behaviour and identify which signals will provide more reliable entries, exits and/or remain until next signals before the next round of trades.
The market behaves differently when pacing changes, volatility changes, when it trends or when it ranges. Develop an understanding of it with the help of this study.
Avoid risking more than 1% per trade. Be responsible for always making a priority about protecting capital and risk management. Develop emotional control and use this RSI study to develop a more complete trading system without any need for extra indicators other than Price and Volume .
👆active signals:
RSI crossing Linear Regression
RSI crossing Long RSI
👆active signals:
Signal RSI Long RSI
👆active signals:
RSI crossing Linear Regression
Also note that RSI 𝝙 Histogram divergences/convergences flag very often significant momentum changes. This important information is extremely useful when also looking to volume anomalies and help deciding to close a position (or enter next) before flash crash occur where a signal might come slightly late on higher timeframes.
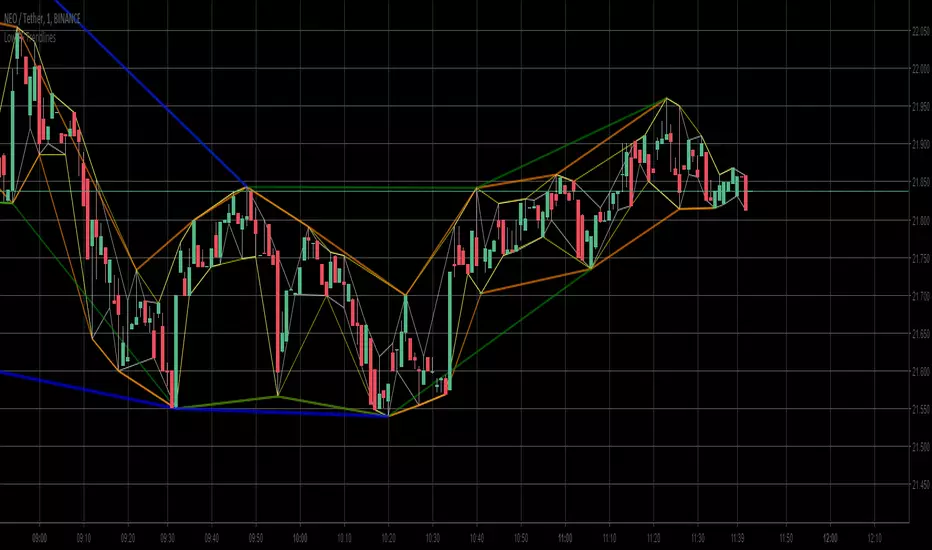
Low TF TrendlinesAs the title implies, this script is demonstrating Low Time Frames Trend Lines for
1min, 3min, 5min, 15min and 30min timeframes.
This script should be used on 1min chart only for accuracy.
However the white color lines can used in charts of any time frame including
1hr, 1day and 1week.

[NMM] TrendLines - v1An easy to use chart to display trend lines for the current trends in effect.
There are simply two parameters:
- Base Period: Defines how long back you are looking for trends. For a given base period of X, price from upto 5X bars back is taken into consideration for drawing trend lines. I would suggest keeping this to a low value. Default is 12.
- Smoothing Period: To further smoothen the trend lines, use this parameter.
Usually, a trend reversal can be easily seen from this indicator. At reversals, there is a clearly visible reversal of this indicator. If you look carefully, you can even count Eliott Waves easily on this indicator, which are sharply defined.
NOTE: I am available for custom work on hire. Contact me via PM, if required.

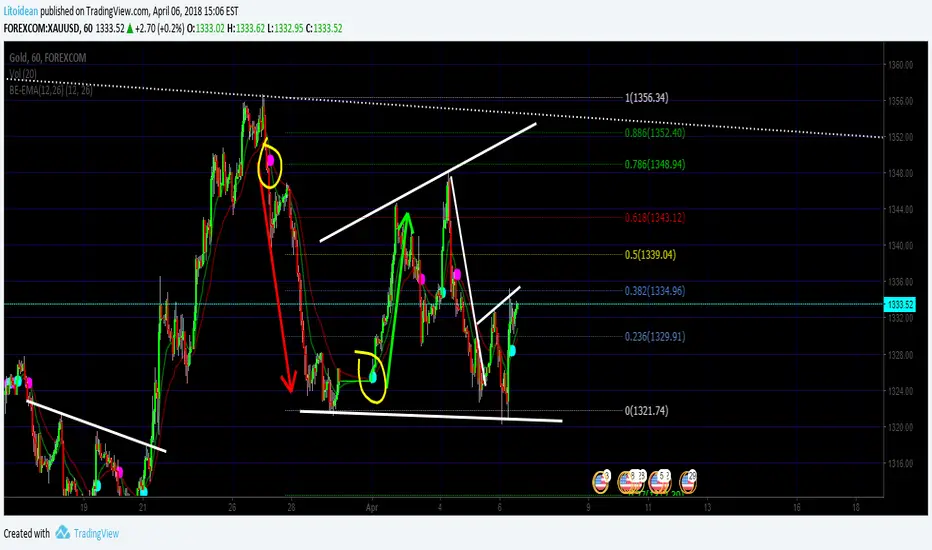
BE-EMA(12,26) (Blue Empire Exponential Moving Average)
Simple EMA where you get a CROSS mark between EMA 12 and EMA 26.
Each time a cross happens, a spot gets created.
If it's cyan, it goes up.
If it's magenta, it goes down.
I'm studying Trading at Blue Empire Academy, if you want to know more send me a PM.
Wave Analysis study the wave's behavior and tries to predict by using trendlines, elliot waves, fibonacci retracements, and EMAs basically.
In this Indicator, It's a confirmation when EMA 12 goes over to confirm the price may go up. and Vice versa.
Hope you like, please share if you think it's useful and comment if you think this can be better.
Thank you again for reading
>> This is just an indicator, it doesn't predict the future. Use it at your own risk. <<
##########
All the credits to @tracks, a genius who helped me polish the code. :] thank you.
DepthHouse Volume Flow Indicator v2The DepthHouse Volume Flow Indicator is used to help determine trend direction, and possible reverals with calculations strictly based off of volume data.
A crossover of the moving averages is a possible signal for a trend change or retracement.
Trendlines may be drawn on the histogram, and moving averages to help spot possible breakouts, and/or divergences even sooner.
Be sure to check out all of my other indicators!
Changes from version 1:
Completely altered based calculation of moving averages.
Removed the standard volume bar option and the volume overflow option.
Replaced the options above with the histogram volume bars.
Since this update completely altered the way the original worked, I have posted this as an entirely new script.
Original Indicator:

ETH/BTC MMAs Daytrade strategy 15min UT 0.05% feesPlayed around with Moving Averages, with the goal to bounce on trendlines and trend reversals.
Time Unit : 15 min
Candle Type : Heikin Ashi
Commission : 0.05% on trades (Binance fees)
Initial capital : 1k €
Do you think this could work?

Bat MACDWorks on Bullish divergence indicators and is identical to MACD during an uptrend, works best on 2H or higher timeframes.
Incorporates a SL which can be changed at will. SL is also used as a buy signal on lower timeframe crossovers.
Uses 6H MACD to differentiate between up and downtrends.
Recommend to take profits at pivots, trendlines instead of strategy's position which is delayed.
Signals on downtrend best used when SL is flat.

Scalping Swing Trading Tool R1-4 by JustUncleLDescription:
This study project is a "Scalping Swing trading Tool" and is an alternative to the "Scalping Pullback Tool R1". It is designed for a two pane TradingView chart layout :
the first pane set to 15min Time Frame;
the second pane set to 1min Time Frame(TF).
The tools incorporates the majority of the indicators needed to analyse and scalp Trends for Swings, PullBacks and reversals on 15min charts and 1min charts.
Incorporated within this tool are the following indicators:
1. The following EMAs are drawn automatically:
Green = EMA89 (15min TF) = EMA75 (1min TF)
Blue = EMA200 (15min TF) = EMA180 (1min TF)
Black = EMA633 (15min TF) = EMA540 (1min TF)
2. The 10EMA (default) High/Low+Close Price Action Channel (PAC), the PAC channel
display is disabled by default.
3. Optionally display Fractals and optional Fractal levels
4. Optional HH, LH, LL, HL finder.
5. Coloured coded Bar high lighting based on the PAC:
blue = bar closed above PAC
red = bar closed below PAC
gray = bar closed inside PAC
lime Line = EMA10 of bar close
6. Pivot points (disables Fractals automatically when selected) with optional labels.
7. EMA5-12 Channel is displayed by default.
8. EMA12-36 Ribbon is displayed by default
9. Optionally display EMA36 and PAC instead of EMA12-36 Ribbon.
Set up and hints:
I am unable to provide a full description here, as Pullback Trading incorporates a full trading Methodology, there are a number of articles and books written on the subject.
Set to two pane TradingView chart, set first pane to 15Min and second to 1min.
Set the chart to Heikin Ashi Candles (optional).
I also add a "Sweetspot Gold2" indicator to the chart as well to help with support and resistance finding and shows where the important "00" lines are.
Use the EMA200 on the 15min pane as the anchor. So when prices above EMA200 we only trade long (buy) and when prices below the EMA200 we only trade short (sell).
On the 15min chart draw any obvious Vertical Trend Lines (VTL), use Pivots point as a guide.
On the 15min chart what we’re looking for price to Pullback into the EMA5-12 Channel or EMA12-36 ribbon, we draw Trendlines uitilising the Pivot points or Fractals to guide your TL drawing.
On the 15min chart look for the trend to resume and break through the drawn TL. The bar color needs to change back to the trend direction colour to confirm as a break.
Now this break can be traded as a 15min trade or now look to the 1min chart.
On the 1min chart draw any Pullback into any of the EMAs.
On the 1min chart look for the trend to resume and break through the drawn TL. The bar color needs to change back to the trend direction colour to confirm as a break.
Now this break can be traded as a 1min trade.
There is also an option to select Pristine (ie Ideal) filtered Fractals, which look like tents or V shape 5-candle patterns. These are actually used to calculate the Pivot points as well.
Other than the "SweetSpot Gold2" indicator, you should not need any other indicator to successfully trade trends for Pullbacks and reversals. If you really want another indicator use the AO (Awesome Oscillator) as it is momentum based.

Scalping PullBack Tool R1 by JustUncleLDescription
This study project is a Scalping Pullback trading Tool that incorporates the majority of the indicators needed to analyse and scalp Trends for Pull Backs and reversals on 1min, 5min or 15min charts. The set up utilies Heikin Ashi candle charts. Incorporated within this tool are the following indicators:
1. Major industry (Banks) recognised important EMAs in an EMA Ribbon:
Green = EMA89
Blue = EMA200
Black = EMA633
2. The 36EMA (default) High/Low+Close Price Action Channel (PAC).
3. Fractals
4. HH, LH, LL, HL finder to help with drawing Trend lines and mini Trend Lines.
5. Coloured coded Bar high lighting based on the PAC:
blue = bar closed above PAC
red = bar closed below PAC
gray = bar closed inside PAC
red line = EMA36 of bar close
Setup and hints:
Set the chart to Heikin Ashi Candles.
Add "Sweetspot Gold10" indicator to the chart as well to help with support and resistance finding and shows where the important "00" and "0" lines are.
When price is above the PAC(blue bars) we are only looking to buy as price comes back to the PAC
When price is below the PAC(red bars), we are only looking to sell when price comes back to the PAC
What we’re looking for when price comes back into the PAC we draw mini Trendlines utilising the Fractals and HH/LL points to guide your TL drawing.
Now look for the trend to pull back and break the drawn TL. That's is when we place the scalp trade.
So we are looking for continuation signals in terms of a strong, momentum driven pullbacks (normally short term 10-20 pips) of the EMA36.
The other EMAs are there to check for other Pullbacks when EMA36 is broken.
Other than the SweetSpot Gold10 indicator, you should not need any other indicator to scalp the pullbacks.
References:
Fractals V8 by RicardoSantos
Price Action Trading System v0.3 by JustUncleL
SweetSpot Gold10 R1 by JustUncleL
www.swing-trade-stocks.com
www.forexstrategiesresources.com
