((Bearish)) Candle Above EMASGood Morning from the UK.
Todays script is a simple vieweing of when candles close above a certain moving average - when the market is bearish conditions - candle which close above the moving average can be viewed as a bearish signal along with confluences such as price action. This script is best on the Daily and we can expect big price moves away from this area.
The below example, we have a bearish set up with a break of trendline and then a break of a base which would 1) strong area as price is unlikely to go past this area which would make this a supply zone.
This was then followed by the signal of the candle closing above the 100ema and the 50ema.
The script is likened to my one of my previous scripts which portrays the bullish ema candle closes.
I will be making a price action publish soon if that is of interest to the public.
在腳本中搜尋"trendline"

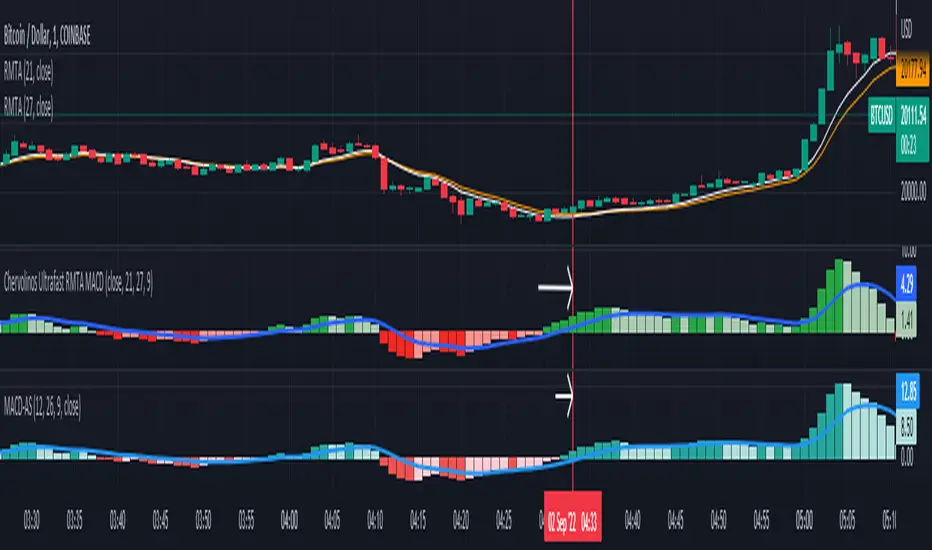
Chervolinos Ultrafast RMTA MACDDescription of a classic MACD:
MACD, short for moving average convergence/divergence, is a trading indicator used in technical analysis of stock prices, created by Gerald Appel in the late 1970s. It is designed to reveal changes in the strength, direction, momentum, and duration of a trend in a stock's price. The MACD indicator (or "oscillator") is a collection of three time series calculated from historical price data, most often the closing price. These three series are: the MACD series proper, the "signal" or "average" series, and the "divergence" series which is the difference between the two. The MACD series is the difference between a "fast" (short period) exponential moving average (EMA), and a "slow" (longer period) EMA of the price series. The average series is an EMA of the MACD series itself. The MACD indicator thus depends on three time parameters, namely the time constants of the three EMAs. The notation "MACD" usually denotes the indicator where the MACD series is the difference of EMAs with characteristic times a and b, and the average series is an EMA of the MACD series with characteristic time c. These parameters are usually measured in days. The most commonly used values are 12, 26, and 9 days, that is, MACD. As true with most of the technical indicators, MACD also finds its period settings from the old days when technical analysis used to be mainly based on the daily charts. The reason was the lack of the modern trading platforms which show the changing prices every moment. As the working week used to be 6-days, the period settings of represent 2 weeks, 1 month and one and a half week. Now when the trading weeks have only 5 days, possibilities of changing the period settings cannot be overruled. However, it is always better to stick to the period settings which are used by the majority of traders as the buying and selling decisions based on the standard settings further push the prices in that direction.
Description of the new Ultrafast RMTA MACD:
Ultrafast RMTA MACD, short for moving average convergence/divergence, is a trading indicator used in technical analysis of stock prices, created by Chervolino. It is designed to reveal changes in the strength,
direction, momentum, and duration of a trend in a stock's price. The RMTA MACD indicator (or "oscillator") is a collection of three time series calculated from historical price data, from the closing price.
The RMTA MACD based on the THE RECURSIVE MOVING TRENDLINE SYSTEM technical.traders.com
and is series is the difference between a "fast" (short period) Recursive Moving Trend Average, and a "slow" (longer period) Recursive Moving Trend Average of the price series. The average series is an EMA of the MACD series itself.
The result is a non laging indicator, depends on the settings.
special thanks to
everget
LonesomeTheBlue
Chameleon [FST]
This is a Technical Trading strategy with multiple technical indicators as confirmations.
Indicators
MA
EMA
ATR
OSCILLATOR
DESCRIPTION
Inputs
Risk/Reward ratio . Stop Loss and Take profit price distance is the same, i.e. SL 25 pips, TP 25 pips. You can increase the profit target ideally for an Experienced trader; for example, using 25 pips stop Loss & 37.5 pips take profit or 25 pips stop Loss & 50 pips take profit.
SETTINGS
Look back 1 & 2. Look back at 'period', and this help to filter how many bars to a trend. Look-back 1&2 are a form of moving average and exponential moving average calculation.
Look back 1 filter longer-term-trend.
Look back 2 filter short-term-trend.
SAP.M.A
Period . This helps to process possible areas of entry if a trend is confirmed.
SAP Multiplier . This helps us to calculate the possible area of early or late entry and take-profit/stop-loss price.
Style
Channel Ten-Top & Bottom= Two EMA Period 10, Source High and Source Low forming a channel (optional).
How to use the Signals as seen in the attached screenshot
1. You can apply trendline channels to trade the signals only if the price movement is in the channel.
2. Apply Support and Resistant line to assist. For Uptrend=Apply support line, look for a Buy signal and Downtrend= Apply Resistant line, look for a sell signal
3. With the help of this indicator, you can use it to filter your strategy entries.
4. If you understand technical analysis plus trend trading, you can increase the Reward to maximise the potential profit target.
The above indicators description identifies market trends with optional visual risk to reward and buy/sell alerts on the chart.
Available on all time frames.
The "Buy and Sell Confirmation" is a composite indicator of Moving Averages, which triggers technical signals when it crosses MA, EMA and OSCILLATORS above (to buy) or below (to sell) its signal line if the price above or below the indicator transformed into a trend, which is taken as a signal of buy and sell.
The Auto generates R: R "risk to reward" is well calculated; these can help beginners know where to place their Take Profit and Stop Loss, erasing that fear of what to do next.
The indicator is for every type of market: indices, stocks, cryptocurrencies, currencies and others.
Most traders don't know when to ride the trend or get out of a losing/winning trade.
This trading system will eliminate 70% of the doubt about the above.
This strategy is not a guaranteed profit. Therefore, it is recommended that you should backtest or trade virtual money before using this study on your entire portfolio, as it is intended to be a tool and not a holy grail.
Beware of the ranging/consolidation market to avoid false signals.
Disclaimer: Trading and investing in the Forex, Stock Market and Cryptocurrencies involves substantial risk of Loss and is not suitable for every investor. The content covered in this study is NOT to be considered investment advice. I'm NOT a financial adviser. All trading strategies are used at your own risk.

TR_HighLow_LibLibrary "TR_HighLow_Lib"
TODO: add library description here
ShowLabel(_Text, _X, _Y, _Style, _Size, _Yloc, _Color)
TODO: Function to display labels
Parameters:
_Text : TODO: text (series string) Label text.
_X : TODO: x (series int) Bar index.
_Y : TODO: y (series int/float) Price of the label position.
_Style : TODO: style (series string) Label style.
_Size : TODO: size (series string) Label size.
_Yloc : TODO: yloc (series string) Possible values are yloc.price, yloc.abovebar, yloc.belowbar.
_Color : TODO: color (series color) Color of the label border and arrow
Returns: TODO: No return values
GetColor(_Index)
TODO: Function to take out 12 colors in order
Parameters:
_Index : TODO: color number.
Returns: TODO: color code
Tbl_position(_Pos)
TODO: Table display position function
Parameters:
_Pos : TODO: position.
Returns: TODO: Table position
DeleteLine()
TODO: Delete Line
Parameters:
: TODO: No parameter
Returns: TODO: No return value
DeleteLabel()
TODO: Delete Label
Parameters:
: TODO: No parameter
Returns: TODO: No return value
ZigZag(_a_PHiLo, _a_IHiLo, _a_FHiLo, _a_DHiLo, _Histories, _Provisional_PHiLo, _Provisional_IHiLo, _Color1, _Width1, _Color2, _Width2, _ShowLabel, _ShowHighLowBar, _HighLowBarWidth, _HighLow_LabelSize)
TODO: Draw a zig-zag line.
Parameters:
_a_PHiLo : TODO: High-Low price array
_a_IHiLo : TODO: High-Low INDEX array
_a_FHiLo : TODO: High-Low flag array sequence 1:High 2:Low
_a_DHiLo : TODO: High-Low Price Differential Array
_Histories : TODO: Array size (High-Low length)
_Provisional_PHiLo : TODO: Provisional High-Low Price
_Provisional_IHiLo : TODO: Provisional High-Low INDEX
_Color1 : TODO: Normal High-Low color
_Width1 : TODO: Normal High-Low width
_Color2 : TODO: Provisional High-Low color
_Width2 : TODO: Provisional High-Low width
_ShowLabel : TODO: Label display flag True: Displayed False: Not displayed
_ShowHighLowBar : TODO: High-Low bar display flag True:Show False:Hide
_HighLowBarWidth : TODO: High-Low bar width
_HighLow_LabelSize : TODO: Label Size
Returns: TODO: No return value
TrendLine(_a_PHiLo, _a_IHiLo, _Histories, _MultiLine, _StartWidth, _EndWidth, _IncreWidth, _StartTrans, _EndTrans, _IncreTrans, _ColorMode, _Color1_1, _Color1_2, _Color2_1, _Color2_2, _Top_High, _Top_Low, _Bottom_High, _Bottom_Low)
TODO: Draw a Trend Line
Parameters:
_a_PHiLo : TODO: High-Low price array
_a_IHiLo : TODO: High-Low INDEX array
_Histories : TODO: Array size (High-Low length)
_MultiLine : TODO: Draw a multiple Line.
_StartWidth : TODO: Line width start value
_EndWidth : TODO: Line width end value
_IncreWidth : TODO: Line width increment value
_StartTrans : TODO: Transparent rate start value
_EndTrans : TODO: Transparent rate finally
_IncreTrans : TODO: Transparent rate increase value
_ColorMode : TODO: 0:Nomal 1:Gradation
_Color1_1 : TODO: Gradation Color 1_1
_Color1_2 : TODO: Gradation Color 1_2
_Color2_1 : TODO: Gradation Color 2_1
_Color2_2 : TODO: Gradation Color 2_2
_Top_High : TODO: _Top_High Value for Gradation
_Top_Low : TODO: _Top_Low Value for Gradation
_Bottom_High : TODO: _Bottom_High Value for Gradation
_Bottom_Low : TODO: _Bottom_Low Value for Gradation
Returns: TODO: No return value
Fibonacci(_a_Fibonacci, _a_PHiLo, _Provisional_PHiLo, _Index, _FrontMargin, _BackMargin)
TODO: Draw a Fibonacci line
Parameters:
_a_Fibonacci : TODO: Fibonacci Percentage Array
_a_PHiLo : TODO: High-Low price array
_Provisional_PHiLo : TODO: Provisional High-Low price (when _Index is 0)
_Index : TODO: Where to draw the Fibonacci line
_FrontMargin : TODO: Fibonacci line front-margin
_BackMargin : TODO: Fibonacci line back-margin
Returns: TODO: No return value
Fibonacci(_a_Fibonacci, _a_PHiLo, _Provisional_PHiLo, _Index1, _FrontMargin1, _BackMargin1, _Transparent1, _Index2, _FrontMargin2, _BackMargin2, _Transparent2)
TODO: Draw a Fibonacci line
Parameters:
_a_Fibonacci : TODO: Fibonacci Percentage Array
_a_PHiLo : TODO: High-Low price array
_Provisional_PHiLo : TODO: Provisional High-Low price (when _Index is 0)
_Index1 : TODO: Where to draw the Fibonacci line 1
_FrontMargin1 : TODO: Fibonacci line front-margin 1
_BackMargin1 : TODO: Fibonacci line back-margin 1
_Transparent1 : TODO: Transparent rate 1
_Index2 : TODO: Where to draw the Fibonacci line 2
_FrontMargin2 : TODO: Fibonacci line front-margin 2
_BackMargin2 : TODO: Fibonacci line back-margin 2
_Transparent2 : TODO: Transparent rate 2
Returns: TODO: No return value
High_Low_Judgment(_Length, _Extension, _Difference)
TODO: Judges High-Low
Parameters:
_Length : TODO: High-Low Confirmation Length
_Extension : TODO: Length of extension when the difference did not open
_Difference : TODO: Difference size
Returns: TODO: _HiLo=High-Low flag 0:Neither high nor low、1:High、2:Low、3:High-Low
_PHi=high price、_PLo=low price、_IHi=High Price Index、_ILo=Low Price Index、
_Cnt=count、_ECnt=Extension count、
_DiffHi=Difference from Start(High)、_DiffLo=Difference from Start(Low)、
_StartHi=Start value(High)、_StartLo=Start value(Low)
High_Low_Data_AddedAndUpdated(_HiLo, _Histories, _PHi, _PLo, _IHi, _ILo, _DiffHi, _DiffLo, _a_PHiLo, _a_IHiLo, _a_FHiLo, _a_DHiLo)
TODO: Adds and updates High-Low related arrays from given parameters
Parameters:
_HiLo : TODO: High-Low flag
_Histories : TODO: Array size (High-Low length)
_PHi : TODO: Price Hi
_PLo : TODO: Price Lo
_IHi : TODO: Index Hi
_ILo : TODO: Index Lo
_DiffHi : TODO: Difference in High
_DiffLo : TODO: Difference in Low
_a_PHiLo : TODO: High-Low price array
_a_IHiLo : TODO: High-Low INDEX array
_a_FHiLo : TODO: High-Low flag array 1:High 2:Low
_a_DHiLo : TODO: High-Low Price Differential Array
Returns: TODO: _PHiLo price array、_IHiLo indexed array、_FHiLo flag array、_DHiLo price-matching array、
Provisional_PHiLo Provisional price、Provisional_IHiLo 暫定インデックス
High_Low(_a_PHiLo, _a_IHiLo, _a_FHiLo, _a_DHiLo, _a_Fibonacci, _Length, _Extension, _Difference, _Histories, _ShowZigZag, _ZigZagColor1, _ZigZagWidth1, _ZigZagColor2, _ZigZagWidth2, _ShowZigZagLabel, _ShowHighLowBar, _ShowTrendLine, _TrendMultiLine, _TrendStartWidth, _TrendEndWidth, _TrendIncreWidth, _TrendStartTrans, _TrendEndTrans, _TrendIncreTrans, _TrendColorMode, _TrendColor1_1, _TrendColor1_2, _TrendColor2_1, _TrendColor2_2, _ShowFibonacci1, _FibIndex1, _FibFrontMargin1, _FibBackMargin1, _FibTransparent1, _ShowFibonacci2, _FibIndex2, _FibFrontMargin2, _FibBackMargin2, _FibTransparent2, _ShowInfoTable1, _TablePosition1, _ShowInfoTable2, _TablePosition2)
TODO: Draw the contents of the High-Low array.
Parameters:
_a_PHiLo : TODO: High-Low price array
_a_IHiLo : TODO: High-Low INDEX array
_a_FHiLo : TODO: High-Low flag sequence 1:High 2:Low
_a_DHiLo : TODO: High-Low Price Differential Array
_a_Fibonacci : TODO: Fibonacci Gnar Matching
_Length : TODO: Length of confirmation
_Extension : TODO: Extension Length of extension when the difference did not open
_Difference : TODO: Difference size
_Histories : TODO: High-Low Length
_ShowZigZag : TODO: ZigZag Display
_ZigZagColor1 : TODO: Colors of ZigZag1
_ZigZagWidth1 : TODO: Width of ZigZag1
_ZigZagColor2 : TODO: Colors of ZigZag2
_ZigZagWidth2 : TODO: Width of ZigZag2
_ShowZigZagLabel : TODO: ZigZagLabel Display
_ShowHighLowBar : TODO: High-Low Bar Display
_ShowTrendLine : TODO: Trend Line Display
_TrendMultiLine : TODO: Trend Multi Line Display
_TrendStartWidth : TODO: Line width start value
_TrendEndWidth : TODO: Line width end value
_TrendIncreWidth : TODO: Line width increment value
_TrendStartTrans : TODO: Starting transmittance value
_TrendEndTrans : TODO: Transmittance End Value
_TrendIncreTrans : TODO: Increased transmittance value
_TrendColorMode : TODO: color mode
_TrendColor1_1 : TODO: Trend Color 1_1
_TrendColor1_2 : TODO: Trend Color 1_2
_TrendColor2_1 : TODO: Trend Color 2_1
_TrendColor2_2 : TODO: Trend Color 2_2
_ShowFibonacci1 : TODO: Fibonacci1 Display
_FibIndex1 : TODO: Fibonacci1 Index No.
_FibFrontMargin1 : TODO: Fibonacci1 Front margin
_FibBackMargin1 : TODO: Fibonacci1 Back Margin
_FibTransparent1 : TODO: Fibonacci1 Transmittance
_ShowFibonacci2 : TODO: Fibonacci2 Display
_FibIndex2 : TODO: Fibonacci2 Index No.
_FibFrontMargin2 : TODO: Fibonacci2 Front margin
_FibBackMargin2 : TODO: Fibonacci2 Back Margin
_FibTransparent2 : TODO: Fibonacci2 Transmittance
_ShowInfoTable1 : TODO: InfoTable1 Display
_TablePosition1 : TODO: InfoTable1 position
_ShowInfoTable2 : TODO: InfoTable2 Display
_TablePosition2 : TODO: InfoTable2 position
Returns: TODO: 無し

TR_HighLowLibrary "TR_HighLow"
TODO: add library description here
ShowLabel(_Text, _X, _Y, _Style, _Size, _Yloc, _Color)
TODO: Function to display labels
Parameters:
_Text : TODO: text (series string) Label text.
_X : TODO: x (series int) Bar index.
_Y : TODO: y (series int/float) Price of the label position.
_Style : TODO: style (series string) Label style.
_Size : TODO: size (series string) Label size.
_Yloc : TODO: yloc (series string) Possible values are yloc.price, yloc.abovebar, yloc.belowbar.
_Color : TODO: color (series color) Color of the label border and arrow
Returns: TODO: No return values
GetColor(_Index)
TODO: Function to take out 12 colors in order
Parameters:
_Index : TODO: color number.
Returns: TODO: color code
Tbl_position(_Pos)
TODO: Table display position function
Parameters:
_Pos : TODO: position.
Returns: TODO: Table position
DeleteLine()
TODO: Delete Line
Parameters:
: TODO: No parameter
Returns: TODO: No return value
DeleteLabel()
TODO: Delete Label
Parameters:
: TODO: No parameter
Returns: TODO: No return value
ZigZag(_a_PHiLo, _a_IHiLo, _a_FHiLo, _a_DHiLo, _Histories, _Provisional_PHiLo, _Provisional_IHiLo, _Color1, _Width1, _Color2, _Width2, _ShowLabel, _ShowHighLowBar, _HighLowBarWidth, _HighLow_LabelSize)
TODO: Draw a zig-zag line.
Parameters:
_a_PHiLo : TODO: High-Low price array
_a_IHiLo : TODO: High-Low INDEX array
_a_FHiLo : TODO: High-Low flag array sequence 1:High 2:Low
_a_DHiLo : TODO: High-Low Price Differential Array
_Histories : TODO: Array size (High-Low length)
_Provisional_PHiLo : TODO: Provisional High-Low Price
_Provisional_IHiLo : TODO: Provisional High-Low INDEX
_Color1 : TODO: Normal High-Low color
_Width1 : TODO: Normal High-Low width
_Color2 : TODO: Provisional High-Low color
_Width2 : TODO: Provisional High-Low width
_ShowLabel : TODO: Label display flag True: Displayed False: Not displayed
_ShowHighLowBar : TODO: High-Low bar display flag True:Show False:Hide
_HighLowBarWidth : TODO: High-Low bar width
_HighLow_LabelSize : TODO: Label Size
Returns: TODO: No return value
TrendLine(_a_PHiLo, _a_IHiLo, _Histories, _MultiLine, _StartWidth, _EndWidth, _IncreWidth, _StartTrans, _EndTrans, _IncreTrans, _ColorMode, _Color1_1, _Color1_2, _Color2_1, _Color2_2, _Top_High, _Top_Low, _Bottom_High, _Bottom_Low)
TODO: Draw a Trend Line
Parameters:
_a_PHiLo : TODO: High-Low price array
_a_IHiLo : TODO: High-Low INDEX array
_Histories : TODO: Array size (High-Low length)
_MultiLine : TODO: Draw a multiple Line.
_StartWidth : TODO: Line width start value
_EndWidth : TODO: Line width end value
_IncreWidth : TODO: Line width increment value
_StartTrans : TODO: Transparent rate start value
_EndTrans : TODO: Transparent rate finally
_IncreTrans : TODO: Transparent rate increase value
_ColorMode : TODO: 0:Nomal 1:Gradation
_Color1_1 : TODO: Gradation Color 1_1
_Color1_2 : TODO: Gradation Color 1_2
_Color2_1 : TODO: Gradation Color 2_1
_Color2_2 : TODO: Gradation Color 2_2
_Top_High : TODO: _Top_High Value for Gradation
_Top_Low : TODO: _Top_Low Value for Gradation
_Bottom_High : TODO: _Bottom_High Value for Gradation
_Bottom_Low : TODO: _Bottom_Low Value for Gradation
Returns: TODO: No return value
Fibonacci(_a_Fibonacci, _a_PHiLo, _Provisional_PHiLo, _Index, _FrontMargin, _BackMargin)
TODO: Draw a Fibonacci line
Parameters:
_a_Fibonacci : TODO: Fibonacci Percentage Array
_a_PHiLo : TODO: High-Low price array
_Provisional_PHiLo : TODO: Provisional High-Low price (when _Index is 0)
_Index : TODO: Where to draw the Fibonacci line
_FrontMargin : TODO: Fibonacci line front-margin
_BackMargin : TODO: Fibonacci line back-margin
Returns: TODO: No return value
Fibonacci(_a_Fibonacci, _a_PHiLo, _Provisional_PHiLo, _Index1, _FrontMargin1, _BackMargin1, _Transparent1, _Index2, _FrontMargin2, _BackMargin2, _Transparent2)
TODO: Draw a Fibonacci line
Parameters:
_a_Fibonacci : TODO: Fibonacci Percentage Array
_a_PHiLo : TODO: High-Low price array
_Provisional_PHiLo : TODO: Provisional High-Low price (when _Index is 0)
_Index1 : TODO: Where to draw the Fibonacci line 1
_FrontMargin1 : TODO: Fibonacci line front-margin 1
_BackMargin1 : TODO: Fibonacci line back-margin 1
_Transparent1 : TODO: Transparent rate 1
_Index2 : TODO: Where to draw the Fibonacci line 2
_FrontMargin2 : TODO: Fibonacci line front-margin 2
_BackMargin2 : TODO: Fibonacci line back-margin 2
_Transparent2 : TODO: Transparent rate 2
Returns: TODO: No return value
High_Low_Judgment(_Length, _Extension, _Difference)
TODO: Judges High-Low
Parameters:
_Length : TODO: High-Low Confirmation Length
_Extension : TODO: Length of extension when the difference did not open
_Difference : TODO: Difference size
Returns: TODO: _HiLo=High-Low flag 0:Neither high nor low、1:High、2:Low、3:High-Low
_PHi=high price、_PLo=low price、_IHi=High Price Index、_ILo=Low Price Index、
_Cnt=count、_ECnt=Extension count、
_DiffHi=Difference from Start(High)、_DiffLo=Difference from Start(Low)、
_StartHi=Start value(High)、_StartLo=Start value(Low)
High_Low_Data_AddedAndUpdated(_HiLo, _Histories, _PHi, _PLo, _IHi, _ILo, _DiffHi, _DiffLo, _a_PHiLo, _a_IHiLo, _a_FHiLo, _a_DHiLo)
TODO: Adds and updates High-Low related arrays from given parameters
Parameters:
_HiLo : TODO: High-Low flag
_Histories : TODO: Array size (High-Low length)
_PHi : TODO: Price Hi
_PLo : TODO: Price Lo
_IHi : TODO: Index Hi
_ILo : TODO: Index Lo
_DiffHi : TODO: Difference in High
_DiffLo : TODO: Difference in Low
_a_PHiLo : TODO: High-Low price array
_a_IHiLo : TODO: High-Low INDEX array
_a_FHiLo : TODO: High-Low flag array 1:High 2:Low
_a_DHiLo : TODO: High-Low Price Differential Array
Returns: TODO: _PHiLo price array、_IHiLo indexed array、_FHiLo flag array、_DHiLo price-matching array、
Provisional_PHiLo Provisional price、Provisional_IHiLo 暫定インデックス
High_Low(_a_PHiLo, _a_IHiLo, _a_FHiLo, _a_DHiLo, _a_Fibonacci, _Length, _Extension, _Difference, _Histories, _ShowZigZag, _ZigZagColor1, _ZigZagWidth1, _ZigZagColor2, _ZigZagWidth2, _ShowZigZagLabel, _ShowHighLowBar, _ShowTrendLine, _TrendMultiLine, _TrendStartWidth, _TrendEndWidth, _TrendIncreWidth, _TrendStartTrans, _TrendEndTrans, _TrendIncreTrans, _TrendColorMode, _TrendColor1_1, _TrendColor1_2, _TrendColor2_1, _TrendColor2_2, _ShowFibonacci1, _FibIndex1, _FibFrontMargin1, _FibBackMargin1, _FibTransparent1, _ShowFibonacci2, _FibIndex2, _FibFrontMargin2, _FibBackMargin2, _FibTransparent2, _ShowInfoTable1, _TablePosition1, _ShowInfoTable2, _TablePosition2)
TODO: Draw the contents of the High-Low array.
Parameters:
_a_PHiLo : TODO: High-Low price array
_a_IHiLo : TODO: High-Low INDEX array
_a_FHiLo : TODO: High-Low flag sequence 1:High 2:Low
_a_DHiLo : TODO: High-Low Price Differential Array
_a_Fibonacci : TODO: Fibonacci Gnar Matching
_Length : TODO: Length of confirmation
_Extension : TODO: Extension Length of extension when the difference did not open
_Difference : TODO: Difference size
_Histories : TODO: High-Low Length
_ShowZigZag : TODO: ZigZag Display
_ZigZagColor1 : TODO: Colors of ZigZag1
_ZigZagWidth1 : TODO: Width of ZigZag1
_ZigZagColor2 : TODO: Colors of ZigZag2
_ZigZagWidth2 : TODO: Width of ZigZag2
_ShowZigZagLabel : TODO: ZigZagLabel Display
_ShowHighLowBar : TODO: High-Low Bar Display
_ShowTrendLine : TODO: Trend Line Display
_TrendMultiLine : TODO: Trend Multi Line Display
_TrendStartWidth : TODO: Line width start value
_TrendEndWidth : TODO: Line width end value
_TrendIncreWidth : TODO: Line width increment value
_TrendStartTrans : TODO: Starting transmittance value
_TrendEndTrans : TODO: Transmittance End Value
_TrendIncreTrans : TODO: Increased transmittance value
_TrendColorMode : TODO: color mode
_TrendColor1_1 : TODO: Trend Color 1_1
_TrendColor1_2 : TODO: Trend Color 1_2
_TrendColor2_1 : TODO: Trend Color 2_1
_TrendColor2_2 : TODO: Trend Color 2_2
_ShowFibonacci1 : TODO: Fibonacci1 Display
_FibIndex1 : TODO: Fibonacci1 Index No.
_FibFrontMargin1 : TODO: Fibonacci1 Front margin
_FibBackMargin1 : TODO: Fibonacci1 Back Margin
_FibTransparent1 : TODO: Fibonacci1 Transmittance
_ShowFibonacci2 : TODO: Fibonacci2 Display
_FibIndex2 : TODO: Fibonacci2 Index No.
_FibFrontMargin2 : TODO: Fibonacci2 Front margin
_FibBackMargin2 : TODO: Fibonacci2 Back Margin
_FibTransparent2 : TODO: Fibonacci2 Transmittance
_ShowInfoTable1 : TODO: InfoTable1 Display
_TablePosition1 : TODO: InfoTable1 position
_ShowInfoTable2 : TODO: InfoTable2 Display
_TablePosition2 : TODO: InfoTable2 position
Returns: TODO: 無し

Supply and Demand MultiTimeFrameWhat Is the Law of Supply and Demand?
The law of supply and demand is a theory that explains the interaction between the sellers of a resource and the buyers for that resource . The theory defines the relationship between the price of a given good or product and the willingness of people to either buy or sell it. Generally, as price increases, people are willing to supply more and demand less and vice versa when the price falls. ( -Investopedia )
This Indicator Help's you to find possible Supply and Demand zones formed on chart on MultiTimeFrame.
All the Supply Zones are colored RED and are above the current price. It will vanish once price crosses over it.
All the Demand Zones are colored GREEN and are below the current price. It will vanish once price crosses under it.
Only Untested Zone are plotted on chart.
These zones can be plotted on Chart TimeFrame as well as MultiTimeFrame(Higher). That can be selected from Input Section.
Concept Behind the Zones
1. Rally Base Rally
2. Drop Base Drop
3. Drop Base Rally
4. Rally Base Drop
Drop base rally
Rally base drop
rally base rally
drop base drop
For Supply zones we try to find "Drop Base Drop" and "Rally Base Drop" , and plot RED zones on the width of base. Base can include any number of candle ranging from 1 to 6. This can be controlled from Input Section
For Demand zones we try to find "Rally Base Rally" and "Drop Base Rally" , and plot GREEN zones on the width of base. Base can include any number of candle ranging from 1 to 6. This can be controlled from Input Section
How to Trade
We recommend to use 5-8 time Higher TimeFrame as Supply and Demand Zones. For Example if chart is at 5 min Timeframe then Zones should be plotted on 25 min to 40 min TImeframe.
And when Price reaches closer to Supply/ Demand Zone then use some other indicator to confirm the reversal from that level, like trendline , moving average etc.
Targets should be nearest Supply/ Demand Zone .

Auto Trendline Indicator (based on fractals)A tool that automatically draws out trend lines by connecting the most recent fractals.
Description:
The process of manual drawing out trend lines is highly subjective. Many times, we don’t trade what we see, but what we “want to see”. As a result, we draw lines pointing to the direction that we wishfully want price to move towards. While there are no right/wrong ways to draw trend lines, there are, however, systematic/unsystematic ways to draw trend lines. This tool will systematically draw out trend lines based on fractals.
Additional feature:
This tool will also plot out symbols (default symbol “X”) to signify points of crossings. This can be useful for traders considering to use trend lines as part of their trading strategies.
Here is an interesting observation on the price actions of NASDAQ futures on a 5 second chart during regular trading hours on July 14, 2022.
It’s a phenomenon. People like to see straight lines connecting HL/LH, etc., so it's possible for the market as a whole to psychologically react to these lines. However, it is important to note that is is impossible to predict the direction of price. In the case above, price could have tanked below auto-drawn trend line. Fractal based trend lines should only be taken as references and regarded as price levels. No studies have ever proven that the slope of trend lines can indicate price's future direction.
More about fractals:
To understand more about fractals:
www.investopedia.com
www.tradingview.com
Contrary to what it sounds like, fractal in "technical analysis" does not refer to the recursive self-repeating patterns that appear in nature, such as the mesmerizing patterns found in snowflakes. The Fractal Markets Hypothesis claims that market prices exhibit fractal properties over time. Assuming this assertion to be true, then fractals can be used a tool to represent the chaotic movements of price is a simplified manner.
The purpose of this exercise is to take a tool that is readily available (ie. in this case, TradingView’s built-in fractals tool), and to create a newer tool based on it.
Parameters:
Fractal period (denoted as ‘n’ in code): It is the number of bars bounding a high/low point that must be lower/higher than it, respectively, in order for fractal to be considered valid. Period ‘n’ can be adjusted in this tool. Traditionally, chartists pick the value of 5. The longer it is, the less noise seen on the chart, and the pivot point may also be exhibited in higher timeframes. The drawback is that it will increase the period of lag, and it will take more bars to confirm the printed fractal.
Others: Intuitive parameters such as whether to draw historical trend lines, what color to use, which way to extend the lines, and whether or not to show points of crossings.

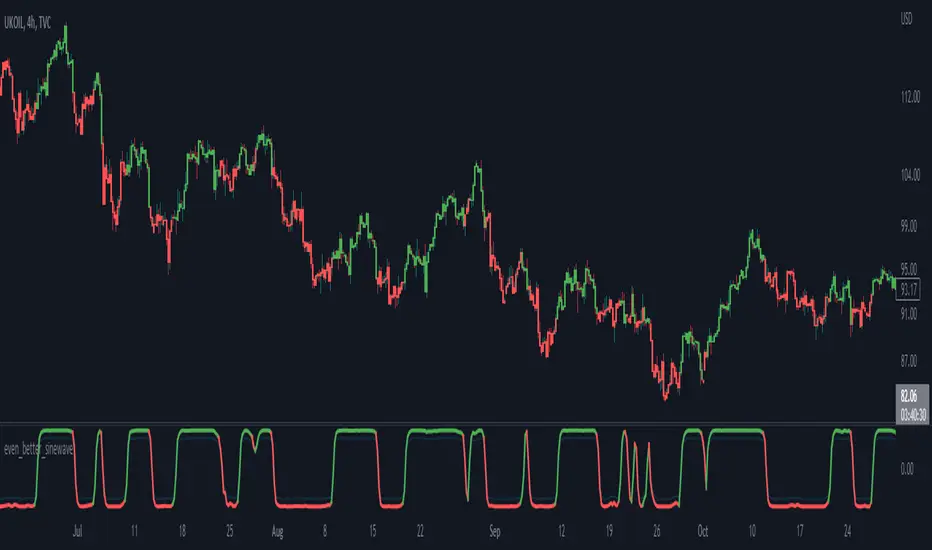
even_better_sinewave_mod
Description:
Even better sinewave was an indicator developed by John F. Ehlers (see Cycle Analytics for Trader, pg. 159), in which improvement to cycle measurements completely relies on strong normalization of the waveform. The indicator aims to create an artificially predictive indicator by transferring the cyclic data swings into a sine wave. In this indicator, the modified is on the weighted moving average as a smoothing function, instead of using the super smoother, aim to be more adaptive, and the default length is set to 55 bars.
Sinewave
smoothing = (7*hp + 6*hp_1 + 5*hp_2+ 4*hp_3 + 3*hp_4 + 2*hp5 + hp_6) /28
normalize = wave/sqrt(power)
Notes:
sinewave indicator crossing over -0.9 is considered to beginning of the cycle while crossing under 0.9 is considered as an end of the cycle
line color turns to green considered as a confirmation of an uptrend, while turns red as a confirmation of a downtrend
confidence of using indicator will be much in confirmation paired with another indicator such dynamic trendline e.g. moving average
as cited within Ehlers book Cycle Analytic for Traders, the indicator will be useful if the satisfied market cycle mode and the period of the dominant cycle must be estimated with reasonable accuracy
Other Example
Pivot TrendLine with Divergence█ OVERVIEW
Automatically draws divergence trends on your charts.
█ CONCEPTS
Key features
• The script would find all pivot points using built-in functions.
• Then it would calculate the RSI/MACD level at those pivot bars.
• At last we're using RSI/MACD divergence as a filter to plot marks on your chart.
█ NOTICE
This script would REPAINT based on the pivot length settings. Indicators are just simple tools to demonstrate price trends, they can not predict trends.
Please keep that in mind.
Use at your own risk.
═════════════════════════════════════════════════════════════════════════
Feel free to leave comments below, this is still an experimental script.

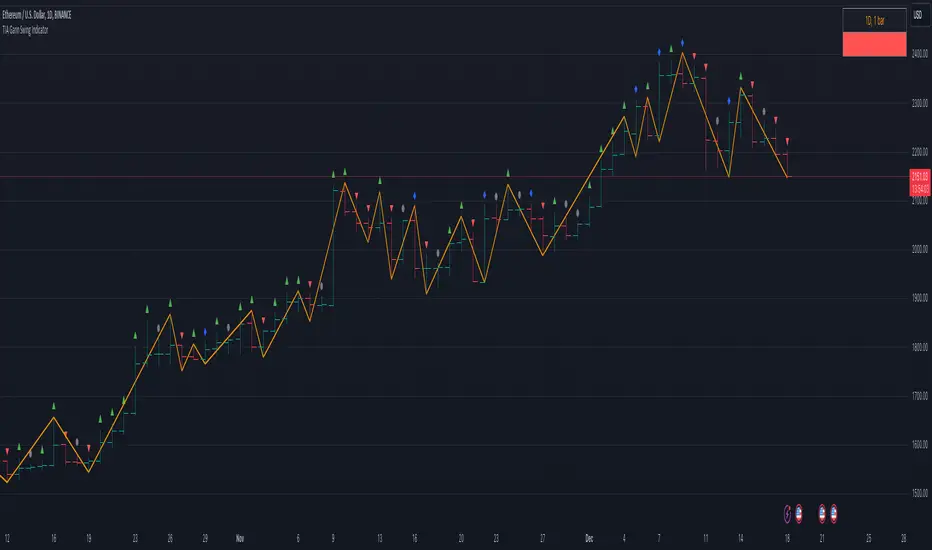
TIA Gann Swing IndicatorTIA Gann Swing Indicator
This indicator is a mechanical tool that tells the user exactly what the market trend is at any time, based on the teachings of Legendary trader, Mr. William D. Gann .
Gann called this tool the “Trendline Indicator,” but it has popularly become known as the “Swing Chart” by present-day traders.
In October 1909, Richard Wyckoff watched Gann for 25 market days (the markets traded on Saturdays back then), where Gann made 286 trades, both long and short. Two hundred sixty-four (264) of these trades were profits.
The Swing Chart was Gann’s primary trading tool helping him achieve these phenomenal trading results.
This indicator, now available to you in TradingView, automatically displays the swing chart and trend on any timeframe.
Selecting “Show Trend,” will light the background of the chart up, showing if the trend is “Up,” “Down,” or “Uncertain.”
The indicator is also fully customizable to display “Break Lines,” which indicate potential trend changes ahead of time.
Additional features include data about each bar and swing to give the user vital information, and the data points currently available include:
Bar Type
This indicator selection allows the user to identify precisely what each bar is, as per WD Gann’s Instructions.
Each of the 4 bar types includes:
Up bars, Down bars, Inside bars, Outside bars
Date
Displaying the date of swing tops and bottoms allows the user to stay on top of significant announcements and events in the economy. Often, market reversals occur right around critical economic events.
Time
This indicator selection allows the user to identify the time of the swing tops and swing bottoms. Designed for intra-day traders, this setting displays the exact time of tops and bottoms on any timeframe to help stay ahead of any important announcement.
Price
Price analysis is critical for every technical analyst, and displaying the price of swing tops and bottoms allows the trader or investor to stay on top of essential pivot points in the market. Identifying potential support and resistance levels keeps traders ahead of the herd.
Range
Identifying each swing’s price range gives the trader or investor critical information. Have you ever wondered if a market is gaining momentum or losing momentum? Knowing if price ranges are expanding or contracting is key, and this setting quickly displays what every swing range is doing.
Bar Count
What is the average number of bars up or down? Markets can only move in one direction for so many bars before a reversal. Simply displaying the number of bars between each swing gives the analyst valuable insights into overbought or oversold trends. Gann's famous “7-10 bar” rule identifies potential reversals, and this simple indicator setting can help any market participant stay ahead of the pack.
The TIA Gann Swing Indicator is an indicator that EVERY trader & investor should have at their fingertips. It is critical for long-term investors and short-term traders to know the trend of their market and vital information about the upswings and downswings. The TIA Gann Swing Indicator is the indicator to help.
See the Author's instructions below to get access to this package.
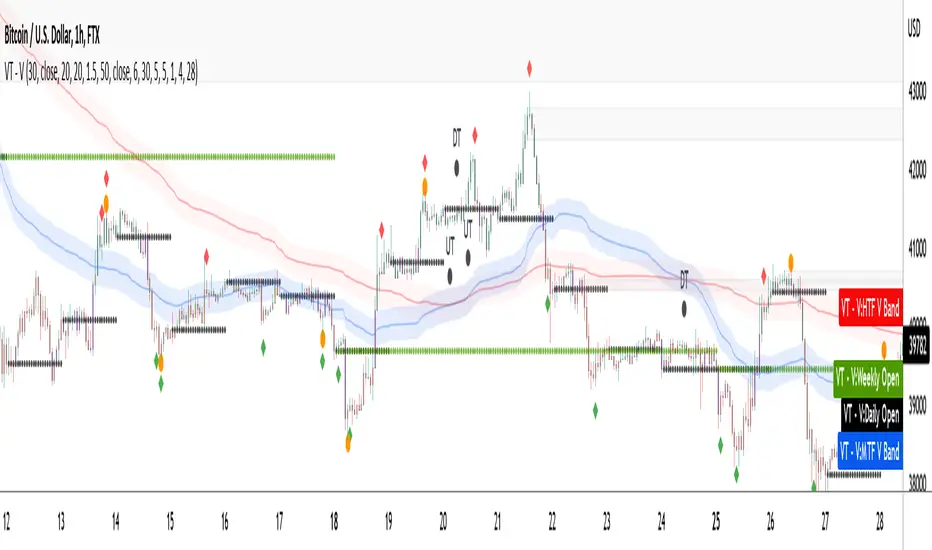
VTrend - Volume ScriptThe Volume script is designed to help you trade the market more efficiently, giving you a lot of information to intrepret, based on volume calculations.
The fundamental part of the script, is the volume weighted bands in blue and red, which help determine the trend and dynamic support and resistance. The blue band is a shorter length than the red band.
When the blue band dips below the red band, this tells us there is a downtrend. And when the blue band is trending above the red band, this is bullish uptrend price action. You will be able to note price whatever the timeframe really respects these bands, and you can use that to your advantage flicking through the high timeframes on where price will go next, combined with your own support and resistance levels.
The other most important aspects are the bar colors and the colored bollinger band line. Whenever price action is above the blue band the bars are green, when closing within the blue band, they are orange to show possible resistance or support. Below the blue band the bars are red for downtrend price action.
When the bars are bouncing off the daily open, a key level for you to play off everyday and makes it easier to gauge what price is doing, the bars are colored purple to highlight this.
The bollinger band line serves to act as a trendline, to help identify where price is going combined with the information above in the short term, and allows you to pick entry points more finely. There are also two bollinger band clouds in the background, which are areas to look at reversal or support for. You can turn these off if you wish, as not to clog up the chart.
Next feature up, are the reversal signals, which also double as areas to take profit. The default are the diamond reversal plots.
Enabled by default also are the custom leledc exhaustion plots, the major signals are enabled by default, whilst the minor signals are not turned on and are very noisy by comparison, especially at low timeframes.
You'll notice in the screenshot below, there is a black MA, that is an adjustable Hull Moving Average included for determining shorter term trend movements combined with the bollinger band colored line, depending on your trading style.
The image below shows when both major and minor leledc signals are turned on.
Also we have circular colored plots showing different reversal calculations, you can use them as a guide and take profit areas. These are based on candle type, and i consider them noisy especially at low time frames.
The indicator is designed to give you key information, but be quite customisable as well to suit your exact trading style.
Recommended timeframes i use this on; Weekly (for key liquidity areas), Trading on the Daily, 6h, 4h, 2h, 1h, and 25 minutes.
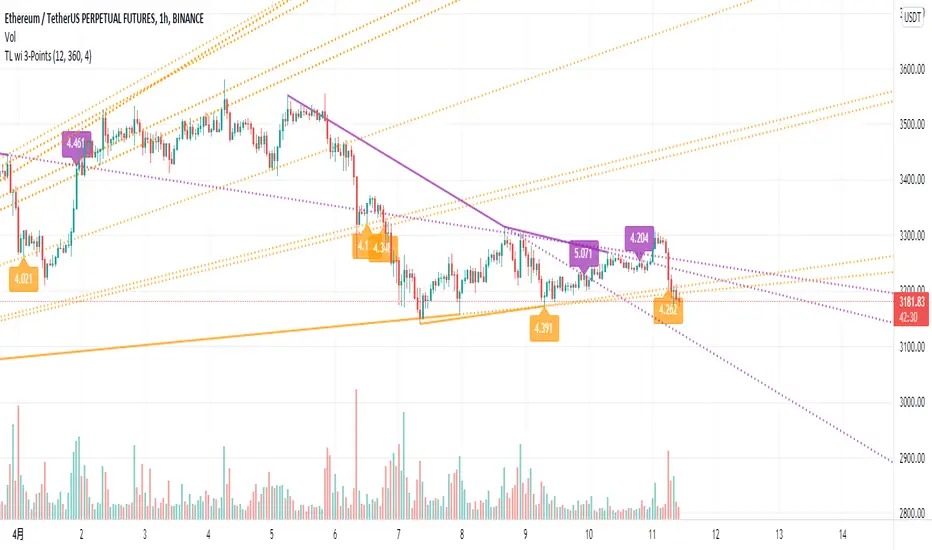
Trend Line wi 3-PointsHello, my friends. This is a new version of the trend line regression indicator, which always finds quantitive trend lines with three key points.
(1) Indicator description
This indicator finds a trend line with three key points on the historical K-line
Solving the problem of calculation timeout based on a faster trend line regression algorithm
Supports filtering unwanted trend lines by setting a trendline strength threshold
It's suitable for most markets and timeframes
(2) Key parameters
- Pivot High/Low Settings
Pivot Lookback Left: Number of K-lines to look back left from the pivot top/bottom
Pivot Lookback Right: Number of K-lines to look back right from the pivot top/bottom
- Trend Line Regression
Max of Lookback Forward: The maximum number of historical K-lines
Min Regression Strength: The minimum strength threshold for trend line regression
Multiply Regression Std: The width of the trend line to display on the chart
(3) Script description
Due to some circumstances that I don't want to see, subsequent scripts will not be open source, but you can still use the script for free. Thanks for your understanding and support!
If you have any suggestions or comments about the script, please feel free to leave your comments!
Happy trading, and enjoy your life!
————————————————————————————————————————
各位朋友大家好,这是一个全新的趋势线回归指标。该指标总是会找到在图表中具有3个关键点的合理趋势线
(1) 指标说明
该指标在历史K线上找到具有3个关键点的趋势线,并绘制于图表上
基于更快速的趋势线回归算法,解决了计算超时的问题
支持通过设置趋势线强度阈值过滤不需要的趋势线
该指标适用于大部分市场和时间周期
(2) 关键参数
- Pivot High/Low Settings
Pivot Lookback Left: 枢纽顶/底点往左回顾的 K线 数量
Pivot Lookback Right: 枢纽顶/底点往右回顾的 K线 数量
- Trend Line Regression
Max of Lookback Forward: 回顾历史 K线 的最大数量
Min Regression Strength: 趋势线回归的最小强度阈值
Multiply Regression Std: 趋势线的显示宽度
(3) 脚本说明
因为出现了一些我不希望看到的情况,后续的脚本将不再开源代码,但是您依然可以免费使用该脚本,感谢理解和支持!
如果您存在对于该脚本的使用建议或者意见,欢迎各位留言!
祝大家交易愉快
Responsive Magnetic Moving Average - BreatEasyTraders,
It's pretty difficult to judge which moving average is holding the price at present (Holding = Prices Respecting the moving average). some times prices respects 20 MA, 50MA or some other MA or EMA or HMA. Its dynamic in nature and changes based on the script we apply and the timeframe we use.
Having all these different types of moving averages added on to chart may sometime create a clutter. Hence I came up with an idea to summarize into one value which price is respecting.
Important options provided to help adjusting the strength value.
1. No Of Candles = set the number of candles to analyze for the strength. Note: setting the value too less will improve the performance but accuracy is depleted. setting the value to too high may improve accuracy but performance may be depleted.
Performance = calculation time.
2. Close By% = in order to check whether price is respecting the trendline set the % of ATR. This means that when prices are close to any of the moving averages then it checks for the strength of the moving average.
Plz do suggest for any feedback for improvements.
Regards

TSLA Low Scalp PredictorThis is a re-post, as apparently I violated house rules with posting this the last time (yikes, sorry!).
I will re-post this, if this gets taken down again, then I give up on posting scripts :-).
Anyway, this is a tool I developed for scalping TSLA short. It is coded very simply, however, the variables that dictate the coding come from advanced, statistical calculations I have done with statistical software to permit PineScript to draw conclusions based on candlestick open and close prices.
This uses the candlestick open and close prices, compares with the statistical constants that correlate to TSLA low ranges using stock trading data since TSLA's nascence in 2010. I am not really sure how else to explain this (this was TV's issue, that they couldn't understand what the coding calculations, so I really hope that this all makes sense to the powers that be!), there is a lot of stats data behind these numbers and without explaining my whole PhD thesis, I really hope that this sufficiently articulates the basis to my indicator.
In a nutshell, it uses historic data to predict low levels of of TSLA, and this historic data is magically encoded in those statistical constants that are included in my indicator programming code. The power of numerical based data is a great deal can be said by very little :).
How to use?
The indicator will give you a red line that provides a projected low value.
To use the indicator, look for major gap ups in TSLA stock. As an example, I will provide a photo below of what to look for.
Once you have identified this gap up, then you will look to the highest point and from there, go down to the indicator line, draw a trend line from that highest point. This trendline would then become your price target (see the image below):
This is not foolproof and will not work all the time, as with any indicator! But it is fairly effective. In my opinion, it would be best applied with a support/resistance based price action strategy.
Anyway, I really hope that this sufficiently explains the indicator and its clear.
Please leave any questions you have in the comments below!
Please note, I have now protected my source code seeing that I have had to disclose a little more detail than liked about my process. There is a lot of interest on TV from others in my methods. I am not interested in taking peoples money or selling my strategy but I am also not interested in being taken advantage of or having my intellectual property stolen.
I am not interested in charging people for stuff. I truly want to just help and share in this interesting world of stock trading! But, there are people that will take advantage of people like me, so please understand the situation here. I am trying to balance what TV expects in terms of disclosure, disclose enough to help someone succeed all while trying to protect the integrity of my intellectual property. This is not an easy balancing act!
Thank you all and thank you Trading View for making a platform that is easily understood by someone with absolutely no coding experience :).

Pro Divergence [regular + hidden] by TradingClue█ Pro Divergence is my new divergence-based toolkit that will help you to spot lucrative opportunities in all kinds of markets.
I've developed toolkits and strategies that use divergences for many years, e.g. AutoDivergence and CCIDivergence . Pro Divergence is my latest development and benefits from those yearlong experiences.
The main algorithm to detect divergences has changed from using linear regressions and moving averages to algorithmic trendline detection like I've been using in TD Lines .
This new approach supports the detection of regular divergences but also hidden divergences can be identified.
Before going more into the details of the mechanics of Pro Divergence, let's recap, what divergences are all about when it comes to trading.
█ Regular Divergence
The basic idea is pretty simple: If price goes in the opposite direction than some other technical indicator - in most cases an oscillator - we speak of a divergence. A regular divergence might be a signal for a trend reversal. That's it.
For example, if the price is currently rising, while at the same time Momentum is falling - it might be time for a reversal and the price of an asset is about to fall soon. If there are additional indications to confirm the signal, e.g. if RSI is in the overbought area, it might be a good idea to go short on that specific asset.
Regular bullish divergences are indicated when price is forming lower lows while an oscillator shows higher lows.
Regular bearish divergences are indicated when price is forming higher highs while an oscillator shows lower highs.
█ Hidden Divergence
While regular divergences indicate trend reversals, hidden divergences indicate a trend continuation.
When the price is making higher lows and the oscillator is showing lower lows, we speak of a bullish hidden divergence. When the price is making lower highs and the oscillator shows higher highs, it's a bearish hidden divergence.
These rules for identifying divergences are pretty simple and straightforward. And they are also confusing at times. But that's what Pro Divergence is helping you with: trade based on customizable signals to identify all kinds of divergences.
You could either use the strategy settings of the toolkit to optimize the properties to show winning backtesting results. Or you use the signals as an extra confirmation to some other kind of signal/ strategy you are working with.
█ Summary of all current features
• Oscillator: choose between CCI, Momentum, MACD, or RSI. All oscillators-settings are customizable.
• RSI-filter: in some cases, the quality of the signals can be improved by an RSI filter, e.g. a bullish signal would only be valid if RSI is in the oversold area. Set the RSI period and the oversold/ overbought levels to your preferred values.
• You can display all divergences on the chart to get an idea of the current price action. Or you can pick any combination of signals you would like to include in a backtest. Possible signals are: regular bullish divergence, regular bearish divergence, hidden bullish divergence, hidden bearish divergence
• Exits: there are many ways to get exit signals - combinations of the below options are possible:
• fixed profit targets/ stop losses based on ticks
• Exit when momentum reverses
• Exit when price touches the opposite Bollinger Band (e.g. a long position will be closed when price touches the upper Bollinger Band). The settings for the Bollinger Bands are customizable.
• Entry: you can choose only to enter a trade if momentum is going in the same direction as the direction of your trade (e.g. only go long if momentum is rising)
• time and date filer
• Do a backtest only in a given time range (maybe you're not interested in the whole range of historical data when trading in a higher timeframe. Or you would like to do some kind of walk forward analysis)
• Only trade during special times of a day, e.g. only trade during the first hours of a trading session
Since this strategy is making heavy use of math and technical indicators, it is not tied to a certain asset class or timeframe. It was tested successfully on a large number of financial instruments like stocks, crypto, forex, and others.

[blackcat] L3 Supply and Demand Zones MTFLevel: 3
Background
Supply and Demand represent the two most powerful forces of the market. Demand means the number of buyers buying a security in the market. Supply means the number of sellers selling a security in the market. Large supply takes the price to move down and large demand takes the price to move up. Balance in both forces will keep the price in sideways movement. There are two types of states of the price of a security in technical analysis. 1. Balanced state; 2. Unbalanced state. In a balanced state, the price is moving in a range like moving sideways. Simply means forces of buyers and sellers are balanced. Both of them don’t have the ability to create a trend either bearish or bullish trend. After breakout of this sideways (range) movement of price, imbalance in price occur. And after the breakout, the recent range will be called a base zone and the price will again come to this base zone to pick unfilled orders.
Function
This is a composite supply and demand zone indicator, which inlcude:
1. demand and supply zones: yellow color box for demand zone while fuchsia color box for supply zone
2. half-semi log based fibo levels
3. multiple time frame (MTF) manual or automatic setting to see clear trend
4. tendline drawing. Default 610 bars back to draw, you can change it to your preferred value. However, you need to guarantee the existing chart already have equal or more than the number of bars you set or 610 bars.
5. blackcat reveral labels
6. box color to indicate volume information as:
box border color is green --> bullish
box boarder color is red --> bearish
box body color meanings:
a. turquoise or aqua or cyan box body color --> no volume indicaor signal or NA --> no supply and demand signal
b. red box body color --> volume climax up - strong bullish high volume --> demand >> supply
c. white box body color --> volume climax down - strong bearish high volume --> supply >> demand
d. green box body color --> high volume churn - bars with high volume and low range --> suppy and demand is balancing
e. yellow box body color --> low Volume - bar for low volume --> bullish/bearish trend is exhausted, reversal may happen soon --> supply or demand dominance will be changed soon.
f. fuchsia box body color --> volume climax plus high volume churn --> two possibilities: red+green=fuchsia or white+green=fuchsia, so fuchsia is a mixed state --> srong demand with supply attack or strong supply with demand attack.
Remarks
Free but closed sourced.
If the trendline is not drawn but you can see the red resistance and green support dashed lines, please drag the the chart to the left unitl you see the yellow solid trend line appears.
This is the initial version. This will be contineously improved along time.

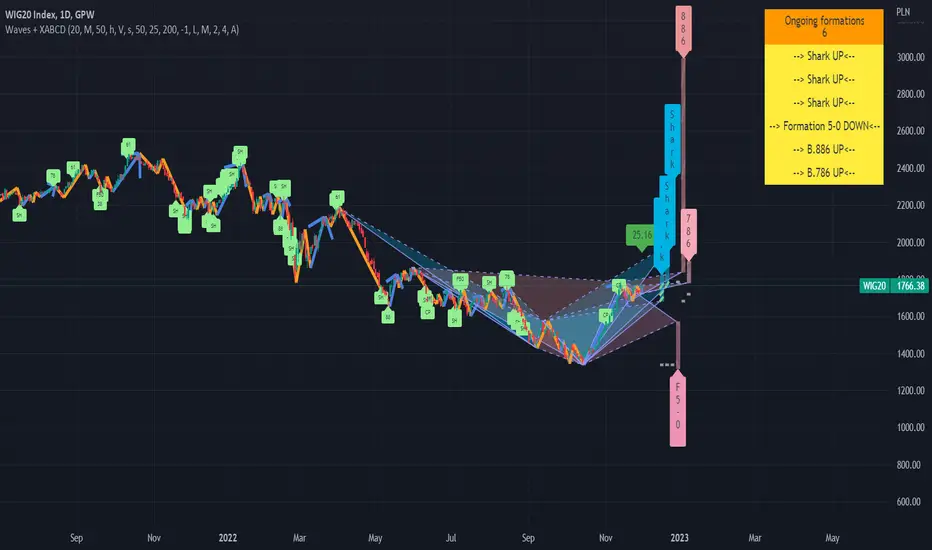
Waves + XABCD v.1.0Advanced harmonic patterns scanner optimazed for Wave theory for Low or Medium wave rules.
It finds on the candle chart:
- Existing pattern with realized target in historic data.
- Potencial patterns with realized and potencial targets.
- Estimated patterns that may become potencial with their potencial targets (it updates instantly with the price change (before closing the bar). Such estimation can be confirmed or invalidated in minutes, but can give an advantage and be usefull on higher intervals.
Supports modified traiding patterns:
B.38
B.50
B.618
B.786
B.886
Shark
Cypher
Formation 5-0
Script with limited access, contact author to get authorization
Existing patterns visualization:
Potencial pattern visualization:
On the chart we can see few potencial patterns ( Sharks & Cyphers ). First target of first formation was realized and trend was changed. Chances of reaching targets in each pattern kind we can check by moving mouse over the label. tooltip will show:
- how many patterns are in historical data on this chart
- targets with % of cases in historical data on this chart when target was reached.
WARNING !!!
For each scanner configration and "D point limit" we can get different values. Also numbers of bars (traidingView account type) will change results. You can contact us for details how to optimaze settings for better performance.
Estimated patterns visualization:
On the chart we can see 2 estimated patterns based on current up trend. We can see that trend was already confirmed and will not change in this bar, but "if he had changed" the patterns will be accepted as potencial giving more arguments for move down.
Patterns performance data:
Below we can see chart with stats params set to "%". In the table on right we can see how many patterns were detected on the chart for the current configuration and how many of them reached particular level within the current D limit.
For each scanner configration and "D point limit" we can get different values. Also numbers of bars (traidingView account type) will change results. You can contact us for details how to optimaze settings for better performance.
Script settings:
| XABCD Scanner |
XABC dist limit - Specifies the maximum distance between successive pattern vertex .
Trend type - Specify which wave type should be used.
precision ‰ - It determines the maximum deviations from the conditions that must be met by the patterns. It also causes enlarge / blur of targets.
B.38, B.50, B.618, B.786, B.886, Shark, Cypher, Formation 5-0 - Filter specifying which patterns should be detected and allowing to set pattern color.
| XABCD Scanner Visualization |
You can configure visualziation for each pattern type separatelu:
Existing - Patterns in the historic data
Potencial - Patterns with known XABC vertrex, but without confirmed D.
Estimated - Dynamic patterns with not confirmed C vertex . After extreme formed they can be confirmed or invalidated.
Shape - Check if you want to see pattern shape.
Target - Check if you want to see posibble targets (In case of high precision value, lines become diagonal).
Label - Decide what format should have label. You can pick from: Fullname, shortname, vertical, hidden.
Targets: Filled/Not filled - Allow to change colors used for targets visualization.
Fill: targets/shape - Transparency param of the drawings.
| XABCD Scanner Statistics |
D point limit - A treshold for filter that counts statistics. If D will be reach after passing treshold it will not count as success in the statistics.
over limit color - Color used for patterns line visualization if D is over limit set in previous point.
pattern filter checkbox - Showing dialog with list of potencial patterns.
pattern filter - Field allowing to pick potencial pattern to show.
stats - Shows/hides stats table.
| Trend visualization |
Type - Specify switch what kind of wave should be drawn.
Confirmation - Draw "C" label if wave was confirmed and will not change in this bar. If wave is changing on this bar shows distance from the treshold.
Shadow - Draws second trendline based on the wave extremes.
Low/Mid line width and color - Wave drawing configuration.
| Impuls visualization |
Impuls - Picking graphical reprezentation of first bullish arrow.
Impuls color - Color of the first bullish arrow.
Draw arrow - Drawing arrow on the end of impuls wave.
Troubleshooting:
In case of any problems, please contact the author of the script. To improve speed of solving problem first check if script is drawn, and if there is a "!" character after script params. If you can see "!" character, move cursor over it for detail. Send message with error details, ticker and interval to us. The more precise will be your description the faster we will be able to help you.
Rate Of Change and rsi zonesHi,
I played with the ROC ( Rate of change ) indicator.
First of all I made it smooth. And came up with decent buy sell signals for long-term potential trades. It can be useful for DCA and profit booking in market tops ( before potential crash)
Recommended time frame = 1 Daily , 3 Daily , Weekly.
Usage :
1. Look for Buy and sell arrow signals. But don't jump straight away. Specially for sell. You might sell early. Instead you can move up your stop loss when you see a sell signal or profit book partially.
if you wait and combine with your own supply and demand zones you can get some nice sell price.
2. Better to wait and look for a divergence in price and ROC. As price will slow down it will reflect on the ROC line. Which means market is exhausted and potentially a correction might happen.
3. You can draw trendline one the ROC and look for breakout. ( warning won't always work )
4. You can also see the RSI in thick red/green color. It will help you determine oversold and overbought zones. Trick is don't sell when it's oversold ( red thick line) . Because it might be a start of a strong uptrend.
So better is to wait and see when the signal is printing then execute.
Best strategy is to DCA and sell in parts whenever you see such signals.
I believe it will visually help us that when to be bull and when to be bear.
Anyway if you find it useful let me know in the comment.
Also if you have some idea to improve the code you can contribute as well.
Thanks . Feedbacks are welcome.

HL Marker - CKThis Indicator will help to identify the high and low on the trend, which helps to draw the trendline perfectly.

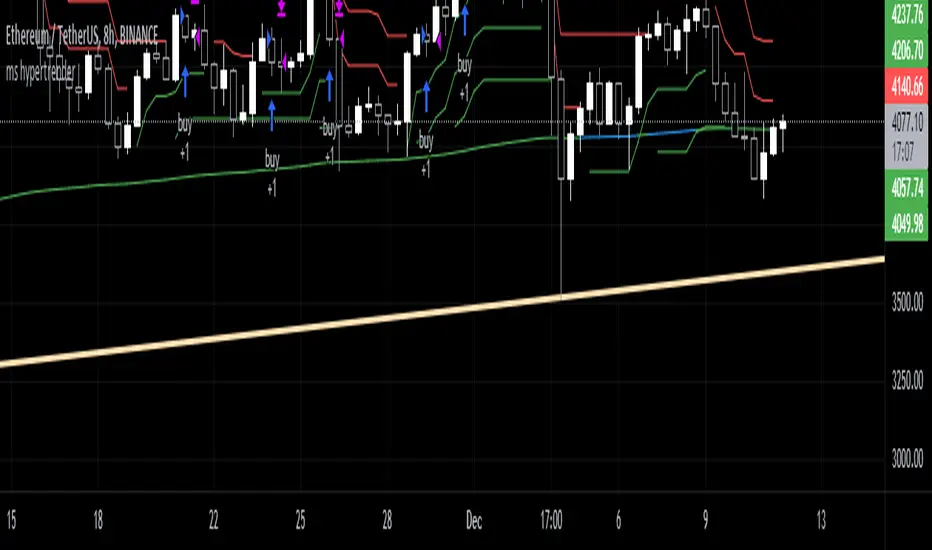
ms hypersupertrendThis is a well-known strategy by using 3 different Supertrends and a trend-defining EMA,
feel free to play around with the settings, a backtest on 8h ETHUSDT pair brought some good results using
the 233EMA and investing 75% of a 10k start capital
the idea is to have at least 2 super trends going green above the trend-EMA to go long and exit by turning
2 super trends red (idea: 1 super trend in red could initialize a take profit)
shorts work vice versa
The EMA shows in green for uptrends and in red for downtrends, if it is blue no Signal will be taken because
the 3 super trends are not all above or below the trendline(EMA)
//-------------------------------------------------------------------------------------------------------------------------------------------------
Update 1:
- Fixed a minor input error
- Added ATR stoploss, and commented out the percentage stop loss
- Added time window to backtest
- Added exit on risk/reward is met
- This version is only buy...wait for next update adding shorts and more
As always, thanks for your ideas, likes, and support. Feel free to mess around with the settings and give me your feedback.

moonshot hypertrender (supertrend strategy)
This is a well-known strategy by using 3 different Supertrends and a trend-defining EMA,
feel free to play around with the settings, a backtest on 8h ETHUSDT pair brought some good results using
the 233EMA and investing 75% of a 10k start capital.
The idea is to have at least 2 Supertrends going green above the trend-EMA to go into a long position. The exit
will be triggered if 2 Supertrends change to red (idea: 1 super trend in red could initialize a take profit).
Taking shorts works vice versa.
The EMA shows in green for uptrends and in red for downtrends, if it is blue (ranging market) no Signal will be taken because
the 3 Supertrends are not all above or below the trendline(EMA).
I heard about this strategy on youtube but I can't get the promised 60% win-rate ;)
any suggestions to improve it are welcome
Hope you find it useful and it would be nice to get your feedback
-theasgard-
[DSPrated] Modified EMD for swing tradeModified Ehlers Empirical Mode Decomposition indicator for swing trade based on Butterworth 2nd order IIR filter
Description
This script is inspired by John Ehlers' TECHNICAL PAPERS - Truncating Indicators and Empirical Mode Decomposition. But instead of detecting trend it applies to finding swing regions.
Also here is suggested canonical DSP approach for designing coefficients for Butterworth 2nd order IIR filters - bandpass and lowpass.
Besides, truncated IIR filter with configurable length parameter is used. It worth mentioning, that although truncated filter is more robust than original IIR, it losses specified properties (bandpass) the more, the less is length parameter.
Butterworth Bandpass Infinite Impulse Response (IIR) Filter
This is the 2nd order Butterworth Bandpass Infinite Impulse Response (IIR) Filter based on the transform from the 1st order lowpass
Based on the example 8.8 on p476 from book Digital Signal Processing: A Practical Approach 2nd Edition by Emmanuel C. Ifeachor (Author), Barrie W. Jervis (Author)
It differs from Ehlers BandPass Filter only in the way you initialize input parameters. Here you can define cutoff periods of region of interest. For example on a timeframe, where one bar equals 1 hour you can define periods 18 and 22, which mean you'll see the swing intensity of price movement components within specified range.
Parameters
Source
Period 1 - cutoff period of bandpass begining
Period 2 - cutoff period of the end of bandpass
length - IIR truncation length
Concept of usage
Within specified bandpass this indicator eliminates the Trend line according to Ehlers EMD. The bandpass periods is recommended to choose accordingly to personal comfortable trading style and timeframe.
The trendline painted with 3 colors depending of the next modes:
up tend - green
cycling - black
downtrend - red
So the buy signal is generated when trend line in cycling mode and filtered component reaches it local minimum.
And the sell signal is generated when trend line in cycling mode and filtered component reaches it local maximum.
Secure long and short zones marked with color.
---
// TO DO
// - compare truncated and full version using signal generators
// - apply zero lag filter modification fordetectig ternd and swing peroids
// - implement strategy scripts
// - implement somewhat "true" EMD with sevral IMFs(intrinsic mode function)
// - better description?
// - parameter optimization
---
Please, feel free to report any issues and improvement suggestions.
