Daily SMA 20/50/100/200Simple Moving Averages indicator displaying four commonly used trend lines on the price chart. Plots the 20, 50, 100, and 200 period SMAs to help identify short-, medium-, and long-term trend direction, dynamic support and resistance, and overall market structure. Color-coded for clarity: 20 SMA in green, 50 SMA in blue, 100 SMA in orange, and 200 SMA in red, with uniform line thickness for clean visual consistency.
移動平均線

Valuation Multi-Asset [MTF]Description This indicator is a specialized Intermarket Analysis tool designed to determine the relative valuation of an asset by comparing its performance against key global benchmarks (Currency, Commodities, Bonds, and Sector ETFs).
Unlike standard oscillators (like RSI) that only look at the asset's own price, this script calculates a Relative Value Index.
Underlying Concepts & Methodology The script operates on the principle of asset correlation and mean reversion ratios. The calculation logic follows these steps:
Ratio Calculation: It computes the price ratio between the Chart Asset and a Benchmark Asset (e.g., Symbol / DXY).
Smoothing: It applies a double smoothing method using Exponential Moving Averages (EMAs) to filter out short-term noise from the ratio.
Historical Normalization: Based on valuation theories (inspired by concepts like Larry Williams' valuation window), the script normalizes the smoothed ratio over a user-defined lookback period (default is 3 years/156 weeks). This ranks the current relative value between 0 and 100.
Key Features
Multi-Benchmark Comparison: Automatically compares the asset against the Dollar Index (DXY), Gold (GC1!), Bonds (ZB1!), and Sector ETFs.
MTF Dashboard: Includes a Multi-Timeframe table to see valuation status across Daily, Weekly, and Monthly views simultaneously.
ETF Reference: A built-in reference table to help you quickly find the correct Sector ETF for stock correlation.
How to Use
Undervalued Zone (< 15): When the line turns Green (or enters the bottom zone), the asset is historically cheap relative to the benchmark. This often indicates a potential accumulation or reversal point.
Overvalued Zone (> 85): When the line turns Red (or enters the top zone), the asset is historically expensive relative to the benchmark, suggesting potential distribution.
Divergences: Watch for divergences between the asset price and the Valuation Index (e.g., Price makes a new high, but the Valuation Index against Gold makes a lower high).
Settings
You can toggle individual benchmark lines (Asset 1 to 4).
Adjust the "Lookback Period" to change the historical normalization window.
Customize the Overbought/Oversold thresholds.
To comply with House Rules regarding non-English UI, here is the translation of the script's settings menu:
1. Seleção de Ativos (Asset Selection)
Usar Timeframe Personalizado = Use Custom Timeframe
Mostrar Ativo = Show Asset
Símbolo = Symbol
2. Tabela de Referência de ETFs (ETF Reference Table)
Posição da Tabela = Table Position
Categoria = Category (Sectors, Metals, Energy, Grains, Softs, Livestock)
3. Parâmetros do Índice (Index Parameters)
Comprimento EMA = EMA Length
Comprimento R do VIndex = VIndex Lookback Period
4. Níveis de Valuation (Valuation Levels)
Sobrevaloração = Overvaluation
Subvaloração = Undervaluation
Nível Neutro = Neutral Level
5. Configurações de Tabela (Table Settings)
Tamanho do Texto = Text Size
Tema = Theme (Dark/Light)
Usar Cores Personalizadas = Use Custom Colors
Mostrar Setas de Momentum = Show Momentum Arrows
6. Análise Multi-Timeframe (MTF Analysis)
Mostrar Colunas = Show Columns
Descrição Este indicador é uma ferramenta de Análise Intermercado projetada para determinar o "Valuation" (valor relativo) de um ativo comparando seu desempenho com benchmarks globais (Dólar, Ouro, Títulos e ETFs Setoriais).
Conceitos e Metodologia O script opera com base no princípio de correlação de ativos e reversão à média de ratios. A lógica de cálculo:
Cálculo da Razão: Calcula a divisão de preço entre o Ativo do Gráfico e o Benchmark (ex: Ativo / DXY).
Suavização: Aplica Médias Móveis Exponenciais (EMAs) para filtrar o ruído.
Normalização Histórica: Baseado em teorias de valuation (inspirado no método de "Valuation Index" de Larry Williams), o script normaliza esse ratio dentro de uma janela histórica (padrão de 3 anos/156 semanas), classificando o valor atual entre 0 e 100.
Como Usar
Zona Subvalorizada (< 15): Quando a linha fica Verde, o ativo está historicamente barato em relação ao benchmark.
Zona Sobrevalorizada (> 85): Quando a linha fica Vermelha, o ativo está historicamente caro em relação ao benchmark.

Daily SMA 20/50/100/200Simple Moving Averages indicator displaying four commonly used trend lines on the price chart. Plots the 20, 50, 100, and 200 period SMAs to help identify short-, medium-, and long-term trend direction, dynamic support and resistance, and overall market structure. Color-coded for clarity: 20 SMA in green, 50 SMA in blue, 100 SMA in orange, and 200 SMA in red, with uniform line thickness for clean visual consistency.


EMA Strategy Flip/DCA + PnL (Aidan)This is a long only , trend focused EMA strategy designed for capital preservation and entries in sustained market movement, rather than short term trading.
At its core, the system is intentionally simple:
-Uses a dual EMA trend structure to identify bullish and bearish regimes
-Avoids unnecessary exits when price action is indecisive
-Emphasizes staying aligned with the larger market direction
All of these characteristics inherently work best on longer time frames, I typically use the 1D view but have also tested in the 1W and 4H views as well.
Philosophy 🧠
Markets do not move in clean, continuous trends. They alternate between:
-Expansion (breakouts/breakdowns)
-Compression (consolidation/chop)
Most traditional EMA crossover strategies fail because they:
-Overreact during consolidation
-Constantly flip positions
-Slowly bleed capital in sideways markets
This indicator attempts to solve that issue by filtering how sell signals are treated depending on market behavior, rather than blindly acting on every crossover. These are denoted by the "weak sell" indications which are defined by the length of each EMA expansion period.
HOW IT WORKS ⚙️
Buy Signals
Buy signals are generated when the EMA structure flips bullish.
On higher timeframes, these buys aim to align with broader market momentum, not short-term noise.
Weak Sell vs Strong Sell
Not every bearish EMA flip is treated equally. Short, flickering EMA flips (common in consolidation) are treated as “weak sells”, meaning the position is held. The length that defines each "weak sell" can be edited through settings under "flip-distance regime" if you so choose. I keep mine between 20-30 ticks.
Capital is not forced out of the market prematurely. Only when an EMA move shows sufficient trend persistence does the indicator issue a strong sell, fully closing the position.
DCA-Friendly by Design
One of the strengths of this indicator is that it can be used in a dollar-cost-averaging (DCA) mindset.
Some users may choose to:
-Simply buy on each buy signal
-Hold positions through weak sell periods
-Use strong sell signals as higher-confidence exits
This approach can be particularly effective for traders or investors with a long-term outlook who prefer gradual position building with less emotion on each buy. The amount of max tolerable DCA entries can be edited through settings (default 6)
Best Practices & Usage Notes
-This indicator performs best on 4H and 1D charts (be sure to note your "flip distance regime" in settings or the weak sell periods may be inaccurate)
-Blue chip and macro markets prove to yield the most consistent results during back testing, although I've seen impressive results on volatile markets as well.
-It is not designed for scalping or very low timeframes
-No indicator is perfect — not every buy or sell will be optimal
-For best results, it should be used alongside:
-Higher-timeframe trend analysis
-Market structure (higher highs / higher lows)
-Macro context or sector strength
-Your own risk management rules
Think of this tool as a framework, not a prediction engine. When used with discipline and proper context, it can serve as a reliable indicator for traders focused on sustainable growth rather than constant activity.
I am always open to suggestions on improvements; please feel free to comment below and let me know any ideas you might have for bettering the indicator, or if you just have questions I'll be happy to answer any!
Good luck out there!!

Nifty 50 Indicator Indicator Name:
9 & 20 EMA + ADX(7) Full System (Confirmed Breakout - Stable)
Purpose:
To identify buy/sell signals based on EMA crossovers and ADX confirmation.
To track confirmed breakout levels and calculate a trailing stop-loss (SL).
To display relevant trading information in a table and visually on the chart.
Logic and Components:
1️⃣ Indicators Used
EMA(9) and EMA(20):
Used to detect trend direction and crossovers.
ADX(7):
Measures trend strength to classify signals as strong or weak.
2️⃣ Signal Generation
Strong Buy: EMA9 crosses above EMA20 and ADX > 20
Weak Buy: EMA9 crosses above EMA20 and ADX ≤ 20
Strong Sell: EMA9 crosses below EMA20 and ADX > 20
Weak Sell: EMA9 crosses below EMA20 and ADX ≤ 20
3️⃣ Confirmed Breakout Logic
Tracks the highest high after a buy signal (confirmedHigh).
Tracks the lowest low after a sell signal (confirmedLow).
Only updates confirmed levels if price continues in the signal direction.
4️⃣ Trailing Stop-Loss (SL)
Calculated from confirmed price, not entry price.
Buy: trailingSL = confirmedHigh * (1 - 0.009)
Sell: trailingSL = confirmedLow * (1 + 0.009)
Plotted on the chart as a red line, thicker and extending to the right.
5️⃣ Visual Elements on Chart
EMAs:
EMA9 (green), EMA20 (red).
Triangles for signals:
Medium size, hollow, colored outline.
Up triangles for buy, down triangles for sell.
Trailing SL line:
Red, width=3, extends 50 bars to the right.
6️⃣ Table Display
Shows key variables for each active signal:
Signal Type (Strong/Weak Buy/Sell)
Entry Price
Confirmed Price
Confirmed Move (Price difference from entry to confirmed)
ADX Value
Trailing SL
Summary of Workflow
Detect EMA crossovers.
Filter signals by ADX to determine strength.
Record entry price and initial confirmed high/low.
Update confirmed high/low if price continues in trend.
Calculate trailing SL from confirmed price.
Plot EMAs, signals (triangles), and trailing SL line.
Display all key information in a table on the chart.
✅ Key Features:
Dynamic trailing stoploss based on confirmed breakout.
Distinguishes strong vs weak signals.
Visual cues: hollow triangles for signals, SL line, and table summary.
Works entirely on the chart, ready for trading analysis.

MA Cross + Trend Stats (Probabilistic)Short description (one-liner)
A MA-regime framework with historical regime stats + forward performance + optional trend/noise filters for trending context.
________________________________________
Full description (TradingView-ready)
Overview
This indicator turns a classic Moving Average Cross into a regime-based trend dashboard. Instead of treating a cross as a standalone “buy/sell” event, it measures what historically happened after similar regime shifts on the current symbol and timeframe, and displays the results in a compact table.
It supports:
• EMA or SMA
• Custom fast/slow lengths (including .5 lengths via floor/ceil averaging)
• Optional trend quality filters for trending decisions:
o Slope filter (Slow MA slope)
o Market noise filter using Efficiency Ratio (ER) in real time
________________________________________
What the table shows (how to read it)
The table has two rows: Bull (Fast > Slow) and Bear (Slow > Fast). Metrics are computed on completed regimes (historical segments that already ended).
N
Number of completed regimes measured. More samples generally means more stable estimates.
μ Δ% / Med Δ%
Average and median regime return from regime start to regime end. Median helps reduce the impact of outliers.
⏱ Bars
Average regime duration (in bars). Useful to calibrate realistic holding expectations for trending.
⬆ MFE% / ⬇ MAE%
• MFE (Maximum Favorable Excursion): max move in favor during the regime
• MAE (Maximum Adverse Excursion): max move against during the regime
These are context metrics for typical run-up and typical heat.
ER μ | Hit
Trend-quality proxy:
• ER μ: average Efficiency Ratio during regimes (0–1, higher = more directional / less noisy)
• Hit: % of regimes with ER above the historical threshold you set
Forward performance (+H μ|Hit)
For two user-defined horizons (e.g., +10 / +20 bars):
• μ: average forward return after the cross
• Hit: probability (%) that the forward return was positive
This is designed to provide probabilistic context, not certainty.
________________________________________
“Trending” decision filters (optional)
These filters apply to signals/alerts/markers, not to the raw regime statistics:
1. Slope filter (Slow MA):
Only allow Bull signals if the Slow MA slope is positive (and Bear signals if negative).
2. Market noise filter (ER realtime):
Only allow signals when current ER exceeds your chosen threshold (helps avoid choppy conditions).
________________________________________
Suggested usage (educational)
• Treat Bull/Bear as a regime label (state), not a prediction.
• Use Forward Hit% as an estimate of historical frequency, not a guarantee.
• If ER realtime is below threshold, consider it a noisier environment (higher whipsaw risk).
• Combine with your own risk rules and confirmation (structure, volatility, volume, HTF context, etc.).
________________________________________
Notes
• Results depend on symbol, timeframe, and loaded history.
• Statistics are historical summaries and can change as more data becomes available.
• This tool is intended for research and decision support, not as standalone trade advice.
________________________________________
Disclaimer
This script is for educational and informational purposes only and does not constitute financial, investment, or trading advice. Trading involves risk. You are responsible for your own decisions and risk management.

Kairos MA Strategy [Personal Version] BHow it Works:
Trend Definition: Uses a Fast MA (e.g., SMA 10) and a Slow MA (e.g., SMA 11).
Uptrend: Fast MA > Slow MA.
Downtrend: Fast MA < Slow MA.
Entry Trigger: The price must retrace to touch the Fast MA.
Validation: The pullback is validated by ATR limits to ensure the price hasn't wicked or closed too far past the MA (preventing "catching a falling knife").
Filters:
Slope Filter: Ensures the MAs have a steep enough angle to avoid trading during flat/choppy markets.
Volatility: Checks VIX (maximum fear) and ATR (minimum movement) to ensure safe market conditions.
Confluence: Optional checks from oscillators like RSI, Stochastic, CCI, etc.
Exits:
Fixed Targets: Uses a defined Take Profit and Stop Loss in points.
No Trade Zone (NTZ): A specific time window that forces all active trades to close (e.g., to avoid holding overnight).
Unique Features:
Custom Dashboard: Displays real-time win rates, streaks, and a "Strategy Grade" directly on the chart.
Dual-Engine: Runs as both a visual indicator (with custom labels) and a backtestable strategy simultaneously.

Horizontal Dynamic Moving Averages [TheScalpingAnt]Overview
This indicator is a complete professional moving average framework designed for traders who want structured market insight, flexibility, and powerful visual clarity.
Instead of being limited to static moving averages, this tool gives you up to 10 independently configurable moving averages, full style control, forward-projected price lines, automatic labeling, and the freedom to build your own trend system exactly the way you trade.
This is not just a moving average indicator.
It is a market structure workstation.
Concepts
This tool is built around three core trading concepts:
Market Structure Visualization
Different moving averages represent short-term momentum, medium-term trend, and long-term bias. Seeing how they align instantly shows whether the market is trending, compressing, or reversing.
Precision and Control
Every MA can use any of the following calculation methods:
SMA — EMA — RMA — WMA — HMA — VWMA
This allows the trader to tailor the indicator to their trading system instead of being forced into one logic.
Clarity & Forward Guidance
Each moving average can be extended into the future with horizontal projections, allowing the trader to visualize reaction zones, support/resistance expectations, and confluence ahead of price.
Features
• Up to 10 fully independent moving averages
• Multiple calculation types (SMA / EMA / RMA / WMA / HMA / VWMA)
• Individual enable/disable control
• Adjustable length per MA
• Custom color per MA
• Individual line thickness and style
• Forward extension into future bars
• Optional on-price-scale value display
• Automatic price labels with length identification
• Extremely clean chart visualization
• Works on any market and timeframe
• Non-repainting
Every moving average becomes a strategic tool, not just a line.
Customization
This indicator is engineered to adapt to every trading style:
You Control:
• Which MAs are active
• Their length
• Their calculation method
• Their color
• Their thickness
• Their line style
• Whether values display on scale
• Forward extension distance
This makes the tool equally valuable for:
Scalpers – Day Traders – Swing Traders – Long-Term Investors.
Usage
Typical use cases include:
• Identifying trend direction
• Spotting pullbacks inside trends
• Recognizing trend shifts early
• Mapping dynamic support and resistance
• Aligning entries with trend bias
• Confirming breakout validity
• Detecting consolidation phases
Shorter MAs provide reaction signals
Mid-range MAs provide structural control
Higher MAs define long-term bias
Projected future lines allow traders to visually anticipate market reactions instead of reacting late.
Example Workflow
Example practical trading workflow:
1. Short-term MAs (e.g., 8 / 16 / 30) track entry conditions and momentum.
2. Mid-term MAs (50 / 100) define structural bias.
3. Long-term MAs (150 / 200 / 800 / 1500 / 3000) define macro trend.
4. If short-term averages remain above structural ones → trend continuation confidence.
5. If they compress and cross downward → structural weakness.
6. Extended forward bands mark dynamic areas where the market may react next.
Simple. Clear. Actionable.
Settings
Default design structure includes:
• Enable/Disable per MA
• Length defaults: 8 → 3000
• Full color customization
• Individual width selection
• Solid / Dashed / Dotted styles
• Price scale value toggle
• Forward extension bar length selector
Everything is designed to make the indicator powerful without cluttering the chart.
Conclusion
This indicator delivers:
✓ Professional-grade market structure visualization
✓ Absolute flexibility
✓ Clear and readable market information
✓ Better decision-making support
✓ Reduced uncertainty and guesswork
Whether you trade crypto, forex, indices, or stocks — this is a powerful tool to elevate your technical analysis.
Disclaimer
This indicator does not guarantee profits and is not financial advice. Trading involves risk. Users are fully responsible for their trading decisions.

FluxMA ProFluxMA Pro
FluxMA Pro is an intraday trend-following strategy based on moving-average cross signals , with built-in execution filters (time window + weekdays), direction control, and an optional strict one-trade-per-day rule.
The system enters when price crosses the selected moving average, and manages risk using fixed SL/TP in ticks . For clarity and auditing, it plots the MA and draws risk (SL) / reward (TP) zones on the chart.
This script is published for educational and research purposes , with documented mechanics and replication settings to support transparency and reproducibility.
How the strategy works
Signal engine (MA cross)
A base Moving Average (MA) is computed from a selectable price source.
A Long signal triggers when price crosses above the MA.
A Short signal triggers when price crosses below the MA.
Execution filters
Time filter : trades only inside the configured window (supports overnight windows correctly).
Weekday filter : enable/disable trading by day (Mon–Sun).
Direction filter : run Long only , Short only , or Both .
One trade per day (optional) : if enabled, once a trade is placed, no new trades are allowed until the next daily reset.
Risk management (ticks)
Stop-loss and take-profit are set using fixed distances in ticks from entry.
Orders are placed with a stop and a limit exit to keep execution auditable.
Visual audit layer
Plots the Moving Average on the chart.
Draws SL/TP zones as boxes that extend while the position is open.
Adds entry labels (“buy” / “sell”) for quick review in replays and optimizations.
Visual features
MA plot with selectable MA type (SMA/EMA/WMA/RMA) and length.
Risk/Reward boxes projected from entry (SL zone + TP zone).
Entry labels with configurable styling (label/flag) and colors.
Settings used for the published backtest (replication)
The performance screenshots included with this publication were generated using the following configuration:
Market & chart
Symbol : XAUUSD (FXCM feed)
Timeframe : 15 minutes
Date range : 02 Jan 2025 → 07 Nov 2025
Inputs (Strategy settings)
Source : Close
MA type : SMA
MA length : 10
Stop Loss : 1400 ticks
Take Profit : 2000 ticks
Time filter : enabled — 06:00 to 22:15 (exchange time)
Weekday filter : enabled — Monday to Sunday enabled
Direction : Long only
One trade per day : enabled
TradingView Strategy Properties used
Initial capital : 1,000 USD
Commission : 0.2 (as set in Strategy Properties)
Slippage : 1 tick
Backtest snapshot (as shown)
Net Profit : +727.41 USD (+72.74%)
Max Drawdown : 200.25 USD (12.71%)
Total Trades : 218
Win Rate : 52.29% (114 / 218)
Profit Factor : 1.485
Backtest context and limitations
Stop/limit fills may occur intrabar depending on TradingView’s execution model and bar magnifier assumptions.
Results vary by symbol, timeframe, broker feed, spreads, commissions, slippage, and session selection.
Past performance does not guarantee future results.
This script is not financial advice.
Originality and usefulness
While MA-cross strategies are a known concept, FluxMA Pro focuses on an execution-grade implementation designed for testing and disciplined deployment:
Execution guardrails : optional one-trade-per-day lock + direction filter to prevent over-trading and strategy drift.
Session handling done properly : time windows support overnight logic (no “broken window” edge cases).
MA modularity : SMA/EMA/WMA/RMA selection enables controlled experiments without rewriting logic.
Auditable visuals : SL/TP zones and labels allow fast review of behavior during replays, optimization, and multi-asset scans.

RiskyInvesting Algo v1.0.0 - BasicA multi‑layer trend‑following and momentum‑confirmation system designed around dual adaptive baselines, and smart candle‑strength filtering. This indicator blends volatility‑based trailing logic with macro trend bias tools (EMA + SMMA) to identify clean directional flips and filter out weak signals.
This indicator uses 5 parameters to determine the trend direction.
Disclaimer:
- Please use this in conjunction with other tools and confirmations. Labels are not meant to be used as financial advice.
Core features include:
- Two Adaptive Trailing Baselines: ATR‑adjusted equations (Parameter 1 & 2) that flip direction based on baseline breaks.
- Directional Shift Detection: Buy markers on bullish dual‑baseline flip; sell markers on bearish dual‑baseline flip.
- Trend Bias Filtering: Uses EMA vs SMMA relationship to color signals and provide market bias context.
- Candle Strength Filter: Ensures signals only trigger on meaningful momentum candles relative to ATR.
- Clean Visual Display: Auto‑coloring buy/sell labels, baseline plots, and signal triangles.
🟩/🟥 = Strong Directional Bias
🟦/🟧 = Neutral Directional Bias
Built for traders who want a structured trend‑flip system that avoids noise, highlights strong directional moments, and maintains visual clarity even on volatile intraday charts.

Apex Trend & Liquidity Master V2.1The Apex Trend & Liquidity Master is a hybrid trading system designed to align traders with the dominant market trend while identifying key structural price levels. Unlike simple moving average crossovers or standalone support/resistance tools, this script integrates a volatility-adaptive "Trend Cloud" with a "Smart Liquidity" engine.
This integration allows the script to offer unique filtering capabilities, such as hiding counter-trend liquidity zones to reduce chart noise and focus on high-probability continuations.
How It Works
Adaptive Trend Cloud The backbone of the system is the Trend Cloud, calculated using a Hull Moving Average (HMA) base with ATR bands. The cloud expands and contracts based on market volatility.
Green Cloud: Bullish Regime. The market is trending up; look for long opportunities.
Red Cloud: Bearish Regime. The market is trending down; look for short opportunities.
Smart Liquidity Zones (with Integration) The script automatically detects Pivot Highs and Lows to draw Supply (Resistance) and Demand (Support) zones. These zones persist until price breaks through them (mitigation).
Integration Feature: A "Filter Zones by Trend" option is included in the settings. When enabled, this feature connects the Trend Cloud to the Liquidity Engine:
It will only display Demand zones when the Trend Cloud is Bullish.
It will only display Supply zones when the Trend Cloud is Bearish.
Note on Lag: Zones are based on pivots (default lookback: 10). A zone appears on the chart 10 bars after the pivot forms. These are historical structural levels.
Signal Filters Buy and Sell labels are generated when the Trend Cloud changes color, but they are filtered to ensure quality:
Volume Filter: Signals only appear if the current volume is higher than the 20-period average.
RSI Filter: Prevents buying when RSI is overbought (>70) or selling when oversold (<30).
Live HUD An on-chart dashboard provides real-time data on:
Trend Bias: Direction of the cloud.
Momentum: RSI strength (Weak/Neutral/Strong).
Volume: High vs. Low activity.
Usage Guide
Identify the Trend: Use the background fill color to determine if you should be looking for longs (Green) or shorts (Red).
Wait for Structure: Look for price to pull back into a "Smart Liquidity" zone. For example, in a Green Trend, wait for price to touch a Green Demand box.
Confirm with Momentum: Check the Dashboard. Ideally, you want to see "Strong" momentum aligning with your trade direction.
Settings: If the chart is too cluttered, enable "Filter Zones by Trend" in the settings menu to hide counter-trend boxes.
Credits & Attribution This script combines original integration logic with adapted open-source concepts:
Smart Liquidity Logic: The method for generating Supply/Demand boxes via Pivot Highs/Lows and array management is adapted from open-source logic commonly used in Smart Money Concepts (SMC) indicators, notably popularized by LuxAlgo and the broader Pine community.
Trend Logic: The volatility cloud utilizes standard Hull Moving Average (HMA) and ATR formulas.
Disclaimer This indicator is provided for educational and informational purposes only. It does not constitute financial advice. Past performance of pivot levels or trend signals does not guarantee future results.

Triple EMA// Triple EMA indicator designed for TradingView free users.
// Displays 3 standard EMAs in one indicator slot.

Techno Signals Pro ⚡ QUICK SETUP
FOR BEGINNERS:
Keep all defaults
Trade only A+ signals
Use provided TP/SL levels
Wait for volume confirmation
FOR ADVANCED:
Adjust confluence threshold (higher = fewer but better signals)
Toggle divergence optional for more flexibility
Use MTF alignment for higher timeframes
Enable slippage buffer for realistic risk
🚀 GETTING STARTED
Add indicator to your chart
Check table for current signal
Verify conditions match your timeframe
Set orders at TP/SL levels
Manage trade according to grade
Remember: No indicator is perfect. Always use proper risk management and combine with price action confirmation. Start with paper trading to understand the system before real money.

llama fixed-length moving averages [SMA, WMA]Llama Moving Averages
I needed moving averages on my charts, but I wanted them hardcoded based on the following values:
timframe --- MA length
Daily --- 20D (==1 trading month)
Weekly --- 30W (30W moving averages for assessing long term trends)
15m --- 1W (or 5 days)
Two averages:
EMA and WMA: fast moving and slow moving based on closes.
In addition to this, I needed the following things:
1. MAs ONLY on 15m, 1D and 1W timeframes.
2. Consistent colors.
3. for 15m chart, we want a 5D SMA, so 1D = 15m * 25(±1); times 5; 25*5 = 125
4. Option to configure different values for the daily chart, since I trade the daily chart. Defaults: 20.
If you were looking for something similar, enjoy!

3MA Alignment Ribbon [AlgoTraderPro]3MA Alignment Ribbon is a clean, visual trend-structure indicator based on the alignment of three moving averages.
Instead of focusing on crossovers, it highlights trend quality and direction by dynamically coloring the moving averages and the ribbon between them.
The goal is simple : See at a glance whether the market structure is bullish, bearish, or neutral.
⸻
How It Works
The indicator plots three moving averages (Fast, Medium, Slow) and evaluates their alignment:
Bullish → Fast > Medium > Slow
Bearish → Fast < Medium < Slow
Neutral → Any other configuration
The moving averages and the filled ribbon between them are automatically colored based on this alignment, making trend conditions immediately visible.
⸻
Key Features
✅Multi-MA Support
Choose between:
EMA (default)
SMA
WMA
VWMA
RMA
HMA
✅ Alignment Modes
Strict: classic Fast > Medium > Slow logic
Tolerant: requires a minimum percentage separation between averages to reduce noise in ranging markets
✅ Optional Slope Filter
Filter signals by requiring the slow MA to be rising or falling, helping avoid false trend states during flat conditions.
✅ Higher Timeframe (HTF) Ribbon
Overlay the same 3MA alignment logic from a higher timeframe on your current chart:
Fully optional
Correctly calculated on the HTF itself
Option to use confirmed HTF bars only (reduces repaint confusion)
✅ Alerts & Visual Signals
Alerts when alignment turns Bullish, Bearish, or Neutral
Optional on-chart markers when the alignment flips
✅ Custom Styling
Fully customizable colors and transparency
Designed to remain readable without cluttering the chart
⸻
How to Use It
This indicator works best as:
A trend filter for discretionary trading
A context tool for entries using other setups
A market structure overlay for scalping, swing trading, or position trading
It does not generate buy/sell signals by itself — instead, it helps you trade aligned with market structure.
⸻
Default Settings
The default lengths (50 / 100 / 200 EMA) are suitable for most markets and timeframes, including crypto, forex, indices, and equities.

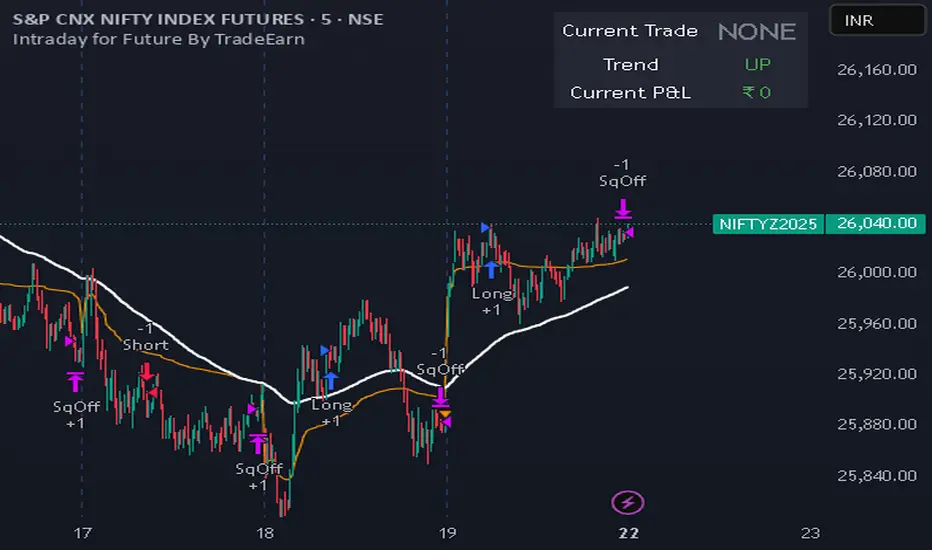
Intraday for Future By TradeEarnIntraday Strategy (StochRSI + VWAP + EMA)
Overview The Intraday Pullback Scalper is a specialized trend-following strategy designed for futures and equity traders who prefer to enter existing trends on pullbacks rather than chasing breakouts. By combining volume-weighted data (VWAP) with exponential moving averages (EMA) and momentum oscillators (Stochastic RSI), this script identifies high-probability entry points during intraday sessions. It includes built-in automation hooks (Alerts) compatible with bridge services for seamless execution.
How It Works
The strategy relies on a three-step confirmation process to filter noise and precision-time entries:
Trend Definition (The Filter):
VWAP (Volume Weighted Average Price): Acts as the primary regime filter. Longs are only permitted if price > VWAP; Shorts only if price < VWAP.
EMA (Exponential Moving Average): A secondary trend filter (default 100 periods) ensures alignment with the broader trend.
Time Range Breakout (Optional): Users can enable an "Initial Balance" filter where trades are only taken if the price breaks out of a specific time range (e.g., first hour High/Low).
Entry Trigger (The Signal):
Long Entry: The market must be in an Uptrend (Price > VWAP & EMA). The script waits for a "dip" where the Stochastic RSI drops below the Oversold level (default 20) and then crosses back up.
Short Entry: The market must be in a Downtrend (Price < VWAP & EMA). The script waits for a "rally" where the Stochastic RSI rises above the Overbought level (default 80) and then crosses back down.
Risk Management:
The strategy uses fixed Target Profit and Stop Loss values defined in currency (₹) relative to the trade quantity.
It features visual SL and TP lines on the chart for the duration of the trade to assist with manual monitoring.
Key Features
Universal Compatibility: Works on the "Current Chart" (Nifty, Bank Nifty, Stocks, Commodities) without needing complex dropdown selection.
Visual Dashboard: An on-screen table displays the Current Trade Status (Long/Short), Trend Direction, and Running P&L in real-time.
Algobaba Bridge Ready: Pre-formatted alert messages are included for users utilizing the Algobaba bridge for automation (supports MIS/NRML product types).
Customizable Trend Filters: Users can toggle the Time Range filter or adjust the VWAP Anchor (Session, Week, Month).
Settings & Configuration
Trade Quantity: Set your default lot size (e.g., 50 for Nifty).
Risk Settings: Define Target and Stop Loss in Rupees (₹) per trade setup.
Indicators: Adjustable lengths for EMA, RSI, and Stochastic.
Trading Window: Restrict entries to specific session hours (e.g., 09:15 - 15:10).
⚠️ IMPORTANT DISCLAIMER & RISK WARNING ⚠️
1. Educational Purpose Only This strategy script is provided solely for educational, informational, and research purposes. It does not constitute financial advice, investment recommendations, or a solicitation to buy or sell any securities, futures, or derivatives. The author is not a SEBI registered Research Analyst or Investment Advisor.
2. No Guarantee of Profit The "P&L" and performance metrics displayed on the chart are hypothetical and based on historical data. Past performance is not indicative of future results. Market conditions change, and a strategy that worked in the past may fail in the future.
3. Limitations of Backtesting
Slippage & Commission: The script results may not fully account for real-world execution costs such as broker commissions, taxes (STT/GST), slippage, or liquidity issues.
Repainting/Data Lag: While every effort is made to ensure code stability, real-time data feeds may vary from historical data due to internet latency or data provider differences.
4. High Risk in Derivatives Trading Futures and Options (F&O) involves a substantial risk of loss and is not suitable for every investor. You can lose more than your initial capital. Please assess your risk tolerance and financial situation before trading.
5. Automation & Third-Party Tools This script includes alert messages formatted for third-party bridge services (e.g., Algobaba). The author assumes no responsibility for:
Technical failures, API errors, or connectivity issues with your broker or bridge provider.
Incorrect order execution resulting from automation.
Users are solely responsible for monitoring their trades and verifying order execution.
Usage Agreement By using this script, you acknowledge that you are trading at your own risk and hold the author harmless from any losses incurred. Always test on a paper trading account before deploying real capital.
A+ / A- Radar + BUY/SELL (VWAP & EMA9 & M2/T3)simple script with vwap and m9 and displacement create by m2/t3 code.
best timeframe to use 5m

Best RSI (SIIT) By Nagaraj HiremathBest RSI (SIIT) By Nagaraj Hiremath is based on RSI shows when to By and sell .

Best Algo (SIIT) By Nagaraj HiremathBest Algo (SIIT) By Nagaraj Hiremath is Based on Ema,Pivot,Renko Candle

Besho SetupThe Moving Averages (The Colored Lines) These three lines are the backbone of this system. They are perfectly aligned for a bullish trend (Yellow > Green > Red) and act as protective shields for the price:
The Red Line (at the bottom): This is the "General Trend Line," typically the EMA 200 (200-period Exponential Moving Average).
Function: It separates the uptrend from the downtrend. As long as the price remains well above it, the trend is strongly "bullish." Notice that the price is very far from it, indicating strong momentum.
The Green Line (in the middle): This is the "Intermediate Support Line," typically the EMA 50 or EMA 100.
Function: It acts as a bounce zone (Dynamic Support) during deep corrections. The price is shown to respect this level well in the image.
The Yellow Line (closest to the price): This is the "Fast Momentum Line," typically the EMA 20 or EMA 21.
Function: It is used for quick entries and exits. As long as the candles are closing above it, the bullish wave is sharp and continuous.

Forex Sniper @24 Support is based on Asia high and low , plus shows New York sessions and London
Background with out cuts only shows volativity times

RSI with 3 Separate Smoothing AveragesRSI has 3 moving averages, to help trade better
RSI period can be adjusted
Moving average has multiple selections (SMA, EMA, HMA)
moving average cross over can be used as signal for trades
Trade at your own risk
