ATR + Moving AverageThis indicator shows a manually calculated Average True Range (ATR) along with a moving average of the ATR.
The ATR measures current candle volatility.
The ATR Moving Average shows the average candle size over the selected period.
Both can use different smoothing types (RMA, SMA, EMA, WMA) for flexibility.
It’s useful for seeing when price is stretched, volatility is expanding or contracting, and for higher-timeframe mean-reversion analysis.
移動平均線

BBMA by RWBTradeLabBBMA by RWBTradeLab
A clean, non-repainting BBMA indicator built for traders who combine Bollinger Bands with Linear Weighted Moving Averages and EMA to track volatility expansion, price extremes, and confirmed breakout behavior using closed candles only.
What this indicator does
This script combines Bollinger Bands (20, 2) with Linear Weighted Moving Averages (LWMA) and a 50 EMA to help traders identify high-probability price extension zones and confirmed BBMA break conditions—without repainting.
All calculations and alerts are based strictly on closed candles (no running-bar signals).
Core components
Bollinger Bands
*Period: 20
*Deviations: 2
*Apply to: Close
*Visual shift supported (default 0)
*Clean white band structure for clarity
Linear Weighted Moving Averages (LWMA)
*LW MA 5 Low
*LW MA 10 Low
*LW MA 5 High
*LW MA 10 High
These weighted averages react faster to recent price action and help define dynamic BBMA zones.
Exponential Moving Average
*EMA 50
*Apply to: Close
*Method: Exponential
Used as a higher-timeframe trend and structure reference.
BBMA alert logic (closed candle only)
Lower BBMA Break
Triggered when:
*LW MA 5 Low crosses below the Lower Bollinger Band
*The candle closes below the Lower Bollinger Band
*LW MA 5 Low remains below the Lower Bollinger Band after close
Upper BBMA Break
Triggered when:
*LW MA 5 High crosses above the Upper Bollinger Band
*The candle closes above the Upper Bollinger Band
*LW MA 5 High remains above the Upper Bollinger Band after close
⚠️ No alerts are generated on running candles—only on confirmed bar close.
Visuals on chart
*Bollinger Bands plotted in clean white
*LW MAs color-coded for easy distinction
*EMA 50 plotted in green
*Optional show/hide toggles for BB, LW MAs, and EMA
Alerts
Built-in alerts trigger only on candle close:
*BBMA Lower Break (confirmed)
*BBMA Upper Break (confirmed)
Designed for reliable discretionary trading and automation without repainting issues.
Key settings
*BB Period & Deviations
*LW MA periods (5 & 10, High / Low)
*EMA period
*Visual shift for Bollinger Bands
*Individual visibility toggles
Non-repainting confirmation
All calculations, plots, and alerts are based on confirmed candles only.
No running-bar logic → no repainting.
Disclaimer
This indicator is a technical analysis tool, not financial advice.
Trading involves risk—always use proper risk management and confirm signals with your own analysis.
Creator: RWBTradeLab
If you find this indicator useful, please leave a like ⭐ and share your feedback.

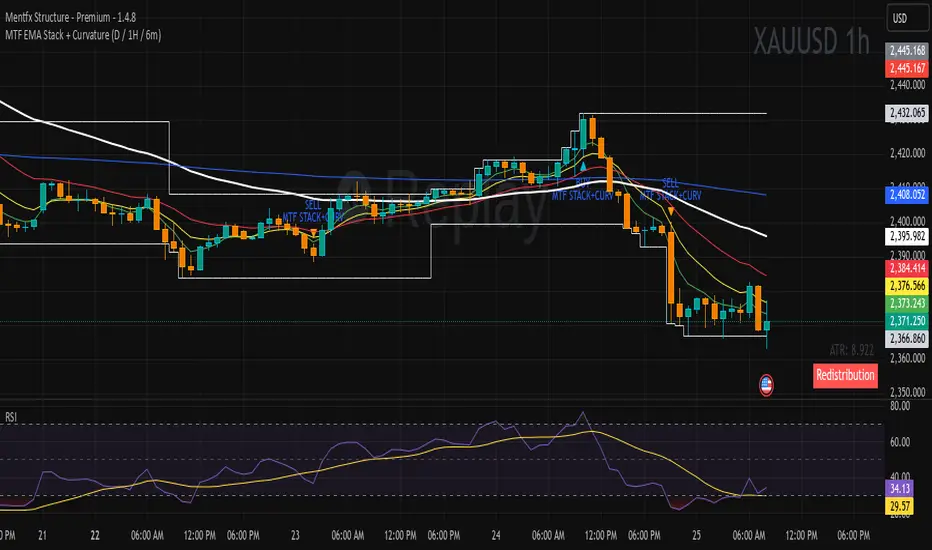
MTF EMA Stack + Curvature (D / 1H / 6m)Purpose of the Indicator
The MTF EMA Stack + Curvature Indicator is a trend-alignment confirmation tool.
Its goal is to identify high-probability trend continuation setups by requiring all of the following to agree:
Trend direction (EMA stacking)
Trend strength / acceleration (EMA curvature)
Multi-timeframe alignment (Daily, 1-Hour, and 6-Minute) with you can change to your preference
Instead of reacting to short-term noise, the indicator only signals when institutional-style trend structure is aligned across time frames.
ARDO (v2.4.7) Moving Averages v1.1ARDO Moving Averages v1.1 (Overlay)
Companion overlay that recreates ARDO driver states (Spreads A/B, LinReg state + slope/gradient, tiers/MK tiers, gate pass/block) and maps those states onto up to 5 moving average overlays + one optional MA-to-MA fill.
ARDO v2.4.6 (original indicator)
What this overlay does
Computes ARDO “driver states” internally (no external source required): Spread A, Spread B, LinReg (4-state), LinReg slope/accel → gradient opacity, quartile/tier regimes, MK tiers, and Gate pass/block.
Paints MA overlays using selectable “Color Modes” (Spread A, Spread B, ARDO LinReg, MK Tier, Quartile Background, Gate Pass, Bull/Bear A vs B, or Fixed).
Optional Fill between two overlay MAs using a selected color mode (intended for regime/bull-bear shading between MA lines).
Core concepts (quick read)
Baseline / MA A / MA B define Spread A and Spread B (% distance vs baseline).
LinReg is a regression of a selected source (Spread A, Spread B, or Spread(A+B)).
LinReg State (4 colors) is derived from slope sign and acceleration (trend speeding up vs slowing down): Green / Orange / Red / Gray.
Gradient Opacity scales line opacity based on slope magnitude (strong vs weak).
Tier / Quartile maps current regime into bins (Q0–H4) using rolling percentiles (or manual thresholds).
MK Tier is an alternate tier engine (Standard / Asymmetric / Mirror BG).
Gate is a boolean pass/block that can combine spread and trend requirements (optional).
How to set it up (recommended workflow)
Pick ARDO Core MAs (Baseline, MA A, MA B) and your main LinReg Source.
Tune LinReg Length + Gradient Scale to match your timeframe (shorter = faster flips, longer = smoother).
Decide Tier mode (Standard vs Asymmetric) and whether tiers use All Bars or Pivots Only .
Set up Gate (or leave off): use it as a “permission layer” for entries.
Configure your overlay MAs (1–5) and assign each a Color Mode aligned to its job:
MA1 = fast impulse (often Spread A)
MA2 = trend state (often ARDO LinReg)
MA3 = slower confirmation (often Spread B)
MA4 = gate/permission readout (Gate Pass)
MA5 = regime (MK Tier)
Enable Fill only if you want regime shading between two MAs (keep it simple: one fill only).
Inputs explained (by group)
1) Sources & Moving Averages (ARDO Core)
Price Source : price used for MA calculations (default close).
Baseline MA Type/Length : reference MA for spreads.
MA A Type/Length : “A” spread driver (usually faster).
MA B Type/Length : “B” spread driver (often slower fast MA).
EMA Fast / EMA Slow : used only if the EMA gate toggle is enabled.
2) Linear Regression & Gradient
LinReg Length : lookback used by regression.
LinReg Source : Spread A, Spread B, or Spread(A+B).
Slope Lookback : bars used to compute slope as (linreg - linreg ) / n.
Adaptive Opacity Scale : derives slope “cap” from a rolling percentile (reduces volatility-regime distortion).
Fixed Scale Cap : used if adaptive scaling is off.
Min/Max Opacity : clamps gradient range.
3) Tiers & Population
Tier Mode : Standard vs Asymmetric (changes percentile boundary logic).
Tier Population : All Bars vs Pivots Only.
Manual Thresholds : if enabled, uses user cutoffs instead of computed percentiles.
Auto-Percentile Window : rolling window size for percentiles.
4) Region Rendering (BG / regime palette)
BG colors for Q0/Q1/Q2/Q3/Q4/H4 : the palette used for “Quartile Background” color mode and MK “Mirror BG”.
Pivot Sensitivity : relevant only for Pivots Only population.
5) Gate (Pass/Block)
Gate: SpreadA > LinReg (toggle)
Gate: EMA Fast > EMA Slow (toggle)
Min Spread A (%)
Min |LinReg Slope|
Gate PASS/BLOCK colors : also used by Gate Pass color mode.
6) Overlay Moving Averages (MA1–MA5)
MA Len / Type : SMA, EMA, WMA, Wilder, Triangular, HMA, Adaptive.
Color Mode :
Fixed
ARDO Spread A
ARDO Spread B
ARDO LinReg (4-state + gradient opacity)
MK Tier
Quartile Background (Q0–H4 palette)
Gate Pass
Bull/Bear (A vs B)
Base Color : used for Fixed (and as fallback).
Line Width
Style (if present): line / stepline / markers depending on the MA slot.
Bull/Bear (A vs B) definition
Bull when MA A > MA B
Bear when MA A < MA B
Alerts (built-in alertconditions in v1.1)
Spread A State
State changed (any change)
Turned Green / Orange / Red / Gray
LinReg State
State changed (any change)
Turned Green / Orange / Red / Gray
LinReg Gradient
Gradient High (slope strength high)
Gradient Low (slope strength low)
Gate
Gate Pass ON
Gate Pass OFF
Bull/Bear Flip
Bullish flip (A crosses above B)
Bearish flip (A crosses below B)
Tier / Quartile
Entered Q0
Entered Q1
Entered H3
Entered H4
Simple Alignment
LinReg Green AND SpreadA Green (basic “momentum aligned” condition)
How to use Gate (and how to loosen/tighten it)
Use Gate as a filter , not as the entire strategy: it’s best as “permission to trade” plus your own trigger.
If Gate is too strict :
Disable EMA Fast > EMA Slow gate (trend filter) OR disable SpreadA > LinReg gate (structure filter).
Lower Min Spread A threshold.
Lower Min |LinReg Slope| threshold.
Increase LinReg Length slightly to reduce noisy flips (sometimes helps pass stability).
If Gate is too loose :
Enable both gate components (SpreadA>LinReg AND EMA Fast>Slow).
Raise Min Spread A and/or Min |LinReg Slope|.
Shorten LinReg Length to react faster (but can increase chop).
Practical “read” using the default overlay roles
MA1 (fast, Spread A mode) : impulse / early acceleration cues.
MA2 (trend, LinReg mode) : regime + momentum state; opacity tells you strength.
MA3 (confirmation, Spread B) : slower confirmation; helps avoid “one-candle impulse traps”.
MA4 (Gate Pass) : permission layer; reduces counter-trend entries.
MA5 (MK Tier) : regime band; helps distinguish “deep OS/OB context” vs mid-zone noise.
Notes
This is an overlay; it’s designed to complement the original ARDO oscillator pane.

Shock Wave: EMA9 Slope / ATR (Normalized) for SPYShock Wave – EMA9 Slope Normalized by ATR (Fragility Gauge)
This indicator measures trend fragility, not direction.
Instead of relying on visual trendline angles (which change with zoom and chart scaling), this tool normalizes the slope of the 9-EMA by ATR, producing a scale-independent steepness metric that remains consistent across timeframes and zoom levels.
The goal is to identify late-stage acceleration and liquidity vulnerability — conditions where price is advancing faster than inventory can rebalance and the market becomes sensitive to forced liquidation.
What this indicator shows
Normalized EMA9 slope (ATR per bar)
An angle-like degree value derived from the normalized slope (for intuition only)
Background shading to highlight trend maturity / fragility
A compact table showing live readings on the chart
How to interpret
Green / low values (< ~0.30 ATR/bar): Healthy, sustainable trend
Orange / mid values (~0.30–0.40 ATR/bar): Late-stage acceleration
Red / high values (≥ ~0.45 ATR/bar): Fragile / liquidation-prone conditions
These thresholds are empirically derived from historical index behavior (e.g., SPY prior to 2018, 2020, 2022 volatility events).
Important notes
This is not a buy or sell signal
Red does not mean “short”
The indicator highlights risk asymmetry, not timing
Best used on higher timeframes (weekly) in conjunction with liquidity, inducement, and higher-timeframe structure analysis
Why use this
Markets often fail after strong trends, not because they are weak, but because they are crowded. This tool helps quantify when a trend has become structurally vulnerable, providing context for liquidity-based frameworks and macro risk management.

TRS (Trend Readiness System)TRS – Trend Readiness System
TRS (Trend Readiness System) is a trend-aligned trading framework designed to help you identify stocks that are becoming ready for entry , not just those already breaking out.
Instead of producing noisy buy/sell signals, TRS evaluates trend quality, pullback structure, momentum rebuilding, and market context , and converts them into clear scores, states, and timing awareness — both on the chart and inside the TradingView Screener.
---
Core Philosophy
Strong trends don’t start at the breakout — they start when conditions quietly align.
TRS focuses on:
• Primary trend alignment
• Healthy pullbacks above long-term support
• Early momentum recovery
• Market regime confirmation
• Entry timing (fresh vs late)
---
What TRS Measures
1. Setup Score (Trend Quality)
Answers the question: “Is this stock structurally worth watching?”
Based on:
• Price position relative to MA150
• Long-term trend direction
• Higher-low structure
• Distance from MA150 (overextension control)
• Market regime (bullish / bearish)
---
2. Entry Score (Timing Quality)
Answers the question: “Is the timing right — or still early?”
Based on:
• Short and mid-term moving averages
• Pullback behavior
• Momentum stabilization
• Volume confirmation
---
3. General Score
A combined readiness score used for ranking in the TradingView Screener:
General Score = Setup Score + Entry Score
---
Entry State Tracking (Key Feature)
TRS tracks the full entry lifecycle , not just signals:
• Valid Entry
• Pending Entry (almost ready)
• Bars Since Valid Entry
• Entry Window (Fresh / Expired)
• Entry Still Valid (Yes / No)
This helps avoid chasing late or already-played setups.
---
Market Regime Filter
Signals automatically adapt to overall market conditions:
• Market trend confirmation (e.g. SPY / QQQ)
• Reduced false signals during weak markets
• Clear explanation when setups are blocked
---
Visual Dashboard (Optional)
The on-chart dashboard can display:
• General Score
• Market state
• Setup quality
• Entry status
• Entry window
• Bars since entry
• Blocking reason (if any)
You can switch between:
• Minimal mode – essential info only
• Full table mode – detailed diagnostics
---
Screener Integration
TRS exposes clean numeric outputs for the TradingView Pine Screener:
• Setup Score
• Entry Score
• General Score
• Pending Entry (1 / 0)
• Valid Entry (1 / 0)
• Bars Since Valid Entry
• Market Bullish (1 / 0)
Example Screener Filters:
• Setup Score ≥ 50
• Pending Entry = 1
• Bars Since Valid Entry ≤ 3
• Market Bullish = 1
---
How to Use TRS (Daily Routine)
Step 1 – Scan
• Look for high Setup Score
• Prefer Pending Entry = 1
Step 2 – Review
• Confirm pullback quality
• Check MA150 support
• Observe momentum rebuilding
Step 3 – Act
• Enter only on Valid Entry
• Avoid expired entry windows
• Skip setups blocked by market regime
---
What TRS Is NOT
• Not a breakout chaser
• Not a day-trading system
• Not signal spam
TRS is a decision-support system for swing and position traders who value structure, context, and timing.
---
Best Used On
• Daily timeframe (1D)
• Liquid stocks & ETFs
• Trend-following strategies
• Portfolio-level screening
---

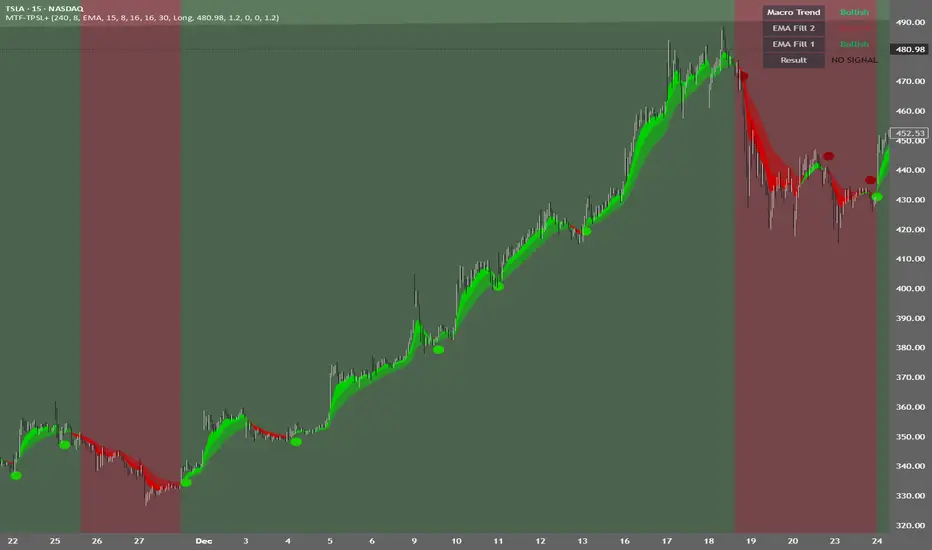
MTF TPSL Scalper System TP/SL Integration [TheScalpingAnt]MTF TPSL Scalper System TP/SL Integration
Credit: Aballard11 (Original Moving Average Shaded Fill Area Crossover Concept & Foundation) Developed / Implemented by: The Scalping Ant
OVERVIEW
MTF-TPSL Enhanced is a professional multi-timeframe TradingView indicator engineered to align macro market bias with micro execution timing, while simultaneously delivering visual trade management via integrated Take-Profit and Stop-Loss projections.
It is a complete execution framework:
• Macro context before entry
• Clean directional bias
• Precision entry timing
• Disciplined risk visualization
Built using an advanced dual-EMA fill model, MTF-TPSL filters noise, aligns directional momentum, and helps traders execute only high-probability opportunities. Whether you are scalping, day trading, or swing trading, this tool delivers the clarity and confidence required for professional-grade decision making.
Works on Forex, Crypto, Indices, Stocks, and Futures on any liquid market.
CORE CONCEPTS
MTF-TPSL is structured around three professional trading pillars:
1) Macro Bias (Higher-Timeframe Context)
A customizable higher-timeframe moving average defines directional bias:
• Bullish macro → long focus
• Bearish macro → short focus
This reduces counter-trend trades and improves directional consistency.
2) Micro Structure (Execution Layer)
On your trading timeframe, the system uses two EMA fill zones:
• EMA Fill 2 → Trend confirmation layer
• EMA Fill 1 → Precision entry timing layer
Signals are generated only when momentum, structure, and macro bias align, significantly improving execution quality.
3) Integrated TP/SL Visualization
Built-in trade projection tools allow you to:
• Input a manual entry price
• Visualize structured Stop-Loss placement
• Project one or multiple Take-Profit levels
This encourages planned trades, not emotional trades.
KEY FEATURES
Multi-Timeframe Intelligence
• Independent Macro and Micro engines
• Adjustable Macro MA length & type (SMA / EMA / WMA / VWMA)
• Dynamic higher-timeframe background bias visualization
Advanced Entry Logic
• Standard EMA alignment + crossover confirmation
• Optional Early Reversal Detection (captures momentum shifts before lagging crossovers)
• Optional Wait-For-Candle-Close confirmation filter
Trade earlier when aggressive. Trade later when conservative. You decide.
Signal Matrix (Optional Professional HUD)
• Real-time validation of Macro + Micro conditions
• Explains why a signal prints or does not
• Excellent for learning, strategy discipline, and confidence building
Signal Matrix – How to Read It
The Signal Matrix does not simply tell you if the market is bullish or bearish. It separates market context from execution timing, which prevents traders from entering too late or during weak signals.
The matrix has two roles:
1️⃣ Market Context (Trend Alignment)
• Macro Trend = Higher-timeframe bias
• EMA Fill 2 = Micro trend confirmation
• EMA Fill 1 = Short-term execution layer
If these are Bullish, the market has bullish structure.
If these are Bearish, the market has bearish structure.
This tells you the environment, not the entry.
2️⃣ Result (Signal Decision)
“Result” only shows LONG or SHORT when a valid trade setup is actually triggered.
A signal requires:
• Macro Trend aligned
• EMA Fill 2 aligned
• EMA Fill 1 alignment
• PLUS a trigger event
o EMA crossover or
o EMA color-shift reversal (if enabled)
o and optionally, candle close confirmation if selected
So you may sometimes see:
• Macro Trend → Bullish
• EMA Fill 2 → Bullish
• EMA Fill 1 → Bullish
• Result → NO SIGNAL
This is correct and intentional.
It means:
The market is bullish, but there is no fresh trade entry yet.
The indicator avoids late entries and only signals when a new high-probability setup forms.
If “Wait for Candle Close” is enabled, signals will only confirm after the bar closes to reduce noise and false entries.
Interpretation Summary
• Bullish + NO SIGNAL = Market is bullish, wait for entry trigger
• Bearish + NO SIGNAL = Market bearish, wait for entry trigger
• LONG = Valid bullish entry setup detected
• SHORT = Valid bearish entry setup detected
This keeps trading disciplined, structured, and prevents emotional entries.
Visual Trade Management
• Dynamic TP/SL Projection System
• Automatically plots:
– Entry reference
– Stop Loss
– TP / TP1 / TP2 levels
• Professional clean color coding
• Works for both Long and Short execution
You do not just enter trades—you execute structured plans.
CUSTOMIZATION
MTF-TPSL adapts to any trading style.
Macro Settings
• Select timeframe (example: 4H or Daily)
• Choose MA type
• Adjust sensitivity
Micro Execution Settings
• Two EMA Fill systems
• Adjustable fast/slow lengths
• Precision momentum logic
Signal Behavior
• Enable Early Reversal Detection
• Enable Candle Close Confirmation
• Toggle entry labels
• Toggle background bias
Risk Settings
• Manual entry input
• Direction selection (Long / Short)
• TP %, TP1 %, TP2 %
• Stop Loss %
• Fully visualized execution roadmap
Everything is transparent. Everything is trader-controlled.
USAGE – HOW TO TRADE WITH IT
1️⃣ Identify Macro Bias
Background color instantly shows market context.
2️⃣ Wait for Micro Alignment
EMA Fill 2 confirms trend
EMA Fill 1 provides execution timing
3️⃣ Enter on Confirmed Signal
LONG or SHORT label appears only when rules align.
4️⃣ Manage Risk Professionally
Activate TP/SL projection
Plan targets
Control risk
This workflow promotes discipline, patience, and consistency.
EXAMPLE SCENARIO
Bullish Setup Example
• Macro timeframe closes above macro MA → bullish bias
• EMA Fill 2 turns bullish → structure confirmed
• EMA Fill 1 shifts bullish → execution timing
• LONG signal appears
• Entry, Stop Loss, TP, TP1, TP2 are automatically visualized
Result:
A clean, structured trade aligned with higher-timeframe direction and supported by visual risk structure.
SETTINGS SUMMARY
Macro Controls
• Timeframe
• MA length & type
Micro Controls
• EMA Fill configurations
• Sensitivity tuning
Signal Filters
• Early Reversal toggle
• Candle Close confirmation
Visual Tools
• Background bias
• Entry labels
• Signal Matrix
Risk Engine
• Entry price
• Direction
• TP / TP1 / TP2
• SL
CONCLUSION
MTF-TPSL Enhanced delivers:
• Higher-timeframe clarity
• Precise execution logic
• Professional trade management
• Customizable flexibility
• Clean presentation and usability
In a world full of distractions, MTF-TPSL provides a structured, disciplined, and professional trading framework. It merges Trend + Momentum + Risk Management into one seamless execution system.
If you want to trade with confidence, structure, and real strategic clarity, this indicator is built for you.
DISCLAIMER
This is an analytical tool, not financial advice.
Trading involves risk and no indicator guarantees results.
Always backtest, practice risk management, and never risk more than you can afford to lose.
Liquidity Maxing [JOAT]Liquidity Maxing - Institutional Liquidity Matrix
Introduction
Liquidity Maxing is an open-source strategy for TradingView built around institutional market structure concepts. It identifies structural shifts, evaluates trades through multi-factor confluence, and implements layered risk controls.
The strategy is designed for swing trading on 4-hour timeframes, focusing on how institutional order flow manifests in price action through structure breaks, inducements, and liquidity sweeps.
Core Functionality
Liquidity Maxing performs three primary functions:
Tracks market structure to identify when control shifts between buyers and sellers
Scores potential trades using an eight-factor confluence system
Manages position sizing and risk exposure dynamically based on volatility and user-defined limits
The goal is selective trading when multiple conditions align, rather than frequent entries.
Market Structure Engine
The structure engine tracks three key events:
Break of Structure (BOS): Price pushes beyond a prior pivot in the direction of trend
Change of Character (CHoCH): Control flips from bullish to bearish or vice versa
Inducement Sweeps (IDM): Market briefly runs stops against trend before moving in the real direction
The structure module continuously updates strong highs and lows, labeling structural shifts visually. IDM markers are optional and disabled by default to maintain chart clarity.
The trade engine requires valid structure alignment before considering entries. No structure, no trade.
Eight-Factor Confluence System
Instead of relying on a single indicator, Liquidity Maxing uses an eight-factor scoring system:
Structure alignment with current trend
RSI within healthy bands (different ranges for up and down trends)
MACD momentum agreement with direction
Volume above adaptive baseline
Price relative to main trend EMA
Session and weekend filter (configurable)
Volatility expansion/contraction via ATR shifts
Higher-timeframe EMA confirmation
Each factor contributes one point to the confluence score. The default minimum confluence threshold is 6 out of 8, but you can adjust this from 1-8 based on your preference for trade frequency versus selectivity.
Only when structure and confluence agree does the strategy proceed to risk evaluation.
Dynamic Risk Management
Risk controls are implemented in multiple layers:
ATR-based stops and targets with configurable risk-to-reward ratio (default 2:1)
Volatility-adjusted position sizing to maintain consistent risk per trade as ranges expand or compress
Daily and weekly risk budgets that halt new entries once thresholds are reached
Correlation cooldown to prevent clustered trades in the same direction
Global circuit breaker with maximum drawdown limit and emergency kill switch
If any guardrail is breached, the strategy will not open new positions. The dashboard clearly displays risk state for transparency.
Market Presets
The strategy includes configuration presets optimized for different market types:
Crypto (BTC/ETH): RSI bands 70/30, volume multiplier 1.2, enhanced ATR scaling
Forex Majors: RSI bands 75/25, volume multiplier 1.5
Indices (SPY/QQQ): RSI bands 70/30, volume multiplier 1.3
Custom: Default values for user customization
For crypto assets, the strategy automatically applies ATR volatility scaling to account for higher volatility characteristics.
Monitoring and Dashboards
The strategy includes optional monitoring layers:
Risk Operations Dashboard (top-right):
Trend state
Confluence score
ATR value
Current position size percentage
Global drawdown
Daily and weekly risk consumption
Correlation guard state
Alert mode status
Performance Console (top-left):
Net profit
Current equity
Win rate percentage
Average trade value
Sharpe-style ratio (rolling 50-bar window)
Profit factor
Open trade count
Optional risk tint on chart background provides visual indication of "safe to trade" versus "halted" state.
All visualization elements can be toggled on/off from the inputs for clean chart viewing or full telemetry during parameter tuning.
Alerts and Automation
The strategy supports alert integration with two formats:
Standard alerts: Human-readable messages for long, short, and risk-halt conditions
Webhook format: JSON-formatted payloads ready for external execution systems (optional)
Alert messages are predictable and unambiguous, suitable for manual review or automated forwarding to execution engines.
Built-in Validation Suite
The strategy includes an optional validation layer that can be enabled from inputs. It checks:
Internal consistency of structure and confluence metrics
Sanity and ordering of risk parameters
Position sizing compliance with user-defined floors and caps
This validation is optional and not required for trading, but provides transparency into system operation during development or troubleshooting.
Strategy Parameters
Market Presets:
Configuration Preset: Choose between Crypto (BTC/ETH), Forex Majors, Indices (SPY/QQQ), or Custom
Market Structure Architecture:
Pivot Length: Default 5 bars
Filter by Inducement (IDM): Default enabled
Visualize Structure: Default enabled
Structure Lookback: Default 50 bars
Risk & Capital Preservation:
Risk:Reward Ratio: Default 2.0
ATR Period: Default 14
ATR Multiplier (Stop): Default 2.0
Max Drawdown Circuit Breaker: Default 10%
Risk per Trade (% Equity): Default 1.5%
Daily Risk Limit: Default 6%
Weekly Risk Limit: Default 12%
Min Position Size (% Equity): Default 0.25%
Max Position Size (% Equity): Default 5%
Correlation Cooldown (bars): Default 3
Emergency Kill Switch: Default disabled
Signal Confluence:
RSI Length: Default 14
Trend EMA: Default 200
HTF Confirmation TF: Default Daily
Allow Weekend Trading: Default enabled
Minimum Confluence Score (0-8): Default 6
Backtesting Considerations
When backtesting this strategy, consider the following:
Commission: Default 0.05% (adjustable in strategy settings)
Initial Capital: Default $100,000 (adjustable)
Position Sizing: Uses percentage of equity (default 2% per trade)
Timeframe: Optimized for 4-hour charts, though can be tested on other timeframes
Results will vary significantly based on:
Market conditions and volatility regimes
Parameter settings, especially confluence threshold
Risk limit configuration
Symbol characteristics (crypto vs forex vs equities)
Past performance does not guarantee future results. Win rate, profit factor, and other metrics should be evaluated in context of drawdown periods, trade frequency, and market conditions.
How to Use This Strategy
This is a framework that requires understanding and parameter tuning, not a one-size-fits-all solution.
Recommended workflow:
Start on 4-hour timeframe with default parameters and appropriate market preset
Run backtests and study performance console metrics: focus on drawdown behavior, win rate, profit factor, and trade frequency
Adjust confluence threshold to match your risk appetite—higher thresholds mean fewer but more selective trades
Set realistic daily and weekly risk budgets appropriate for your account size and risk tolerance
Consider ATR multiplier adjustments based on market volatility characteristics
Only connect alerts or automation after thorough testing and parameter validation
Treat this as a risk framework with an integrated entry engine, not merely an entry signal generator. The risk controls are as important as the trade signals.
Strategy Limitations
Designed for swing trading timeframes; may not perform optimally on very short timeframes
Requires sufficient market structure to identify pivots; may struggle in choppy or low-volatility environments
Crypto markets require different parameter tuning than traditional markets
Risk limits may prevent entries during favorable setups if daily/weekly budgets are exhausted
Correlation cooldown may delay entries that would otherwise be valid
Backtesting results depend on data quality and may not reflect live trading with slippage
Design Philosophy
Many indicators tell you when price crossed a moving average or RSI left oversold. This strategy addresses questions institutional traders ask:
Who is in control of the market right now?
Is this move structurally significant or just noise?
Do I want to add more risk given what I've already done today/week?
If I'm wrong, exactly how painful can this be?
The strategy provides disciplined, repeatable answers to these questions through systematic structure analysis, confluence filtering, and multi-layer risk management.
Technical Implementation
The strategy uses Pine Script v6 with:
Custom types for structure, confluence, and risk state management
Functional programming approach for reusable calculations
State management through persistent variables
Optional visual elements that can be toggled independently
The code is open-source and can be modified to suit individual needs. All important logic is visible in the source code.
Disclaimer
This script is provided for educational and informational purposes only. It is not intended as financial, investment, trading, or any other type of advice or recommendation. Trading involves substantial risk of loss and is not suitable for all investors. Past performance, whether real or indicated by historical tests of strategies, is not indicative of future results.
No representation is being made that any account will or is likely to achieve profits or losses similar to those shown. In fact, there are frequently sharp differences between backtested results and actual results subsequently achieved by any particular trading strategy.
The user should be aware of the risks involved in trading and should trade only with risk capital. The authors and publishers of this script are not responsible for any losses or damages, including without limitation, any loss of profit, which may arise directly or indirectly from use of or reliance on this script.
This strategy uses technical analysis methods and indicators that are not guaranteed to be accurate or profitable. Market conditions change, and strategies that worked in the past may not work in the future. Users should thoroughly test any strategy in a paper trading environment before risking real capital.
Commission and slippage settings in backtests may not accurately reflect live trading conditions. Real trading results will vary based on execution quality, market liquidity, and other factors not captured in backtesting.
The user assumes full responsibility for all trading decisions made using this script. Always consult with a qualified financial advisor before making investment decisions.
Enjoy - officialjackofalltrades

JVT PERV Engine V1Its based on invite only. This is based on the moving averages and super trend signals for intraday trading. Its gives trend indicators and when to buy and when to sell. Use it at your risk. Exponential Moving Average (EMA) is a popular trend-following

EMA Ribbons
The Gray Ribbon (EMA 1–3) is designed for trend trading. When the market is trending, price tends to respect the ribbon and bounce off it. If price frequently chops through the ribbon, the market is likely ranging and the ribbon should be ignored.
The 100 EMA and 200 EMA (EMA 4 & 5) are commonly used as dynamic support and resistance levels.
EMA 6 & 7 are calculated from a higher timeframe to provide broader market context.

LockedEye Trading Navigator**LockedEye Trading Navigator — Summary**
This script is a real-time market decision dashboard designed to prevent impulsive trades by forcing structure, context, and confirmation checks into a single glance. It does not generate blind buy/sell signals. It evaluates market conditions, trend alignment, and risk context before allowing a trade bias.
**Core Purpose**
Acts as a pre-trade checklist, not a signal spammer.
Helps traders wait, filter, and align with structure.
Designed for scalping to intraday trading.
Optimized to reduce FOMO entries and late trades.
**Key Features**
**1. Market State Detection**
Classifies the market into TREND ↑, TREND ↓, or COOKING (ranging/compression).
Uses volatility compression and linear regression slope to prevent trading during low-quality conditions.
**2. Multi-Timeframe Moving Average Alignment**
Tracks trend alignment using EMA 6 & 21 (momentum bias), EMA 50 (mid-trend filter), EMA 200 (macro bias), and EMA 70 & 99 on M15 (higher-timeframe confirmation).
Each MA condition is displayed with directional arrows and color-coded backgrounds.
**3. Break of Structure (BOS)**
Detects bullish or bearish structure breaks based on recent range.
Flags BULL, BEAR, or NO.
Used as structural confirmation, not as a standalone signal.
**4. MACD Momentum Bias**
Evaluates MACD line versus signal line.
Outputs BULL, BEAR, or NONE.
Acts as momentum confirmation for trend continuation or exhaustion.
**5. RSI Divergence Detection**
Detects basic bullish and bearish divergence.
Highlights momentum disagreement with price.
Used as a boost factor, not a trigger.
**6. Candlestick Context**
Identifies bullish engulfing, bearish engulfing, and doji candles.
Used to validate entry timing rather than direction alone.
**7. Volume Behavior**
Compares current volume to a 20-period SMA.
Flags INCREASING or DECREASING to confirm whether price movement is supported by participation.
**8. ICT Candle Logic (Correctly Color-Coded)**
Evaluates the current close relative to the previous candle.
INSIDE: Close remains within the previous high/low, indicating consolidation.
OUTSIDE (Green): Close above previous high, indicating bullish expansion.
OUTSIDE (Red): Close below previous low, indicating bearish expansion.
Helps avoid misreading fake breakouts and inside bars.
**9. Price Location Awareness**
Determines whether price is at SUPPORT, at RESISTANCE, or in MID range.
Ensures trades are only considered where risk is logical.
**10. Final Trade Summary Engine**
Outputs one of four states: LONG OK, SHORT OK, WAIT, or NO TRADE.
Requires trend alignment, MACD agreement, structure and location validation, and at least one supporting confirmation.
**Design Philosophy**
No repainting by default.
No emotional signals.
No hindsight bias.
Forces discipline and patience.
Designed as a decision filter, not a prediction tool.
**Best Use Case**
Scalping and intraday trading.
Traders who struggle with overtrading.
Traders who want structure before execution.
Works best when combined with manual price action reading.

Trend Consensus Engine [TCE]The Trend Consensus Engine (TCE) is a comprehensive market analysis system designed to filter out noise and provide a quantifiable "Trend Score" (0-100). Instead of relying on a single indicator, this script aggregates data from multiple market factors—volatility, momentum, and trend structure—to generate high-probability entry signals based on a consensus logic.
This tool is particularly optimized for Crypto (with specific time-gated logic) and BIST (Borsa Istanbul) markets, allowing traders to see the overall health of the trend at a glance via a dashboard.
How It Works
The engine calculates a composite "Total Score" (0-100) derived from four weighted components:
Trend Structure (AlphaTrend & Guppy):
Analyzes the slope and position relative to the AlphaTrend (Credit to @KivancOzbilgic) and Guppy Multiple Moving Averages (GMMA).
Positive slopes and price action above key levels add points to the score.
Volatility & Momentum (Squeeze & ADX):
Incorporates the Squeeze Momentum logic (Credit to @LazyBear) to detect explosive moves.
ADX Filter: Filters out chopping/ranging markets. If the ADX is too low, the score is penalized or the signal is blocked.
Dynamic Resistance (MA Channels):
Uses a combination of Donchian Mid-Lines and SMAs to determine if the price is in a "safe zone" or hitting resistance.
Price Action Filters (Pinbar Veto):
Automatically detects bearish "Shooting Star" or weak candles at highs. If a bearish pinbar is detected, the entry signal is vetoed regardless of the trend score.
Features & Settings
Smart Scoring Dashboard: Displays the realtime Score, Instant Decision, and confirmed Close Decision on the chart.
Market Profiles:
Crypto Mode: Includes a "Time Gate" feature (07:00 UTC+3 check) to prevent fakeouts during low-liquidity hours.
BIST Mode: Optimized parameters for the Turkish stock market logic (14:00 session checks).
Score Threshold: Users can adjust the minimum score required (Default: 70) to trigger a "BUY" signal.
Visual Guidance: The background of the dashboard changes color (Green/Red/Yellow) based on the consensus.
How to Use
Check the Dashboard: Look at the "SONUÇ" (Result) row.
GİRİŞ ✅ (ENTRY): The Score is above 70, Momentum is positive, and no Bearish Pinbars are present.
BEKLE ⏳ (WAIT): The trend is weak, or a filter (like ADX or Squeeze) is blocking the trade.
Confirm with Price Action: Use the AlphaTrend lines (Blue/Red) as dynamic support/stop-loss levels.
Credits:
AlphaTrend by KivancOzbilgic
Squeeze Momentum Indicator by LazyBear
VuManChu Cipher concepts for inspiration.
Custom Logic: Scoring algorithm and Time-Gating mechanisms are original custom developments.
Disclaimer: This tool is for educational purposes only and does not constitute financial advice.

Moving Avg on all timeframes w/ full controlThis indicator is a multi-moving-average overlay built for intraday traders who want daily context + intraday timing on the same chart. It’s designed to work cleanly on common intraday timeframes like 5-minute, 10-minute, and 65-minute, while still letting you reference your key daily trend levels.
Key ideas
Daily trend context on intraday charts: You can plot moving averages that represent your daily structure (ex: 10/20/50/200) while trading intraday.
Intraday “day-equivalent” moving averages: If you like the Brian Shannon style approach, you can use intraday period equivalents (ex: on 5-min, 5D ≈ 390, 10D ≈ 780, 20D ≈ 1560) so you can “feel” multi-day trend/slope directly on lower timeframes.
Sessions awareness (Premarket + RTH)
Includes session inputs so you can define Premarket (1) and RTH (M) windows.
This helps keep your chart behavior consistent with how you trade (especially if you care about RTH structure vs extended hours).
Each MA slot typically includes:
On/Off toggle (so you can declutter instantly)
Length (any period you want: daily-style or intraday equivalents)
MA type selection (ex: SMA/EMA style options)
Visual controls like line width / style (so your key MA stands out)
Why this is useful
On higher intraday frames (like 65-min) you can track the “intermediate trend” cleanly.
On lower intraday frames (5-min / 10-min) you can time entries/exits while still respecting the bigger MA bias.

Gold Scalping MACD ProGold Scalping MACD Pro is a custom-built technical indicator specifically optimized for gold (XAUUSD) scalping. It is based on an advanced adaptation of the classic MACD (Moving Average Convergence Divergence) concept, enhanced to provide faster, clearer, and more reliable signals in highly volatile gold markets.
🔹 Core Purpose
The indicator is designed to:
Capture short-term momentum shifts
Reduce market noise
Improve entry and exit timing during fast price movements
This makes it particularly effective for intraday and scalping strategies.
🔹 Key Features
Enhanced MACD-based momentum calculation for higher sensitivity
Early buy and sell signals during strong momentum phases
Noise filtering to reduce false signals in sideways markets
Optimized for gold’s volatility characteristics
Best performance on lower timeframes (M1, M5, M15)
🔹 How It Works
Gold Scalping MACD Pro analyzes the relationship between fast and slow moving averages, combined with momentum smoothing techniques.
By focusing on momentum strength rather than lagging confirmation, the indicator helps traders:
Identify high-probability scalping opportunities
Confirm short-term trend direction
Avoid weak or low-momentum setups
🔹 Best Use
Gold (XAUUSD) scalping
Momentum-based trading strategies
Trend confirmation on lower timeframes
Used alongside price action, support & resistance, or session timing
⚠️ Risk Disclaimer
Gold Scalping MACD Pro is a technical analysis tool and does not provide trading advice. Trading leveraged instruments such as gold involves significant risk. Proper risk management and confirmation from other analysis methods are strongly recommended.

EMA and Dow Theory Strategies V2📘 Overview
This strategy is an advanced evolution of the original EMA × Dow Theory hybrid model. V2 introduces true swing‑based trend detection, gradient trend‑zones, higher‑timeframe swing overlays, and dynamic exit logic designed for intraday to short‑term trading across crypto, forex, stocks, and indices.
The system provides precise entries, adaptive exits, and highly visual guidance that helps traders understand trend structure at a glance.
🧠 Key Features
🔹 1. Dual‑EMA Trend Logic (Symbol + External Index)
Both the chart symbol and an external index (OTHERS.D) are evaluated using fast/slow EMAs to determine correlation‑based trend bias.
🔹 2. Dow Theory Swing Detection (Real‑time)
The script identifies swing highs/lows and updates trend direction when price breaks them. This creates a structural trend model that reacts faster than EMAs alone.
🔹 3. Gradient Trend Zones (Visual Trend Strength)
When trend is up or down, the area between price and the latest swing level is filled with a multi‑step gradient. This makes trend strength and distance-to-structure visually intuitive.
🔹 4. Higher‑Timeframe Swing Trend (htfTrend)
Swing highs/lows from a higher timeframe (e.g., 4H) are plotted to show macro structure. Used only for visual context, not for filtering entries.
🔹 5. RSI‑Based Entry Protection
RSI prevents entries during extreme overbought/oversold conditions.
🔹 6. Dynamic Exit System
Includes:
Custom stop‑loss (%)
Partial take‑profit (TP1/TP2/TP3)
Automatic scale‑out when trend color weakens
“Color‑change lockout” to prevent immediate re‑entry
Real‑time PnL tracking and labels
🔹 7. Alerts for All Key Events
Entry, stop‑loss, partial exits, and trend‑change exits all generate structured JSON alerts.
🔹 8. Visual PnL Labels & Equity Tracking
PnL for the latest trade is displayed directly on the chart, including scale‑out adjustments.
⚙️ Input Parameters
Parameter Description
Fast EMA / Slow EMA EMAs used for symbol trend detection
Index Fast / Slow EMA EMAs applied to external index
StopLoss (%) Custom stop‑loss threshold
Scale‑Out % Portion to exit when trend color weakens
RSI Period / Levels Overbought/oversold filters
Swing Detection Length Bars used to detect swing highs/lows
Stats Display Position of statistics table
🧭 About htfTrend (Higher Timeframe Trend)
The higher‑timeframe swing trend is displayed visually but not used for entry logic.
Why? Strict HTF filtering reduces trade frequency and often removes profitable setups. By keeping it visual‑only, traders retain flexibility while still benefiting from macro structure awareness.
Use it as a contextual guide, not a constraint.
📘 概要
本ストラテジーは、V1 を大幅に拡張した EMA × ダウ理論 × スイング構造 × 上位足トレンド可視化 の複合型モデルです。 短期〜デイトレード向けに最適化されており、仮想通貨・FX・株式・指数など幅広いアセットで利用できます。
V2 では、スイング構造の自動検出、グラデーションによるトレンド強度の可視化、上位足スイングライン、動的な利確/損切りロジック が追加され、視覚的にもロジック的にも大幅に強化されています。
🧠 主な機能
🔹 1. 銘柄+外部インデックスの EMA クロス判定
対象銘柄と OTHERS.D の EMA を比較し、相関を考慮したトレンド方向を判定します。
🔹 2. ダウ理論に基づくスイング高値・安値の自動検出
スイング更新によりトレンド方向を切り替える、構造ベースのトレンド判定を採用。
🔹 3. グラデーション背景によるトレンド強度の可視化
スイングラインから現在価格までを段階的に塗り分け、 「どれだけトレンドが伸びているか」を直感的に把握できます。
🔹 4. 上位足スイングトレンド(htfTrend)の表示
4H などの上位足でのスイング高値・安値を表示し、 大局的なトレンド構造を視覚的に把握できます(ロジックには未使用)。
🔹 5. RSI による過熱・売られすぎフィルター
極端な RSI 状態でのエントリーを防止。
🔹 6. 動的イグジットシステム
カスタム損切り(%)
TP1/TP2/TP3 の段階的利確
トレンド色の弱まりによる自動スケールアウト
色変化後の再エントリー制限(waitForColorChange)
リアルタイム PnL の追跡とラベル表示
🔹 7. アラート完備(JSON 形式)
エントリー、損切り、部分利確、トレンド反転などすべてに対応。
🔹 8. 損益ラベル・統計表示
直近トレードの損益をチャート上に表示し、視覚的に把握できます。
⚙️ 設定項目
設定項目名 説明
Fast / Slow EMA 銘柄の EMA 設定
Index Fast / Slow EMA 外部インデックスの EMA 設定
損切り(%) カスタム損切りライン
部分利確割合 トレンド弱化時のスケールアウト割合
RSI 期間・水準 過熱/売られすぎフィルター
スイング検出期間 スイング高値・安値の検出に使用
統計表示位置 テーブルの表示位置
🧭 上位足トレンド(htfTrend)について
上位足スイングの更新に基づくトレンド判定を表示しますが、 エントリー条件には使用していません。
理由: 上位足を厳密にロジックへ組み込むと、トレード機会が大幅に減るためです。
本ストラテジーでは、 「大局の把握は視覚で、エントリーは柔軟に」 という設計思想を採用しています。
→ 裁量で利確判断や逆張り回避に活用できます。

Daily SMA 10/20/50/200 (Timeframe Agnostic)This indicator plots the 10, 20, 50, and 200-period Simple Moving Averages calculated on a user-selected base timeframe (default: Daily), then displays them on any chart timeframe (intraday, daily, weekly, monthly). Each SMA has independent controls for visibility, color, and line thickness.

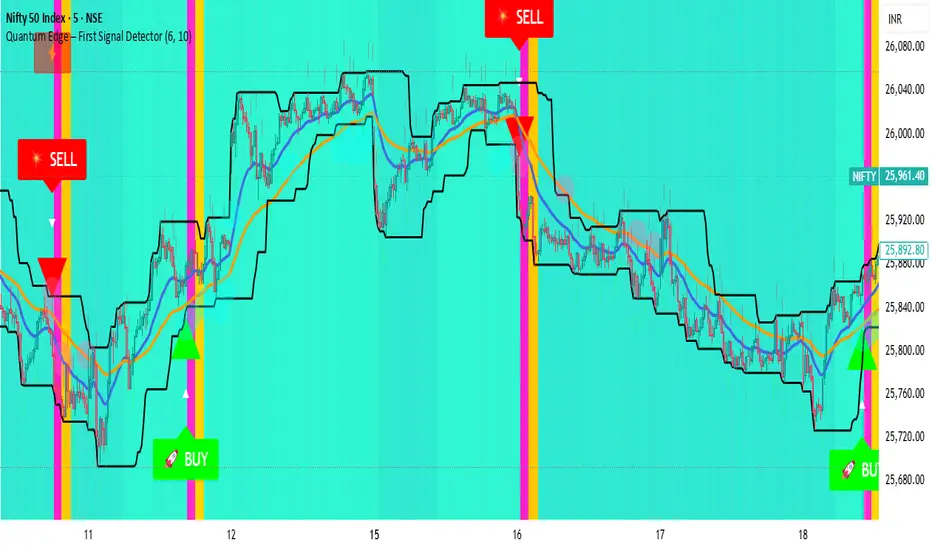
Quantum Edge First Signal DetectorQuantum Edge is a non-repainting, multi-confirmation indicator that detects the first high-probability BUY & SELL signals using momentum, trend, volume, volatility, and price-action voting logic.
🧠 About This Indicator
Quantum Edge – First Signal Detector is designed to solve one common trader problem:
too many late or repeated signals.
Instead of firing continuous entries, this indicator focuses only on the FIRST valid signal after a market shift — helping traders enter early, reduce noise, and avoid over-trading.
It uses a quantum-style voting engine where multiple independent market factors must align before a signal is confirmed.
⚙️ Core Logic (How It Works)
Each candle is evaluated using 6 independent factors:
RSI Momentum
Bullish when RSI > 50
Bearish when RSI < 40
Price Location
Price near recent highs or lows
Volume Expansion
Current volume above moving average
EMA Trend Direction
EMA 20 vs EMA 50
Candle Strength
Strong bullish or bearish candle bodies
Volatility Filter
ATR-based low volatility confirmation
Each factor gives 1 vote.
When minimum confirmations are met, a FIRST BUY or FIRST SELL signal is generated.
🚀 Key Features
✅ First-Signal-Only Logic
Only the first BUY or SELL after trend change
No repeated signals in the same direction
Built-in signal cooldown (user-controlled)
✅ Non-Repainting
Signals are confirmed on candle close
No future data, no repainting
✅ Smart Trend Filtering
EMA-based directional bias
Avoids weak counter-trend entries
✅ Advanced Visual System
Clear BUY / SELL triangles
Trend, volume & momentum backgrounds
Support & resistance zones
Market sentiment bar coloring
✅ Alert Support
Buy alert
Sell alert
📊 Best Timeframes
Scalping: 1m – 5m
Intraday: 5m – 15m
Swing Confirmation: 30m – 1H
Works on:
Forex
Crypto
Indices
Stocks
🎯 How to Trade (Simple Guide)
BUY Setup
✔ First BUY signal appears
✔ Trend is bullish
✔ Use nearby support as reference
SELL Setup
✔ First SELL signal appears
✔ Trend is bearish
✔ Use nearby resistance as reference
Always combine with risk management.
Disclaimer: This indicator is for educational purposes only and does not constitute financial advice. Trading involves risk. Use proper risk management.

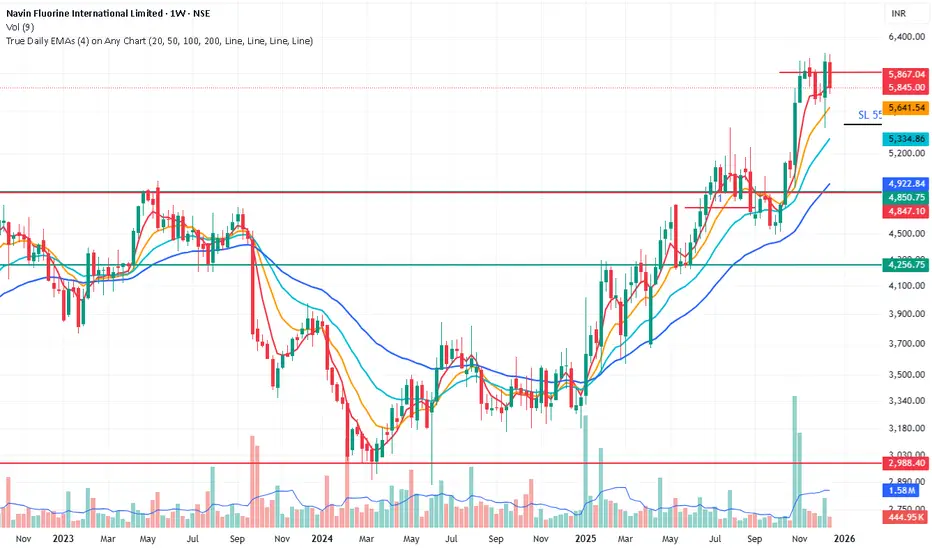
True Daily EMAs (4) on Any ChartIt calculated the 4 EMAs based on days as input. Even on a weekly or monthly chart it shows 20/50/100/200 Day EMAs. Changing the time frame of chart does not effect the EMAs
ATR Distance from 50 SMA By DanBobDanA simple indicator that measures the distance between current price and the 50 SMA
The average momentum swing trade might run 7 times the ATR before pulling back
Therefore, its recommended to not buy a stock that is beyond 4 times its ATR to the 50 SMA
This script will quickly and easily calculate the 50 SMA to ATR distance for you

Beast Mode - Hull Suite ProBeast Mode – Hull Suite Pro is a trend-following overlay indicator built around a dual “Hull ribbon” concept: a fast ribbon for swing/entry timing and an optional slow ribbon for higher-timeframe style trend context. It aims to make trend direction, trend changes, and lower-quality (choppy/ranging) conditions easy to see directly on price.
---
Core concept (what it does)
1) Fast Signal Ribbon (primary direction + flips)
The indicator computes a fast Hull-style moving average using your selected Hull variation and length. It then plots two lines:
- Fast Main = current fast Hull value
- Fast Lag = prior-bar fast Hull value
The space between them is filled to form a ribbon. When Fast Main is above Fast Lag, the ribbon is considered bullish and plotted green. When Fast Main is below Fast Lag, it is considered bearish and plotted red. This creates a simple, visual “slope/continuation” read without needing extra panels.
2) Slow Trend Ribbon (optional trend filter / bias)
A second, slower Hull-style ribbon (default length is user-configurable) can be plotted as a trend context layer. Like the fast ribbon, it uses a main line and its prior-bar value to determine direction. When enabled, it provides a higher-level bias that can be used to filter signals from the fast ribbon.
3) Chop Filter (optional ranging-market filter)
The script includes an optional Choppiness Index filter. When enabled, it blocks buy/sell labels during choppy conditions where trend-following signals often degrade. “Choppy” is defined as Choppiness Index above the user threshold.
4) Visual helpers (optional)
- Candle coloring can be enabled to match the fast ribbon direction.
- A compact dashboard table can be shown on the chart to summarize the current fast trend, slow trend, and whether filters are enabled.
---
How it works (calculation overview)
Hull variations
The indicator lets you choose one of three smoothing/response styles for both the fast ribbon and the slow ribbon:
- Hma: Hull Moving Average
- Ehma: EMA-based Hull variant
- Thma: Triangular/WMA-based Hull variant
A “Length Multiplier” scales the fast length to quickly tune sensitivity without changing your base length.
Preset system
A preset selector automatically adjusts the fast length and Hull variation for common use-cases:
- Fast: shorter length, more responsive (more signals, more noise)
- Balanced: middle ground
- Trend: longer and smoother (fewer signals)
Selecting “Custom” uses your manual inputs.
Fast ribbon direction state
- fastUp is true when the fast Hull value is higher than its previous value (Fast Main > Fast Lag).
- Color and candle coloring (if enabled) follow this state.
Slow ribbon direction state
- slowUp is true when the slow Hull value is higher than its previous value (Trend Main > Trend Lag).
- The slow ribbon is optional and can be hidden.
Choppiness Index
When enabled, the script computes the Choppiness Index over the chosen length and flags the market as choppy if it exceeds the threshold. Signals can be blocked during these flagged periods.
---
Signals (how buy/sell labels are generated)
Buy label (raw):
A Buy is triggered when the fast ribbon flips from bearish to bullish (fastUp becomes true after being false on the prior bar).
Sell label (raw):
A Sell is triggered when the fast ribbon flips from bullish to bearish (fastUp becomes false after being true on the prior bar).
Optional filters:
- Trend Filter (optional):
- If enabled, Buy labels only appear when the slow ribbon is bullish (slowUp = true).
- Sell labels only appear when the slow ribbon is bearish (slowUp = false).
- Chop Filter (optional):
- If enabled, both Buy and Sell labels are suppressed when the market is flagged as choppy (Choppiness Index > threshold).
These filters are designed to reduce low-quality flips in sideways markets and align signals with the broader trend context when desired.
---
How to use it (practical guidance)
1) Trend direction / bias
- Use the fast ribbon color and slope as your near-term trend read.
- If enabled, use the slow ribbon as a higher-level bias filter (e.g., focus on longs when the slow ribbon is green).
2) Entries and timing
- Buy/Sell labels are based on fast ribbon flips. Many traders treat flips as potential momentum shifts rather than guaranteed reversals. Consider confirming with your own market context (structure, levels, volume, session, etc.).
3) Avoiding chop (optional)
- If you trade trend continuation, enabling the Chop Filter can help avoid frequent flips during consolidation.
- Lower chop thresholds are stricter (fewer signals). Higher thresholds allow more signals through.
4) Parameter tuning
- Faster settings will react earlier but can whipsaw.
- Smoother settings reduce noise but can lag.
- The Length Multiplier is a quick way to adjust sensitivity without redesigning the setup.
---
Visual settings
- Show Buy/Sell Labels: toggles label plotting.
- Color Candles: colors bars based on the fast ribbon direction.
- Line Thickness / Fill Transparency: adjust readability.
- Dashboard: shows a small table with current states and filter status. Position is user-selectable.
---
Limitations / notes
- This indicator is not a strategy and does not provide backtest performance results.
- Like all moving-average-based tools, it is lagging by nature and can produce false flips in ranging conditions.
- The Chop Filter helps reduce ranging-market noise but will also filter out some early trend transitions.
- Signals are conditional visual markers and should be used with risk management and confirmation rules appropriate to your trading plan.

EAB: Distance (%) to EMAs/MAsRPL: Distance (%) to EMAs/MAs displays a compact table showing the percentage distance between the current price and selected moving averages, helping to quickly assess price extension relative to key technical references.
Features
• Distance to EMA 10, EMA 20, MA 50 and MA 200 (individually toggleable).
• Up to two custom moving averages , with selectable EMA or MA type and configurable period.
• Customizable colors, opacity, text size and vertical offset to fit the table cleanly on the chart.
How to use
1. Enable or disable moving averages from the “Show” section.
2. To add another average, enable “Custom Moving Average 1/2” and define its type and period.
3. Adjust the visual style from the “Table” section (colors, opacity, size and position).
Notes
• Distance is calculated as: (Close − Moving Average) / Moving Average × 100 .
• Informational indicator only; no entry or exit signals are provided .

Mawhoob (TD - Trend Direction) - v1.1Mawhoob (Trend Direction - TD) Indicator v1.1
Professional Trend Analysis & Market Context Dashboard
----------------------------------------------------
🎯 Overview
----------------------------------------------------
Mawhoob (Trend Direction - TD) is a comprehensive, professional-grade technical analysis tool designed to provide traders with multi-dimensional market insights. This advanced indicator combines a proprietary adaptive trend line with real-time market context data, offering a complete market analysis solution in one elegant package.
✨ Key Features ✨
----------------------------------------------------
📈 Trend Direction Line (TD Line)
----------------------------------------------------
Intelligent Moving Average System: Utilizes a sophisticated blend of EMA, RMA, and WMA with smart adaptive error correction.
1- Dynamic Color Coding:
🟢 Green: Bullish trend (price momentum upward).
🔴 Red: Bearish trend (price momentum downward).
2- Customizable Parameters:
Main Period (1-200): Control long-term vs. short-term sensitivity.
Fast Period (0-50): Fine-tune responsiveness to price changes.
Weighting Factor (0-3): Adjust current price influence on the trend line.
3- Visual Bands: Optional upper and lower bands that create a dynamic channel around the trend line.
----------------------------------------------------
📊 Real-Time Market Dashboard
----------------------------------------------------
A comprehensive information panel displaying multiple technical indicators and market dominance metrics.
Technical Indicators Section:
1- RSI (Relative Strength Index)
Current value with color-coded momentum indication.
Direction status: UP / DOWN / NEUTRAL.
Customizable overbought/oversold levels.
Includes RSI SMA for trend confirmation.
2- MACD (Moving Average Convergence Divergence)
Real-time MACD line value.
Trend direction based on MACD vs. Signal line relationship.
Fully customizable fast, slow, and signal periods.
3- ADX (Average Directional Index)
Trend strength measurement.
Color-coded display: Strong vs. Weak trend.
Adjustable strength threshold.
Market Dominance Section:
1- DXY (US Dollar Index)
Real-time dollar strength tracking.
Direction indicator for forex correlation analysis.
2- BTC.D (Bitcoin Dominance)
Bitcoin market dominance percentage.
Useful for crypto market sentiment analysis.
3- USDT.D (Tether Dominance)
Stablecoin dominance tracking.
Risk-on/risk-off market indicator.
All dominance metrics feature:
Customizable timeframe selection.
UP/DOWN/NEUTRAL directional indicators.
Color-coded values for quick visual assessment.
----------------------------------------------------
🔔 Alert & Signal System
----------------------------------------------------
Price Crossover Alerts: Get notified when price crosses above or below the TD line.
Smart Alert Logic: Filters out neutral/flat market conditions to reduce noise.
Visual Signals: Optional triangle markers on chart (▲ bullish, ▼ bearish).
Once-Per-Bar Frequency: Prevents alert spam while ensuring you don't miss opportunities.
----------------------------------------------------
🎨 Visual Customization
----------------------------------------------------
Candle Color Mode: Option to color candles based on trend direction.
Dashboard Positioning: Choose LEFT, RIGHT, or CENTER placement.
Text Size Options: TINY, SMALL, NORMAL, or LARGE for optimal readability.
Customizable colors for Bullish/Bearish trend lines.
Customizable colors for dashboard backgrounds and borders.
Customizable colors for UP/DOWN/NEUTRAL status indicators.
----------------------------------------------------
📚 Use Cases
----------------------------------------------------
For Day Traders
Quick trend identification with color-coded TD line.
Real-time momentum gauges (RSI, MACD).
Instant crossover alerts for entry/exit timing.
For Swing Traders
Medium-term trend direction with adjustable periods.
ADX strength indicator for high-probability setups.
Market dominance context for broader market analysis.
For Crypto Traders
BTC.D and USDT.D tracking for altcoin season detection.
Integrated multi-indicator analysis.
Customizable timeframes for dominance metrics.
For Multi-Market Analysis
DXY correlation for forex and commodities.
Comprehensive dashboard for quick market scans.
Cross-market sentiment analysis.
----------------------------------------------------
⚙️ Settings & Customization
----------------------------------------------------
Trend Direction Settings
Main TD Period: Adjust overall trend sensitivity.
Fast TD Period: Control responsiveness (0 = no smoothing).
Weighting Factor: Balance between historical and current prices.
Line width and colors for visual preference.
Optional trend bands with adjustable transparency.
Dashboard Settings
Toggle individual indicators on/off.
Customize all indicator periods and thresholds.
Choose timeframe for dominance indices.
Adjust colors, position, size, and borders.
Complete visual control for your trading style.
Alert & Signal Settings
Enable/disable crossover alerts.
Optional visual signals on chart.
Smart built-in filtering to reduce false signals.
----------------------------------------------------
🎓 Best Practices
----------------------------------------------------
Trend Following: Use the TD line as your primary trend filter - trade with the color.
Confirmation: Combine TD direction with RSI and MACD for higher probability setups.
Strength Filter: Use ADX to avoid weak/choppy trends.
Market Context: Check dominance indicators for broader market sentiment.
Alerts: Set alerts to catch reversals without constant chart watching.
----------------------------------------------------
🚀 What Makes This Indicator Special ?
----------------------------------------------------
✅ All-in-One Solution: Multiple professional indicators in one clean package.
✅ Adaptive System: Responds to market conditions, not just static calculations.
✅ Professional Dashboard: Institutional-grade information display.
✅ Real-Time Data: Live updates from multiple markets and assets.
✅ Highly Customizable: Tailor every aspect to your trading style.
✅ Clean Code: Optimized Pine Script v6 for maximum performance.
✅ No Repainting: Uses (barstate.isconfirmed) to ensure calculations only occur on closed bars.
✅ Resource Efficient: Smooth performance even with all features enabled.
----------------------------------------------------
🎯 Perfect For
----------------------------------------------------
Trend identification and following.
Multi-timeframe analysis.
Market sentiment tracking.
Entry and exit timing.
Portfolio management decisions.
Risk assessment through trend strength.
Correlation analysis across markets.
----------------------------------------------------
📝 Notes
----------------------------------------------------
All calculations are performed on confirmed bars to prevent repainting.
Dashboard updates in real-time as market conditions change.
Dominance indices (DXY, BTC.D, USDT.D) require market data access.
Best results achieved when combined with proper risk management.
Suitable for all markets: stocks, forex, crypto, commodities, indices.
----------------------------------------------------
💡 Pro Tips
----------------------------------------------------
Start with default settings and adjust based on your timeframe.
Lower periods (5-10) for scalping, higher (20-50) for swing trading.
Use the dashboard as a quick health check for your current positions.
Combine TD line with support/resistance for confluence.
Watch dominance indicators for early market regime changes.
----------------------------------------------------
⚠️ Important Notes
----------------------------------------------------
This indicator is for educational and informational purposes only.
Always confirm signals with your own analysis before trading.
Use proper risk management and position sizing.
The indicator works on all timeframes and instruments.
Past performance does not guarantee future results.
----------------------------------------------------
🔄 Updates & Support
----------------------------------------------------
Current Version: v1.1
This indicator is actively maintained and updated. Future versions may include additional features and improvements based on user feedback.
----------------------------------------------------
🙏 Acknowledgments
----------------------------------------------------
Created & designed by: @mawhoobx
📝 Remember: The best indicator is the one combined with proper risk management, discipline, and a solid trading plan. This tool is designed to assist your analysis, not replace your judgment.
Trade Smart. Trade Safe. Trade Profitable.
