Breakout and Retest Signals [AlgoAlpha]OVERVIEW
This script detects breakout and retest signals by identifying key pivot points in price action and analyzing their relationship with historical swing highs and lows. It highlights breakout structures using ATR-based tolerance levels and volume analysis to confirm potential trend continuations or reversals. The script marks significant price levels with dynamic boxes and dashed lines to help traders visualize breakout and retest areas effectively.
CONCEPTS
The script relies on pivot point analysis, a technique used to identify significant price levels where the market has previously reversed. It dynamically tracks a set number of recent swing highs and lows, allowing traders to see if the price is revisiting a previously significant level. The concept of breakouts and retests is widely used in technical analysis to determine potential entry points. A breakout occurs when the price moves beyond a resistance or support level, and a retest happens when the price returns to test that level before continuing in the breakout direction. This script enhances that analysis by incorporating ATR-based tolerance levels, ensuring that price zones are not too large.
FEATURES
Breakout and Retest Markings : Highlights breakout and retest areas with shaded boxes, allowing traders to visualize where price action is confirming key levels.
Volume Delta and Ratio : Analyzes volume at breakout levels to gauge the strength of the move, displaying volume delta information for additional context. The script also displays the ratio of selling to buying at the retest along traders to make better judgement on their entries.
Multi-Timeframe Adaptability : Dynamically adjusts volume analysis to align with the appropriate lower timeframe, ensuring reliable volume comparisons.
Alerts for Breakout and Retest Events : Traders can receive real-time notifications when bullish or bearish breakout retests are detected.
USAGE
This script is best suited for traders looking to identify strong breakout and retest setups across different timeframes. Users can customize the pivot detection period and swing point memory to adjust sensitivity based on their trading style. The ATR length and multiplier allow further refinement of breakout tolerance, reducing noise in volatile markets. The breakout zones are displayed as shaded boxes, where traders can assess whether a price retest is occurring under favorable conditions. Alerts can be set to notify traders of potential trade opportunities.
指標和策略

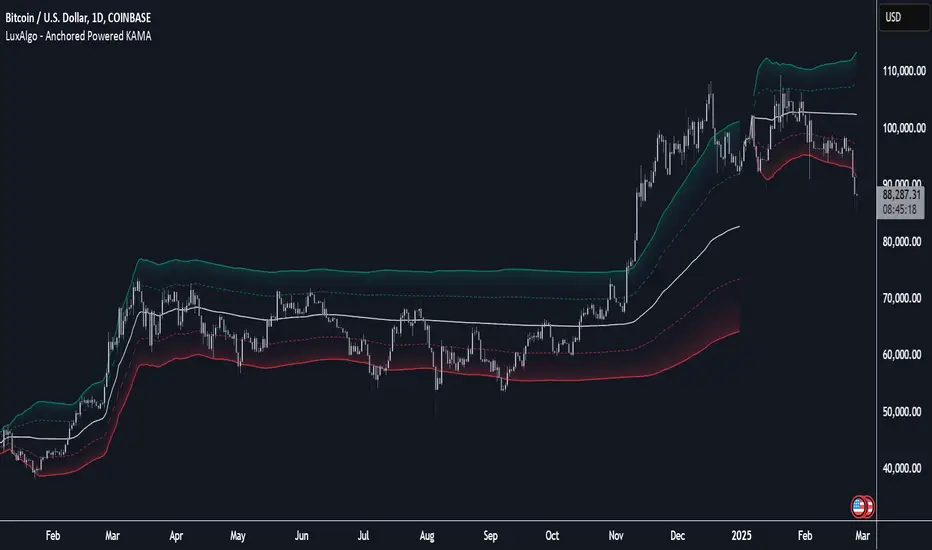
Anchored Powered KAMA [LuxAlgo]The Anchored Powered KAMA tool is a new flavor of the famous Kaufman's Adaptive Moving Average (KAMA).
It adds 5 different anchoring periods, a power exponent to the original KAMA calculation to increase the degree of filtering during ranging trends, and standard deviation bands calculated against the KAMA itself.
🔶 USAGE
In the image above we can see the different parts of the tool, it displays the Anchored Powered KAMA surrounded by standard deviation bands at 2x (solid) and 1x (dashed) by default.
This tool provides a simple and easy way to determine if the current market is ranging or trending and where the market extremes are in the current period.
As a rule of thumb, traders may want to trade extremes in ranges and pullbacks in trends.
When the KAMA is flat, a range is in place, so traders may want to wait for the price to reach an extreme before opening a trade in the other direction.
Conversely, if the KAMA is moving up or down, a trend is in place and traders may want to wait for the price to pull back to the KAMA before opening a trade in the direction of the trend.
🔹 Anchor Period
On the above chart, we can see different anchor periods on different chart timeframes.
This option is very useful for those traders who use multi-timeframe analysis, allowing them to see how the market behaves over different timeframes.
The valid values for this parameter are:
Hourly
Daily
Weekly
Monthly
Yearly
The tool has a built-in Auto feature for traders convenience, it automatically selects the optimal Anchor Period in function of the chart timeframe.
timeframes up to 2m: Hourly
timeframes up to 15m: Daily
timeframes up to 1H: Weekly
timeframes up to 4H: Monthly
larger timeframes: Yearly
🔹 Choosing the Right Anchor Period
In the chart above we can see the custom error message that the tool displays when the Auto feature is disabled and the Anchor Period is too large for the current chart timeframe.
Traders can select a smaller Anchor Period or a larger chart timeframe for the tool to display correctly.
🔶 DETAILS
The tool uses Welford's algorithm to calculate the KAMA's standard deviation, then plots the outer bands at the multiplier specified in the settings panel, and the inner bands at the multiplier specified minus 1.
🔹 Power Exponent
The graph above shows how different values of this parameter can affect the output.
To display the original KAMA a value of 1 must be set, by default this parameter is set to 2.
The higher the value, the better the tool's ability to detect ranges.
🔶 SETTINGS
Anchor Period: Select up to 5 different time periods from Hourly, Daily, Weekly, Monthly, and Yearly.
Source: Choose the source for all calculations.
Power Exponent: Fine-tune the KAMA calculation, a value of 1 will output the original KAMA, and is set to 2 by default.
Band Multiplier: Select the multiplier for the standard deviation bands.
Custom Buy and Sell Signal with Body Ratio and RSI
Indicator Overview:
Name: Custom Buy and Sell Signal with Body Ratio and RSI
Description: This indicator is designed to detect buy and sell opportunities by analyzing the body size and wicks of candles in combination with the RSI indicator and volume. It helps identify trend reversals under high-volume market conditions, which enhances the reliability of the signals.
Indicator Features:
RSI (Relative Strength Index): The RSI indicator is used to assess oversold (RSI < 40) or overbought (RSI > 60) conditions. These zones signal potential reversals when combined with other technical signals.
Candle Body Analysis:
The indicator compares the size of the current and previous candles to validate signals.
For a buy signal, the current candle must be bullish and have a body size proportional to that of the previous bearish candle.
Similarly, for a sell signal, the current candle must be bearish with a body size comparable to the previous bullish candle.
Wick Validation:
The indicator analyzes the wick length to reinforce or exclude signals.
For a buy signal, the lower wick of the bullish candle must be shorter than that of the previous bearish candle.
For a sell signal, the upper wick of the bearish candle must be shorter than that of the previous bullish candle and smaller than 30% of the candle's body.
High Volume:
Signals are only generated when the volume exceeds a certain threshold, ensuring that signals are issued in active market conditions.
The minimum volume should be adjusted based on the asset. For example, for gold, a minimum volume of 9000 is recommended.
Trading Strategy:
Buy Signals:
A bearish (red) candle is followed by a bullish (green) candle with a body size that is comparable to the previous candle (0.9 to 3 times the body size).
The lower wick of the bullish candle is shorter than that of the previous bearish candle, confirming the validity of the signal.
The RSI must be below 40, indicating an oversold condition.
The volume must exceed the defined threshold (e.g., > 9000 for gold) to confirm an active market.
Sell Signals:
A bullish (green) candle is followed by a bearish (red) candle with a comparable body size.
The upper wick of the bearish candle must be shorter than that of the previous bullish candle and must not exceed 30% of the body size.
The RSI must be above 60, indicating an overbought condition.
The volume must also exceed the minimum threshold for a valid signal.
Usage Guidelines:
Volume Adjustment: It is crucial to adjust the volume threshold depending on the asset you're trading. For example, for assets like gold, a minimum volume of 9000 is recommended to filter out weak signals. Each asset has a different volume dynamic, so test different thresholds on historical data to find the optimal setting.
Time Frame:
It is recommended to use this indicator on a 1-hour (1H) chart for the best signal relevance. This time frame provides a good balance between reactivity and filtering false signals.
Confluence:
Combine the signals from this indicator with other tools like support and resistance levels, moving averages, or chart patterns to increase your chances of success. Confluence of indicators improves the reliability of signals.
Risk Management:
Implement strict risk management. Use stop-losses based on volatility, such as ATR (Average True Range), or the wick size to determine exit points.
Backtesting:
Before using it live, conduct backtesting on various assets to fine-tune the parameters, especially the volume threshold, and to verify performance across different market conditions.
This indicator is an excellent tool for traders looking to identify trend reversals based on solid technical criteria such as RSI, candle structure, and volume. It is particularly effective on volatile assets with precise volume adjustment.

Support and resistance[IMDS Versi]Supply and Demand Zone Indicator
Script ini secara otomatis mengidentifikasi dan menampilkan zona supply (penawaran) dan demand (permintaan) berdasarkan pergerakan harga historis. Zona supply terbentuk di area resistensi, di mana tekanan jual lebih dominan, sementara zona demand terbentuk di area support, di mana tekanan beli lebih kuat.
Fitur utama dalam script ini meliputi:
✅ Identifikasi zona supply & demand secara otomatis
✅ Warna berbeda untuk membedakan zona fresh dan tested
✅ Peringatan ketika harga memasuki zona tertentu
✅ Cocok untuk trading reversal maupun breakout
Script ini membantu trader dalam mengidentifikasi potensi titik masuk dan keluar dengan lebih akurat berdasarkan prinsip Supply & Demand.

[COG]TMS Crossfire 🔍 TMS Crossfire: Guide to Parameters
📊 Core Parameters
🔸 Stochastic Settings (K, D, Period)
- **What it does**: These control how the first stochastic oscillator works. Think of it as measuring momentum speed.
- **K**: Determines how smooth the main stochastic line is. Lower values (1-3) react quickly, higher values (3-9) are smoother.
- **D**: Controls the smoothness of the signal line. Usually kept equal to or slightly higher than K.
- **Period**: How many candles are used to calculate the stochastic. Standard is 14 days, lower for faster signals.
- **For beginners**: Start with the defaults (K:3, D:3, Period:14) until you understand how they work.
🔸 Second Stochastic (K2, D2, Period2)
- **What it does**: Creates a second, independent stochastic for stronger confirmation.
- **How to use**: Can be set identical to the first one, or with slightly different values for dual confirmation.
- **For beginners**: Start with the same values as the first stochastic, then experiment.
🔸 RSI Length
- **What it does**: Controls the period for the RSI calculation, which measures buying/selling pressure.
- **Lower values** (7-9): More sensitive, good for short-term trading
- **Higher values** (14-21): More stable, better for swing trading
- **For beginners**: The default of 11 is a good balance between speed and reliability.
🔸 Cross Level
- **What it does**: The centerline where crosses generate signals (default is 50).
- **Traditional levels**: Stochastics typically use 20/80, but 50 works well for this combined indicator.
- **For beginners**: Keep at 50 to focus on trend following strategies.
🔸 Source
- **What it does**: Determines which price data is used for calculations.
- **Common options**:
- Close: Most common and reliable
- Open: Less common
- High/Low: Used for specialized indicators
- **For beginners**: Stick with "close" as it's most commonly used and reliable.
🎨 Visual Theme Settings
🔸 Bullish/Bearish Main
- **What it does**: Sets the overall color scheme for bullish (up) and bearish (down) movements.
- **For beginners**: Green for bullish and red for bearish is intuitive, but choose any colors that are easy for you to distinguish.
🔸 Bullish/Bearish Entry
- **What it does**: Colors for the entry signals shown directly on the chart.
- **For beginners**: Use bright, attention-grabbing colors that stand out from your chart background.
🌈 Line Colors
🔸 K1, K2, RSI (Bullish/Bearish)
- **What it does**: Controls the colors of each indicator line based on market direction.
- **For beginners**: Use different colors for each line so you can quickly identify which line is which.
⏱️ HTF (Higher Timeframe) Settings
🔸 HTF Timeframe
- **What it does**: Sets which higher timeframe to use for filtering (e.g., 240 = 4 hour chart).
- **How to choose**: Should be at least 4x your current chart timeframe (e.g., if trading on 15min, use 60min or higher).
- **For beginners**: Start with a timeframe 4x higher than your trading chart.
🔸 Use HTF Filter
- **What it does**: Toggles whether the higher timeframe filter is applied or not.
- **For beginners**: Keep enabled to reduce false signals, especially when learning.
🔸 HTF Confirmation Bars
- **What it does**: How many bars must confirm a trend change on higher timeframe.
- **Higher values**: More reliable but slower to react
- **Lower values**: Faster signals but more false positives
- **For beginners**: Start with 2-3 bars for a good balance.
📈 EMA Settings
🔸 Use EMA Filter
- **What it does**: Toggles price filtering with an Exponential Moving Average.
- **For beginners**: Keep enabled for better trend confirmation.
🔸 EMA Period
- **What it does**: Length of the EMA for filtering (shorter = faster reactions).
- **Common values**:
- 5-13: Short-term trends
- 21-50: Medium-term trends
- 100-200: Long-term trends
- **For beginners**: 5-10 is good for short-term trading, 21 for swing trading.
🔸 EMA Offset
- **What it does**: Shifts the EMA forward or backward on the chart.
- **For beginners**: Start with 0 and adjust only if needed for visual clarity.
🔸 Show EMA on Chart
- **What it does**: Toggles whether the EMA appears on your main price chart.
- **For beginners**: Keep enabled to see how price relates to the EMA.
🔸 EMA Color, Style, Width, Transparency
- **What it does**: Customizes how the EMA line looks on your chart.
- **For beginners**: Choose settings that make the EMA visible but not distracting.
🌊 Trend Filter Settings
🔸 Use EMA Trend Filter
- **What it does**: Enables a multi-EMA system that defines the overall market trend.
- **For beginners**: Keep enabled for stronger trend confirmation.
🔸 Show Trend EMAs
- **What it does**: Toggles visibility of the trend EMAs on your chart.
- **For beginners**: Enable to see how price moves relative to multiple EMAs.
🔸 EMA Line Thickness
- **What it does**: Controls how the thickness of EMA lines is determined.
- **Options**:
- Uniform: All EMAs have the same thickness
- Variable: Each EMA has its own custom thickness
- Hierarchical: Automatically sized based on period (longer periods = thicker)
- **For beginners**: "Hierarchical" is most intuitive as longer-term EMAs appear more dominant.
🔸 EMA Line Style
- **What it does**: Sets the line style (solid, dotted, dashed) for all EMAs.
- **For beginners**: "Solid" is usually clearest unless you have many lines overlapping.
🎭 Trend Filter Colors/Width
🔸 EMA Colors (8, 21, 34, 55)
- **What it does**: Sets the color for each individual trend EMA.
- **For beginners**: Use a logical progression (e.g., shorter EMAs brighter, longer EMAs darker).
🔸 EMA Width Settings
- **What it does**: Controls the thickness of each EMA line.
- **For beginners**: Thicker lines for longer EMAs make them easier to distinguish.
🔔 How These Parameters Work Together
The power of this indicator comes from how these components interact:
1. **Base Oscillator**: The stochastic and RSI components create the main oscillator
2. **HTF Filter**: The higher timeframe filter prevents trading against larger trends
3. **EMA Filter**: The EMA filter confirms signals with price action
4. **Trend System**: The multi-EMA system identifies the overall market environment
Think of it as multiple layers of confirmation, each adding more reliability to your trading signals.
💡 Tips for Beginners
1. **Start with defaults**: Use the default settings first and understand what each element does
2. **One change at a time**: When customizing, change only one parameter at a time
3. **Keep notes**: Write down how each change affects your results
4. **Backtest thoroughly**: Test any changes on historical data before trading real money
5. **Less is more**: Sometimes simpler settings work better than complicated ones
Remember, no indicator is perfect - always combine this with proper risk management and other forms of analysis!


Advanced Trend Detector (Optimized)The Advanced Trend Detector is a powerful trend-following indicator that identifies market trends, major reversals, and key candlestick patterns. It also includes a floating information panel (HUD) that updates in real time, providing insights into the current trend and detected candlestick patterns.


Manipulation CandleMC Indicator – Spot Market Manipulation Like a Pro! 🎯✨
This Manipulation Candle (MC) Indicator helps traders detect price manipulation patterns based on FundedBrothers’ methodology. It identifies bullish and bearish manipulation candles, as well as their attempted versions, allowing traders to better understand market moves.
What It Does:
🔹 Highlights Bullish MCs (Green 🟢) – Signals potential upward manipulation
🔹 Highlights Bearish MCs (Red 🔴) – Signals potential downward manipulation
🔹 Marks Attempted bullish and bearish MCs with a purple A🟣 and directional arrow ⬆️⬇️🟣
🔹 Alerts Included – Stay informed in real-time when manipulation occurs
🔹 Custom Markers – Easy-to-read symbols for clear market insights
This indicator is a must-have for traders looking to capitalise on smart money movements and avoid market traps.
🛠️ Created by @iulipedia
📈 TradingView v5 Compatible
🚀 Add this to your chart and stay ahead of market moves!

Wave Modulation Demo█ OVERVIEW
This script demonstrates Stacked Wave Modulation by visualizing four interconnected waves. Wave 1 is the base wave, influencing Wave 2's frequency, which in turn modulates Wave 3's amplitude, and finally, Wave 3 modulates Wave 4's phase. Explore the fascinating effects of wave modulation by adjusting the inputs for each wave and their modulation scales.
══════════════════════════════════════════════════
█ CONCEPTS
This script visualizes a cascade of wave modulations:
1 — Base Wave (Wave 1): This is the foundational wave. Its parameters (type, frequency, amplitude, phase, vertical shift) are directly controlled and serve as the basis for subsequent modulations.
2 — Frequency Modulation (Wave 2): Wave 2's frequency is modulated by Wave 1 . As Wave 1 oscillates, it dynamically changes the frequency of Wave 2 , creating interesting frequency variations. The Frequency Mod Scale input controls the intensity of this modulation.
3 — Amplitude Modulation (Wave 3): Building upon the cascade, Wave 3 's amplitude is modulated by Wave 2 . The peaks and troughs of Wave 2 influence the amplitude of Wave 3 , resulting in amplitude variations. The Amplitude Mod Scale input adjusts the strength of this amplitude modulation.
4 — Phase Modulation (Wave 4): Finally, Wave 4 's phase is modulated by Wave 3 . Wave 3 's oscillations shift the phase of Wave 4 , leading to phase-related distortions and dynamic wave patterns. The Phase Mod Scale input determines the extent of phase modulation.
5 — Stacked Wave (Average): The script calculates and plots the average of all four waves, providing a composite view of the combined modulation effects.
══════════════════════════════════════════════════
█ FEATURES
The script is organized into input groups for each wave, allowing for detailed customization:
1 — Wave 1: Base Wave
• Type : Select the waveform type for Wave 1 (Sine, Cosine, Triangle, Square).
• Frequency (Hz) : Sets the base frequency of Wave 1 in Hertz (cycles per second).
• Amplitude : Controls the vertical amplitude or height of Wave 1.
• Phase Shift (deg) : Adjusts the phase shift of Wave 1 in degrees, shifting the wave horizontally.
• Vertical Shift : Sets the vertical position of Wave 1 on the chart.
2 — Wave 2: Frequency Modulation
• Type : Select the waveform type for Wave 2.
• Base Frequency (Hz) : Sets the base frequency of Wave 2, before modulation.
• Amplitude : Controls the amplitude of Wave 2.
• Phase Shift (deg) : Adjusts the phase shift of Wave 2.
• Vertical Shift : Sets the vertical position of Wave 2.
• Frequency Mod Scale : Determines the degree to which Wave 1 modulates Wave 2's frequency. Higher values increase the modulation effect.
3 — Wave 3: Amplitude Modulation
• Type : Select the waveform type for Wave 3.
• Base Frequency (Hz) : Sets the base frequency of Wave 3.
• Amplitude : Controls the base amplitude of Wave 3, before modulation.
• Phase Shift (deg) : Adjusts the phase shift of Wave 3.
• Vertical Shift : Sets the vertical position of Wave 3.
• Amplitude Mod Scale : Determines the degree to which Wave 2 modulates Wave 3's amplitude. Higher values increase the modulation effect.
4 — Wave 4: Phase Modulation
• Type : Select the waveform type for Wave 4.
• Base Frequency (Hz) : Sets the base frequency of Wave 4.
• Amplitude : Controls the amplitude of Wave 4.
• Phase Shift (deg) : Sets the base phase shift of Wave 4, before modulation.
• Vertical Shift : Sets the vertical position of Wave 4.
• Phase Mod Scale : Determines the degree to which Wave 3 modulates Wave 4's phase. Higher values increase the modulation effect.
══════════════════════════════════════════════════
█ HOW TO USE
1. Add the "Stacked Wave Modulation Demo" script to your TradingView chart.
2. Explore the input settings. Each wave has its own group of customizable parameters.
3. Adjust the Type , Frequency , Amplitude , Phase Shift , and Vertical Shift for each wave to define their base characteristics.
4. Experiment with the modulation scales ( Frequency Mod Scale , Amplitude Mod Scale , Phase Mod Scale ) to control the intensity of the modulation effects between the waves.
5. Observe how the waves interact and how the modulations shape their forms and the final stacked wave (average).
══════════════════════════════════════════════════
█ NOTES
* This script utilizes the `waves` and `hsvColor` libraries. Look for other scripts on my profile.
* The frequencies are set in Hertz (cycles per second), which relate to bars on the chart. A frequency of 0.5 Hz means 0.5 cycles per bar, or 1 cycle every 2 bars.
* Adjusting the modulation scales allows you to fine-tune the visual impact of the modulation effects.
* The color of each wave plot is dynamically generated based on its value using the HSV color model for visual distinction.
* Feel free to modify and experiment with the script to create different modulation schemes or stacking methods.
Let me know if you have any other questions or would like further refinements!

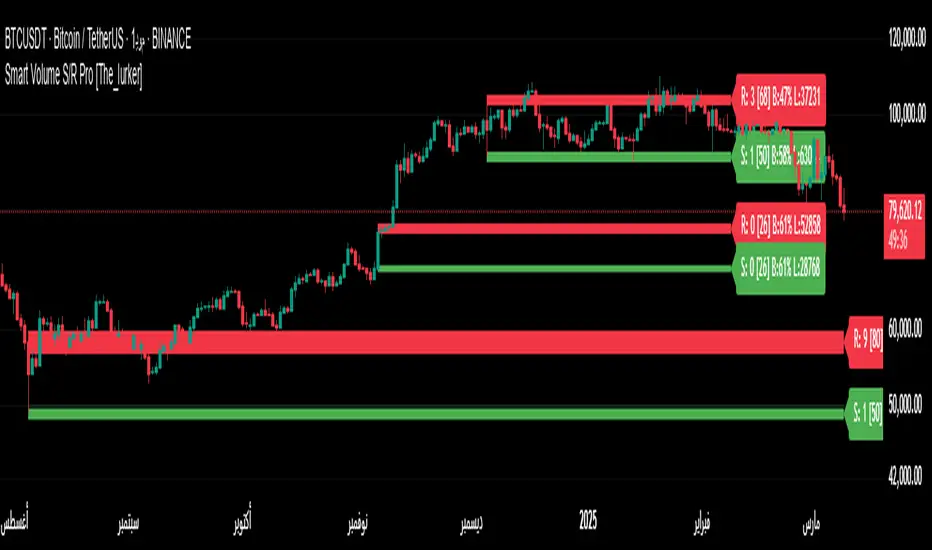
Smart Volume S/R Pro [The_lurker]مؤشر "Smart Volume S/R Pro " هو أداة تحليل فني متقدمة مصممة لمساعدة المتداولين في تحديد مستويات الدعم والمقاومة القوية بناءً على حجم التداول، مع إضافة ميزات تحليلية متطورة مثل تصفية الاتجاه ، مناطق الثقة ، تقييم القوة ، حساب احتمالية الاختراق ، قياس السيولة ، تحديد الأهداف السعرية ، ومستويات فيبوناتشي . وايضا تقديم تسميات (Labels) بجانب كل مستوى دعم ومقاومة، تحتوي على أرقام ومعلومات دقيقة تعكس حالة السوق. هذه التسميات ليست مجرد زينة، بل أدوات تحليلية تساعد المتداولين على اتخاذ قرارات مستنيرة بناءً على بيانات السوقيهدف هذا المؤشر إلى توفير رؤية شاملة للسوق .
الوظائف الرئيسية للمؤشر
1- تحديد مستويات الدعم والمقاومة بناءً على حجم التداول العالي
يقوم المؤشر بتحليل الأشرطة (Bars) السابقة (حتى 300 شريط افتراضيًا) لتحديد النقاط التي شهدت أعلى مستويات حجم التداول.
يرسم خطوط أفقية تمثل مستويات المقاومة (عند أعلى سعر في تلك الأشرطة) والدعم (عند أدنى سعر)، ويمكن للمستخدم اختيار عدد الخطوط المعروضة (من 1 إلى 6).
2- تصفية الاتجاه باستخدام مؤشر ADX
يستخدم المؤشر مؤشر الاتجاه المتوسط (ADX) لتقييم قوة الاتجاه في السوق.
عندما تكون قوة الاتجاه عالية (تتجاوز عتبة محددة، 25 افتراضيًا)، يقلل المؤشر عدد مستويات الدعم والمقاومة المعروضة للتركيز فقط على المستويات الأكثر أهمية.
3- مناطق الثقة الديناميكية
يضيف المؤشر مناطق حول مستويات الدعم والمقاومة بناءً على متوسط المدى الحقيقي (ATR)، مما يساعد المتداولين على تصور النطاقات التي قد يتفاعل فيها السعر مع هذه المستويات.
يمكن تعديل عرض هذه المناطق باستخدام مضاعف ATR.
4- تقييم قوة المستويات
يحسب المؤشر قوة كل مستوى بناءً على حجم التداول، عدد المرات التي تم اختبار المستوى فيها (Touch Count)، وقرب السعر الحالي من المستوى.
يتم عرض درجة القوة (من 0 إلى 100) بجانب كل مستوى إذا تم تفعيل هذه الخاصية.
5- احتمالية الاختراق
يقدّر المؤشر احتمالية اختراق كل مستوى بناءً على الزخم (ROC)، قوة المستوى، والمسافة بين السعر الحالي والمستوى.
يظهر الاحتمال كنسبة مئوية إذا تم تفعيل الخيار، مما يساعد المتداولين على توقع الحركات المحتملة.
6- تحليل السيولة التاريخية
يقيس المؤشر السيولة حول كل مستوى بناءً على حجم التداول في النطاقات القريبة منه.
يمكن عرض قيم السيولة في التسميات أو استخدامها لتعديل عرض الخطوط (الخطوط الأكثر سيولة تظهر أعرض).
7- الأهداف السعرية
عند تفعيل هذه الخاصية، يحسب المؤشر أهداف سعرية للاختراق (Breakout) والارتداد (Reversal) بناءً على الزخم وقوة المستوى وATR.
يمكن عرض هذه الأهداف كنصوص في التسميات أو كخطوط أفقية على الرسم البياني.
8- مستويات فيبوناتشي
يرسم المؤشر مستويات فيبوناتشي (0.0، 0.236، 0.382، 0.5، 0.618، 0.786، 1.0) بناءً على أعلى وأدنى سعر في فترة النظرة الخلفية.
يمكن للمستخدم اختيار أي من هذه المستويات لعرضها أو إخفائها.
9- تنبيه شامل للاختراق
يوفر المؤشر تنبيهًا واحدًا يشمل جميع المستويات، حيث يُطلق التنبيه عندما يخترق السعر أي مستوى دعم أو مقاومة مع رسالة توضح نوع الاختراق والمستوى المخترق.
كيفية عمل المؤشر
الخطوة الأولى: يحدد المؤشر الأشرطة ذات الحجم العالي خلال فترة النظرة الخلفية المحددة (Lookback Period).
الخطوة الثانية: يرسم مستويات الدعم والمقاومة بناءً على أعلى وأدنى الأسعار في تلك الأشرطة، مع مراعاة عدد الخطوط المختارة من المستخدم.
الخطوة الثالثة: يطبق مرشح الاتجاه (إذا كان مفعلاً) لتقليل عدد المستويات في حالة الاتجاه القوي.
الخطوة الرابعة: يضيف التحليلات الإضافية مثل القوة، السيولة، احتمالية الاختراق، والأهداف السعرية، ويرسم مناطق الثقة ومستويات فيبوناتشي حسب الإعدادات.
الخطوة الخامسة: يراقب السعر ويطلق تنبيهًا عند الاختراق.
الإعدادات القابلة للتخصيص
1- فترة النظرة الخلفية (Lookback Period): عدد الأشرطة التي يتم تحليلها (افتراضيًا 300).
2- عدد الخطوط (Number of Lines): من 1 إلى 6 مستويات دعم ومقاومة.
3- الألوان والأنماط: يمكن تغيير ألوان الخطوط وأنماطها (ممتلئة، متقطعة، منقطة).
4- التسميات: تفعيل/تعطيل التسميات، وحجمها، وموقعها، ولون النص.
5- مرشح الاتجاه: تفعيل/تعطيل ADX، وتعديل طوله وعتبته.
6- مناطق الثقة: تفعيل/تعطيل، وتعديل طول ATR ومضاعفه.
7- القوة واحتمالية الاختراق: تفعيل/تعطيل العرض، وتعديل طول ROC.
8- السيولة: تفعيل/تعطيل تأثير السيولة على عرض الخطوط وقيمها في التسميات.
9- الأهداف السعرية: تفعيل/تعطيل الأهداف وعرضها كخطوط.
10- فيبوناتشي: اختيار المستويات المعروضة ولون الخطوط.
فوائد المؤشر
دقة عالية: يعتمد على حجم التداول لتحديد المستويات، مما يجعله أكثر موثوقية من المستويات العشوائية.
مرونة: يوفر خيارات تخصيص واسعة تتيح للمتداولين تكييفه حسب استراتيجياتهم.
تحليل شامل: يجمع بين الدعم والمقاومة، الاتجاه، السيولة، والأهداف في أداة واحدة.
سهولة الاستخدام: التسميات والتنبيهات تجعل من السهل متابعة السوق دون تعقيد.
==================================================================================تسميات (Labels) بجانب كل مستوى دعم ومقاومة، تحتوي على أرقام ومعلومات دقيقة تعكس حالة السوق. هذه التسميات ليست مجرد زينة، بل أدوات تحليلية تساعد المتداولين على اتخاذ قرارات مستنيرة بناءً على بيانات السوق. في هذا الشرح، سنستعرض كل رقم أو قيمة تظهر في التسميات ومعناها العملي.
مكونات التسميات
التسميات تظهر بجانب كل مستوى دعم (Support) ومقاومة (Resistance) وتبدأ بحرف "S" للدعم أو "R" للمقاومة، تليها مجموعة من الأرقام والقيم التي يمكن تفعيلها أو تعطيلها حسب إعدادات المستخدم. إليك تفصيل كل عنصر:
1- عدد اللمسات (Touch Count)
الرمز: يظهر مباشرة بعد "S" أو "R" (مثال: "R: 5" أو "S: 3").
المعنى: يشير إلى عدد المرات التي اختبر فيها السعر هذا المستوى دون اختراقه.
الفائدة: كلما زاد عدد اللمسات، كلما كان المستوى أقوى وأكثر أهمية. على سبيل المثال، إذا كان "R: 5"، فهذا يعني أن السعر ارتد من هذا المستوى 5 مرات، مما يجعله مقاومة قوية محتملة.
2- قوة المستوى (Strength Rating)
الرمز: يظهر بين قوسين مربعين (مثال: " ").
المعنى: قيمة من 0 إلى 100 تعكس قوة المستوى بناءً على عوامل مثل حجم التداول، عدد اللمسات، وقرب السعر الحالي من المستوى.
الفائدة: القيم العالية (مثل 75 أو أكثر) تشير إلى مستوى قوي يصعب اختراقه، بينما القيم المنخفضة (مثل 30 أو أقل) تدل على ضعف المستوى وسهولة اختراقه. يمكن للمتداول استخدام هذا لتحديد المستويات الأكثر موثوقية.
3- احتمالية الاختراق (Breakout Probability)
الرمز: يبدأ بحرف "B" متبوعًا بنسبة مئوية (مثال: "B: 60%").
المعنى: نسبة من 0% إلى 100% تُظهر احتمالية اختراق السعر للمستوى بناءً على الزخم الحالي، قوة المستوى، والمسافة بين السعر والمستوى.
الفائدة: نسبة مرتفعة (مثل 60% أو أكثر) تعني أن السعر قد يخترق المستوى قريبًا، بينما النسب المنخفضة (مثل 20%) تشير إلى احتمال ارتداد السعر. هذا مفيد لتوقع الحركة التالية.
4- قيمة السيولة (Liquidity Value)
الرمز: يبدأ بحرف "L" متبوعًا برقم (مثال: "L: 1200").
المعنى: يمثل متوسط حجم التداول في النطاق القريب من المستوى، مما يعكس السيولة التاريخية حوله.
الفائدة: القيم العالية تدل على وجود سيولة كبيرة، مما يعني أن السعر قد يتفاعل بقوة مع هذا المستوى (إما بالارتداد أو الاختراق). القيم المنخفضة تشير إلى سيولة ضعيفة، مما قد يجعل المستوى أقل تأثيرًا.
5- الأهداف السعرية (Price Targets)
الرمز: يبدأ بـ "BT" (هدف الاختراق) و"RT" (هدف الارتداد) متبوعين بأرقام (مثال: "BT: 150.50 RT: 148.20").
المعنى:
BT (Breakout Target): السعر المحتمل الذي قد يصل إليه السعر بعد اختراق المستوى.
RT (Reversal Target): السعر المحتمل الذي قد يصل إليه السعر إذا ارتد من المستوى.
الفائدة: تساعد المتداولين في تحديد نقاط الخروج المحتملة بعد الاختراق أو الارتداد، مما يسهل وضع خطة تداول دقيقة.
أمثلة عملية
تسمية مقاومة: "R: 4 B: 25% L: 1500 BT: 155.00 RT: 152.00"
المستوى اختُبر 4 مرات، قوته 80 (قوي جدًا)، احتمالية الاختراق 25% (منخفضة، أي احتمال ارتداد أعلى)، السيولة 1500 (مرتفعة)، هدف الاختراق 155.00، هدف الارتداد 152.00.
الاستنتاج: المستوى قوي ومن المرجح أن يرتد السعر منه، لكن إذا اخترق، فقد يصل إلى 155.00.
تسمية دعم: "S: 2 B: 70% L: 800 BT: 145.00 RT: 147.50"
المستوى اختُبر مرتين، قوته 40 (متوسطة إلى ضعيفة)، احتمالية الاختراق 70% (مرتفعة)، السيولة 800 (متوسطة)، هدف الاختراق 145.00، هدف الارتداد 147.50.
الاستنتاج: المستوى ضعيف ومن المحتمل أن يخترقه السعر ليهبط إلى 145.00.
كيفية الاستفادة من التسميات
تحديد القوة والضعف: استخدم قوة المستوى (Strength) لمعرفة ما إذا كان المستوى موثوقًا للارتداد أو عرضة للاختراق.
توقع الحركة: انظر إلى احتمالية الاختراق (Breakout Probability) لتحديد ما إذا كنت ستنتظر اختراقًا أو ترتدًا.
إدارة المخاطر: استخدم الأهداف السعرية (BT وRT) لتحديد نقاط جني الأرباح أو وقف الخسارة.
تقييم السيولة: ركز على المستويات ذات السيولة العالية لأنها غالبًا تكون نقاط تحول رئيسية في السوق.
تأكيد التحليل: ادمج عدد اللمسات مع القوة والسيولة للحصول على صورة كاملة عن أهمية المستوى.
تخصيص التسميات
يمكن للمستخدم تفعيل أو تعطيل أي من هذه القيم (القوة، الاحتمالية، السيولة، الأهداف) من إعدادات المؤشر.
يمكن أيضًا تغيير حجم التسميات (صغير، عادي، كبير)، موقعها (يمين، يسار، أعلى، أسفل)، ولون النص لتناسب احتياجاتك.
التسميات في هذا المؤشر هي بمثابة لوحة تحكم صغيرة بجانب كل مستوى دعم ومقاومة، تقدم لك معلومات فورية عن قوته، احتمالية اختراقه، سيولته، وأهدافه السعرية. بفهم هذه الأرقام، يمكنك تحسين قراراتك في التداول، سواء كنت تبحث عن نقاط دخول، خروج، أو إدارة مخاطر. إذا كنت تريد أداة تجمع بين البساطة والعمق التحليلي .
تنويه:
المؤشر هو أداة مساعدة فقط ويجب استخدامه مع التحليل الفني والأساسي لتحقيق أفضل النتائج.
إخلاء المسؤولية
لا يُقصد بالمعلومات والمنشورات أن تكون، أو تشكل، أي نصيحة مالية أو استثمارية أو تجارية أو أنواع أخرى من النصائح أو التوصيات المقدمة أو المعتمدة من TradingView.
The Smart Volume S/R Pro indicator is an advanced technical analysis tool designed to help traders identify strong support and resistance levels based on trading volume, with the addition of advanced analytical features such as trend filtering, confidence zones, strength assessment, breakout probability calculation, liquidity measurement, price target identification, and Fibonacci levels. It also provides labels next to each support and resistance level, containing accurate numbers and information that reflect the market condition. These labels are not just decorations, but analytical tools that help traders make informed decisions based on market data. This indicator aims to provide a comprehensive view of the market.
Main functions of the indicator
1- Identifying support and resistance levels based on high trading volume
The indicator analyzes previous bars (up to 300 bars by default) to identify the points that witnessed the highest levels of trading volume.
It draws horizontal lines representing resistance levels (at the highest price in those bars) and support (at the lowest price), and the user can choose the number of lines displayed (from 1 to 6).
2- Filtering the trend using the ADX indicator
The indicator uses the Average Directional Index (ADX) to assess the strength of a trend in the market.
When the strength of the trend is high (exceeding a specified threshold, 25 by default), the indicator reduces the number of support and resistance levels displayed to focus only on the most important levels.
3- Dynamic Confidence Zones
The indicator adds zones around support and resistance levels based on the Average True Range (ATR), helping traders visualize the ranges in which the price may interact with these levels.
The width of these zones can be adjusted using the ATR multiplier.
4- Assessing the Strength of Levels
The indicator calculates the strength of each level based on trading volume, the number of times the level has been tested (Touch Count), and the proximity of the current price to the level.
A strength score (from 0 to 100) is displayed next to each level if this feature is enabled.
5- Breakout Probability
The indicator estimates the probability of breaking each level based on momentum (ROC), the strength of the level, and the distance between the current price and the level.
The probability is displayed as a percentage if the option is enabled, helping traders anticipate potential moves.
6- Historical Liquidity Analysis
The indicator measures liquidity around each level based on the trading volume in the ranges near it.
The liquidity values can be displayed in the labels or used to adjust the width of the lines (the most liquid lines appear wider).
7- Price Targets
When this feature is enabled, the indicator calculates price targets for breakout and reversal based on momentum, level strength and ATR.
These targets can be displayed as text in the labels or as horizontal lines on the chart.
8- Fibonacci Levels
The indicator plots Fibonacci levels (0.0, 0.236, 0.382, 0.5, 0.618, 0.786, 1.0) based on the highest and lowest price in the lookback period.
The user can choose which of these levels to display or hide.
9- Comprehensive Breakout Alert
The indicator provides a single alert that includes all levels, where the alert is triggered when the price breaks any support or resistance level with a message explaining the type of breakout and the level broken.
How the indicator works
Step 1: The indicator identifies the bars with high volume during the specified Lookback Period.
Step 2: Draws support and resistance levels based on the highest and lowest prices in those bars, taking into account the number of lines selected by the user.
Step 3: Apply the trend filter (if enabled) to reduce the number of levels in case of a strong trend.
Step 4: Adds additional analyses such as strength, liquidity, breakout probability, and price targets, and draws confidence zones and Fibonacci levels according to the settings.
Step 5: Monitors the price and triggers an alert when the breakout occurs.
Customizable Settings
1- Lookback Period: Number of bars to analyze (default 300).
2- Number of Lines: From 1 to 6 support and resistance levels.
3- Colors and Styles: Line colors and styles can be changed (filled, dashed, dotted).
4- Labels: Enable/disable labels, their size, location, and text color.
5- Trend Filter: Enable/disable ADX, and modify its length and threshold.
6- Confidence Zones: Enable/disable, and modify the ATR length and multiplier.
7- Strength and Breakout Probability: Enable/disable the display, and modify the ROC length.
8- Liquidity: Enable/disable the effect of liquidity on the display of the lines and their values in the labels.
9- Price Targets: Enable/disable the targets and display them as lines.
10- Fibonacci: Choose the displayed levels and the color of the lines.
Indicator Benefits
High Accuracy: It relies on trading volume to determine the levels, which makes it more reliable than random levels.
Flexibility: It provides extensive customization options that allow traders to adapt it to their strategies.
Comprehensive Analysis: Combines support and resistance, trend, liquidity, and targets in one tool. Ease of Use: Labels and alerts make it easy to follow the market without complexity.
Labels next to each support and resistance level contain accurate numbers and information that reflect the market situation. These labels are not just decorations, but analytical tools that help traders make informed decisions based on market data. In this explanation, we will review each number or value that appears in the labels and their practical meaning.
Label Components
Labels appear next to each support and resistance level and begin with the letter "S" for support or "R" for resistance, followed by a set of numbers and values that can be enabled or disabled according to the user's settings. Here is a breakdown of each element:
1- Touch Count
Symbol: Appears immediately after "S" or "R" (example: "R: 5" or "S: 3").
Meaning: Indicates the number of times the price has tested this level without breaking it.
Benefit: The more touches, the stronger and more important the level. For example, if it is "R: 5", it means that the price has bounced off this level 5 times, making it a potentially strong resistance.
2- Strength Rating
Symbol: Appears between square brackets (example: " ").
Meaning: A value from 0 to 100 that reflects the strength of the level based on factors such as trading volume, number of touches, and proximity of the current price to the level.
Benefit: High values (such as 75 or more) indicate a strong level that is difficult to break, while low values (such as 30 or less) indicate a weak level that is easy to break. A trader can use this to determine the most reliable levels.
3- Breakout Probability
Symbol: Starts with the letter "B" followed by a percentage (example: "B: 60%").
Meaning: A percentage from 0% to 100% that shows the probability of the price breaking the level based on the current momentum, the strength of the level, and the distance between the price and the level.
Interest: A high percentage (such as 60% or more) means that the price may soon break through the level, while low percentages (such as 20%) indicate that the price may bounce. This is useful for anticipating the next move.
4- Liquidity Value
Symbol: Starts with the letter "L" followed by a number (example: "L: 1200").
Meaning: Represents the average trading volume in the range near the level, reflecting historical liquidity around it.
Interest: High values indicate high liquidity, meaning that the price may react strongly to this level (either by bouncing or breaking through). Low values indicate low liquidity, which may make the level less influential.
5- Price Targets
Symbol: Starts with "BT" (breakout target) and "RT" (rebound target) followed by numbers (example: "BT: 150.50 RT: 148.20").
Meaning:
BT (Breakout Target): The potential price that the price may reach after breaking the level.
RT (Reversal Target): The potential price that the price may reach if it rebounds from the level.
Utility: Helps traders identify potential exit points after a breakout or rebound, making it easier to develop an accurate trading plan.
Working examples
Resistance label: "R: 4 B: 25% L: 1500 BT: 155.00 RT: 152.00"
Level tested 4 times, strength 80 (very strong), probability of breakout 25% (low, i.e. higher probability of rebound), liquidity 1500 (high), breakout target 155.00, rebound target 152.00.
Conclusion: The level is strong and the price is likely to rebound from it, but if it breaks, it may reach 155.00.
Support Label: "S: 2 B: 70% L: 800 BT: 145.00 RT: 147.50"
Level tested twice, Strength 40 (medium to weak), Breakout Probability 70% (high), Liquidity 800 (medium), Breakout Target 145.00, Rebound Target 147.50.
Conclusion: The level is weak and the price is likely to break it to drop to 145.00.
How to use labels
Determine strength and weakness: Use the level's strength to see if the level is reliable for a bounce or vulnerable to a breakout.
Predict the move: Look at the Breakout Probability to determine whether to wait for a breakout or a bounce.
Risk Management: Use price targets (BT and RT) to set take profit or stop loss points.
Liquidity Evaluation: Focus on levels with high liquidity as they are often key turning points in the market.
Analysis Confirmation: Combine the number of touches with strength and liquidity to get a complete picture of the level’s importance.
Customize Labels
The user can enable or disable any of these values (strength, probability, liquidity, targets) from the indicator settings.
The size of the labels (small, normal, large), their position (right, left, top, bottom), and the color of the text can also be changed to suit your needs.
The labels in this indicator act as a small dashboard next to each support and resistance level, providing you with instant information about its strength, probability of breakout, liquidity, and price targets. By understanding these numbers, you can improve your trading decisions, whether you are looking for entry points, exit points, or risk management. If you want a tool that combines simplicity with analytical depth.
Disclaimer:
The indicator is an auxiliary tool only and should be used in conjunction with technical and fundamental analysis for best results.
Disclaimer
The information and posts are not intended to be, or constitute, any financial, investment, trading or other types of advice or recommendations provided or endorsed by TradingView.
Advanced RSI Divergence with Smoothing MAThis script combines RSI Divergence detection with a Smoothing Moving Average (MA) overlay on the RSI, offering traders a powerful tool to identify potential trend reversals and confirm signals. By smoothing the RSI line, the script reduces noise and provides clearer visualization of market conditions, making it easier to spot high-probability trading opportunities.
The script is designed to detect both Regular and Hidden Divergences, which are key indicators of potential trend reversals or continuations. Additionally, it includes a customizable MA overlay on the RSI line, along with optional Bollinger Bands for added volatility insights.
Key Features:
1. RSI Divergence Detection:
Identifies Regular Bullish and Bearish Divergences (potential trend reversals).
Detects Hidden Bullish and Bearish Divergences (potential trend continuations).
Plots clear labels and trendlines on the chart to highlight divergence signals.
2. Smoothing Moving Average (MA):
Adds a customizable MA overlay on the RSI line to smooth out noise and improve signal clarity.
Supports multiple MA types: SMA, EMA, SMMA (RMA), WMA, VWMA.
Optional Bollinger Bands around the MA for additional volatility insights.
3. Customizable Inputs:
Adjustable RSI period, source, and divergence lookback settings.
Configurable MA type, length, and Bollinger Bands settings.
4. Visual Enhancements:
Plots RSI with overbought/oversold levels (70/30).
Adds gradient fills for overbought and oversold regions for better visualization.
Displays the smoothing MA as a yellow line for easy identification.
5. Alerts:
Built-in alerts for Regular Bullish/Bearish Divergences and Hidden Bullish/Bearish Divergences.
Why This Script is Unique:
While RSI divergence detection is a common concept, this script stands out by combining it with a smoothing MA overlay and optional Bollinger Bands on the RSI line. This unique combination:
Reduces noise and false signals by smoothing the RSI line.
Provides additional confirmation of divergence signals through the MA overlay.
Offers flexibility with multiple MA types and customizable settings to adapt to different trading styles and market conditions.
The integration of Bollinger Bands around the MA further enhances the script by providing insights into RSI volatility, which is not commonly available in open-source RSI divergence scripts.
Why Closed-Source:
This script uses a proprietary combination of RSI divergence detection, smoothing MA overlays, and Bollinger Bands to create a unique and highly effective trading tool. The specific logic and calculations used to combine these elements are the result of extensive research and backtesting, and the source code is protected to maintain its competitive edge.
How to Use:
Apply the script to your chart and adjust the RSI and MA settings to suit your trading strategy.
Look for divergence signals (Regular or Hidden) confirmed by the smoothing MA.
Use the Bollinger Bands (if enabled) to gauge RSI volatility and filter out low-probability signals.
Set up alerts for divergence signals to stay informed of potential trading opportunities.

Trend Filter with 3 EMAs [9;21;50]Trend Filter with 3 EMAs
This indicator filters the current Trend by analysing the order of 3 EMAs :
- 9 EMA (fast)
- 21 EMA (moderate)
- 50 EMA (slow)
If the 9 is above the 21 and the 50, and the 21 above the 50, the trend is bullish (green)
If the 9 is below the 21 and the 50, and the 21 below the 50, the trend is bearish (red)
If none of the above conditions are met, the market ist ranging and the moving averages are gray .
All three EMAs can act as dynamic support & resistance.
⚠️ Important info: ⚠️
Do not use the indicator on its own. No indicator is magic. Only use in confluence with other price action methods.


MACD + SMA + VWMAMACD + SMA + VWMA v.2.0 for Nikolay
MACD + SMA + VWMA v.2.0 for Nikolay
MACD + SMA + VWMA v.2.0 for Nikolay

18 EMA FVG VWAP • NinaThis indicator uses my EMA ribbon for pullbacks and entries as well as daily, high of day and low of day VWAPS for confirmation. There are also multi-timeframe FVG's for additional confluence

Supertrend with Percentage HysteresisThis Pine Script indicator is designed to generate buy and sell signals based on the Supertrend indicator, with an added layer of hysteresis to filter out small, insignificant price fluctuations. It provides visual cues through background coloring and buy/sell arrows.
Key Features:
Supertrend Calculation:
The script calculates the Supertrend indicator using the Average True Range (ATR).
Users can customize the ATR period and multiplier through input parameters.
It offers the option to choose between two ATR calculation methods.
Percentage-Based Hysteresis:
To prevent signals from flipping back and forth due to minor price changes, the script incorporates a percentage-based hysteresis.
Users can adjust the hysteresis percentage through the "Hysteresis Percentage" input.
This feature ensures that a signal change only occurs when the price moves beyond a certain percentage threshold, effectively filtering out noise.
Buy and Sell Signal Generation:
Buy signals are generated when the Supertrend indicates an uptrend and the price crosses above a calculated hysteresis level.
Sell signals are generated when the Supertrend indicates a downtrend and the price crosses below a calculated hysteresis level.
The script stores the previous trend, so signals are only generated when the trend changes.
Visual Cues:
Buy/Sell Arrows: Green upward-pointing triangles are plotted below the chart for buy signals, and red downward-pointing triangles are plotted above the chart for sell signals.
Background Coloring: The background below the chart is colored green during buy signals, and the background above the chart is colored red during sell signals.
The Supertrend lines themselves are not plotted, leaving a cleaner chart.
Alerts:
The script includes alert conditions for buy and sell signals, allowing users to receive notifications when signals are generated.
Input Parameters:
ATR Period: The period used to calculate the Average True Range (ATR).
ATR Multiplier: The multiplier applied to the ATR.
Change ATR Calculation Method?: A boolean option to switch between different ATR calculation methods.
Hysteresis Percentage: The percentage threshold that the price must move beyond to trigger a signal change.
How It Works:
Supertrend Calculation: The script first calculates the Supertrend indicator based on the user-defined parameters.
Hysteresis Levels: It then calculates the hysteresis levels based on the Supertrend lines and the hysteresis percentage.
Signal Generation: The script monitors the Supertrend direction and price movements. When the price crosses a hysteresis level in the opposite direction of the current trend, a signal is generated.
Visual and Alert Outputs: The script plots arrows, colors the background, and triggers alerts based on the generated signals.
Use Cases:
This indicator is useful for traders who want to identify potential trend reversals while minimizing the impact of short-term price fluctuations.
It can be used in various markets and timeframes, and the input parameters can be adjusted to suit different trading styles.
Important Notes:
Like any indicator, the Supertrend with Percentage Hysteresis is not foolproof and should be used in conjunction with other forms of technical analysis.
Experiment with the input parameters to find the optimal settings for your trading strategy.
This script does not plot the supertrend lines, only the buy/sell signals, and the background coloring.

TA Monks - EntriesEntry tool for users who depend on setting entry, stop and profit target based on a candle from the M1, M5 or M15 chart. Created following the Photon FX entry models, this tool allows for automatic lot size calculation and it's easy to set up per forex pair/gold.
All the user must do is set their account balance, risk percentage, target reward, asset pair and the rest is automatically set on the charts with the tool.
Tips:
- Activate a level that once hit, set stop loss at a particular level, default is at the break even
- Set entry type as either STOP or LIMIT
a) On Stop, the tool will activate the trade once price goes above the entry line (formed by the candle size + entry buffer set per pair)
b) On Limit, the same activation level as in STOP is required for the tool to activate the trade but it allows the user to enter Limit at a lower level based on the percentage of the entry candle (default is 0.5, which means 50%). In this mode, The user waits for the liquidity candle to be gained and the enter at a lower price of the range within such candle, increasing the R with the risk of missing the trade.
- On the right bottom corner, you will have certain key informations about the trade, such as time opened, time closed, MFE (maximum forward excursion - how many pips price went in favor of the trade), MAE (maximum adversary excursion - how many pips price went past the selected candle's size without buffer), LC (Liquidity candle size), XBf (extra Buffer - only appears when activated in the menu)
- Extra Buffer setting allow user to add extra buffer for the entry and extra buffer for the Stop Loss that has been set per asset pair. Note that the entry buffer only works with the STOP entry mode and if you want to change the entry level on LIMIT, you must use the limit entry percentage setting.
- If you trade an asset pair that is not supported by the tool, simply copy the code and ask an LLM to update it with the necessary pair. You dont need to know how to code, just let the AI do the hard work for you (preferably, you know the basics and you can ask the AI to read the script and update just the right snippets).
Feel free to adjust and adapt the code to your needs. Let me know if you made any cool changes that I might benefit from as well.

Algo by NSG CommandoThis algo create by NSG Black Cat Commando Shiv Bhagwan for everyone use for this for enhance their trading

Support and Resistance (High Volume Boxes) [ChartPrime]Breakout & Retest Approach:
Breakout: A breakout is identified when a resistance level is broken (breakout_res) or a support level is breached (breakout_sup).
Retest Confirmation: If the resistance is retested and confirmed as support (res_holds), a buy signal is generated for a bullish setup; if the support is retested and confirmed as resistance (sup_holds), a sell signal is generated.
Visual Indicators:
Additionally, large green and red triangle-shaped markers are displayed on the chart to indicate buy/sell signals.
Alerts can be set up in TradingView using alert conditions.

Options Scalping IndicatorUsed RSI, Volume Surge Calculation, and EMA to scalp potential Binary Trades.

MAA Script Description:
The provided Pine Script, titled "MAA" (Market Analysis Assistant), is a comprehensive trading tool designed for study purpose and use on the TradingView platform only. It integrates multiple technical indicators, trend analysis tools, and visualization features to help traders analyze market conditions, identify trends, and generate buy/sell signals. The script is highly customizable, allowing users to toggle various features on or off based on their preferences.
Key Features:
1. Dashboard Panel:
Displays key market information, including:
Volatility: Calculated using ATR (Average True Range) and standard deviation.
Volume: Current trading volume.
RSI (Relative Strength Index): Momentum indicator.
Market Sentiment: Bullish, Bearish, or Flat based on EMA (Exponential Moving Average) analysis.
Trend Panel: Shows the trend direction (Uptrend or Downtrend) across multiple timeframes (1M, 5M, 15M, 30M, 1H, 2H, 4H, Daily, Weekly, Monthly).
2. Trend Analysis:
Uses SMA (Simple Moving Average) across various timeframes to determine the overall market trend.
Visualizes trends with emojis (📈 for uptrend, 📉 for downtrend).
3. Support and Resistance Lines:
Plots dynamic support and resistance levels based on historical price highs and lows.
4. Fibonacci Retracement:
Automatically calculates and plots Fibonacci retracement levels based on significant price pivots.
5. Void Lines:
Displays Bollinger Bandlike levels (200% and 300% deviations) to identify potential overbought or oversold conditions.
6. EMA Lines:
Plots EMA (Exponential Moving Average) lines for shortterm (EMA 6) and longterm (EMA 200) trend analysis.
7. Buy/Sell Signals:
Generates buy and sell signals using the WaveTrend oscillator, which combines momentum and trendfollowing elements.
8. Color Gradient Bars:
Applies a dynamic color gradient to price bars based on market conditions, enhancing visual analysis.
9. Customization Options:
Users can enable or disable specific features, such as:
Void Lines
Dashboard
Signal Bars
Support/Resistance Lines
EMA Lines
Buy/Sell Signals
Fibonacci Retracement
Tools and Indicators Used:
1. Technical Indicators:
ATR (Average True Range): Measures market volatility.
RSI (Relative Strength Index): Identifies overbought or oversold conditions.
SMA (Simple Moving Average): Determines the overall trend.
EMA (Exponential Moving Average): Tracks shortterm and longterm trends.
WaveTrend Oscillator: Combines momentum and trendfollowing for buy/sell signals.
Fibonacci Retracement: Identifies potential support and resistance levels.
2. Visualization Tools:
Labels: Displays market information and trend analysis.
Plots: Visualizes support/resistance levels, EMA lines, and void lines.
Color Gradients: Enhances price bars for better visual analysis.
Shapes: Marks buy/sell signals on the chart.
3. User Inputs:
Allows users to customize the script by toggling features on or off and adjusting parameters (e.g., dashboard distance, colors).
Best Way to Study the Market with This Script:
1. Understand the Dashboard:
Start by analyzing the dashboard panel to get an overview of market conditions, including volatility, volume, RSI, and sentiment.
2. Identify Trends:
Use the Trend Panel to determine the direction of the market across multiple timeframes. Look for consistency in trends (e.g., uptrends across all timeframes indicate strong bullish momentum).
3. Analyze Support and Resistance:
Study the dynamic support and resistance levels to identify key price zones where the market might reverse or consolidate.
4. Use Fibonacci Retracement:
Apply Fibonacci levels to identify potential retracement zones during trends. Look for price reactions at key Fibonacci levels (e.g., 0.382, 0.618).
5. Monitor Buy/Sell Signals:
Pay attention to the WaveTrendgenerated buy and sell signals. Confirm these signals with other indicators (e.g., RSI, EMA) to avoid false signals.
6. Visualize Price Action:
Use the color gradient bars and void lines to identify overbought or oversold conditions. Look for price reversals near void lines.
7. Customize the Script:
Tailor the script to your trading style by enabling or disabling specific features. For example, if you prefer trendfollowing strategies, focus on EMA lines and trend analysis.
8. Backtest and Validate:
Test the script on historical data to evaluate its performance. Adjust parameters (e.g., ATR period, EMA lengths) to optimize results.
9. Combine with Other Tools:
Use this script in conjunction with other technical analysis tools and strategies to enhance your market analysis.
Settings Details:
Dashboard:
Toggle on/off, adjust distance, and customize colors.
Void Lines:
Enable/disable and customize colors.
Support/Resistance Lines:
Toggle on/off and adjust levels.
EMA Lines:
Enable/disable and customize lengths (8 and 200).
Buy/Sell Signals:
Toggle on/off and customize alert conditions.
Fibonacci Retracement:
Enable/disable, adjust deviation multiplier, and customize levels.
Conclusion:
The MAA Pine Script is a powerful and versatile tool for traders seeking to analyze market trends, identify key levels, and generate actionable signals. By leveraging its customizable features and comprehensive indicators, traders can gain deeper insights into market dynamics and make more informed trading decisions.

HMA Hidden Signals (1H Optimized)HMA və Repainting
HMA-nın təbiəti: HMA, WMA (Weighted Moving Average) hesablamalarına əsaslanır və nəzəri olaraq "repainting" etmir, çünki o, cari çubuğun bağlanmasını gözləyir və keçmiş məlumatlara əsaslanaraq hesablanır. Yəni, bir çubuk bağlandıqdan sonra HMA dəyəri dəyişmir — bu, onu "non-repainting" edir.
Sənin skriptin: Skriptdə ta.crossover və ta.crossunder funksiyaları istifadə olunur ki, bunlar da cari və əvvəlki HMA dəyərlərini müqayisə edir (hma və prevHma). Bu funksiyalar da keçmişdəki dəyərləri dəyişdirmir, sadəcə mövcud məlumatlara əsaslanaraq siqnal yaradır.
Həcm Filtri
Skriptdə həcm filtiri (volumeConfirmed = volume > volumeMa * 1.2) də var. Bu da real vaxtda hesablanan SMA (Simple Moving Average) istifadə edir və keçmiş çubukların dəyərlərini dəyişdirmir. Həcm də cari çubuğun bağlanmasına əsaslanır, ona görə də burada da "repainting" problemi yoxdur.
Nəticə
Bu skript "non-repainting"dir. Çünki:
HMA dəyərləri çubuk bağlandıqdan sonra dəyişmir.
Siqnallar (crossover və crossunder) yalnız cari və əvvəlki çubukların sabit dəyərlərinə əsaslanır.
Həcm filtiri də keçmişdəki məlumatları yenidən çəkmir.
Əlavə Qeyd
Əgər sən "non-repainting" olmasını təmin etmək üçün əlavə yoxlama istəyirsənsə, skripti test edə bilərsən: Tarixi məlumatlarda siqnalların yerindən oynayıb-oynamadığına bax. Amma kodun strukturuna görə, bu indikator yenidən çəkilməməlidir. Başqa sualın varsa, soruş!
