Candle Close NotificationCandle Close Notification Indicator - Specification
1. 概要 (Overview)
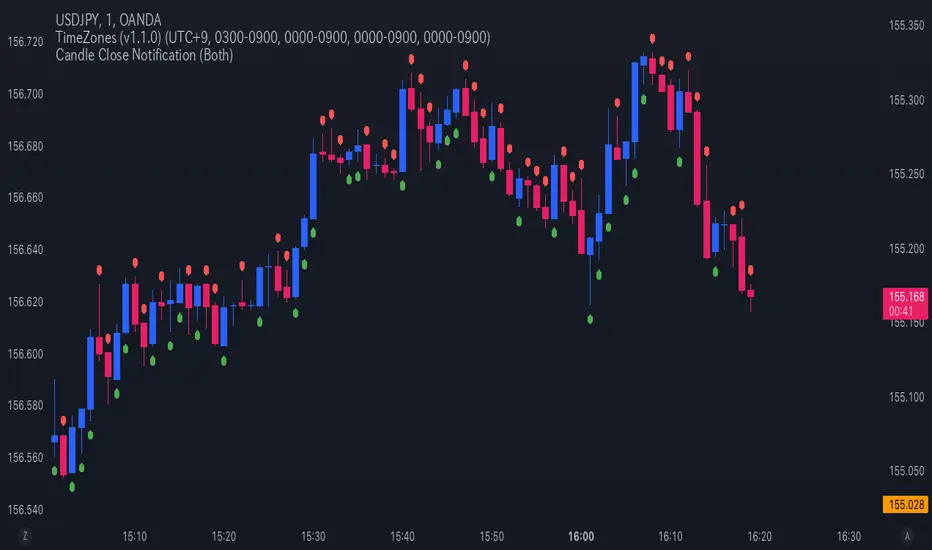
本インジケーターは、TradingView 上でローソク足が確定した際に、そのローソク足が陰線(Bearish)または陽線(Bullish)であった場合に通知を送信するものです。
また、該当するローソク足の上または下にマークを表示し、視覚的にも識別しやすくなっています。
This indicator for TradingView sends notifications when a candlestick closes as either a bearish (red) or bullish (green) candle. It also marks the corresponding candles on the chart for visual reference.
2. 機能 (Features)
2.1 通知機能 (Notification Function)
ローソク足の確定時に、以下の条件に基づき アラート(通知) を送信します。
「Both」(両方): 陰線・陽線のどちらでも通知
「Bearish」(陰線のみ): 陰線の時のみ通知
「Bullish」(陽線のみ): 陽線の時のみ通知
When a candlestick closes, an alert notification is sent based on the selected option:
"Both" (Default): Notifies for both bearish and bullish candles.
"Bearish": Notifies only bearish candles.
"Bullish": Notifies only bullish candles.
2.2 チャートマーク表示機能 (Chart Marking Function)
ローソク足が確定した際、以下のルールでマークを表示します。
陰線(Bearish) の場合、赤色の「下向きマーク」を表示(ローソク足の上)
陽線(Bullish) の場合、緑色の「上向きマーク」を表示(ローソク足の下)
When a candlestick closes, a marker appears according to the following rules:
Bearish candle → A red downward marker appears above the candle.
Bullish candle → A green upward marker appears below the candle.
3. 通知オプションの設定 (Setting Notification Options)
スクリプト内の notify_option の値を変更することで、通知の種類を設定できます。
Both(デフォルト) → 陰線・陽線両方通知
Bearish → 陰線のみ通知
Bullish → 陽線のみ通知
Modify the notify_option value in the script to customize notifications:
Both (Default) → Notifies for both bearish and bullish candles.
Bearish → Notifies only bearish candles.
Bullish → Notifies only bullish candles.
TradingView の アラート機能 を有効にすることで、通知を受け取ることができます。
Enable TradingView’s Alert function to receive notifications.
在腳本中搜尋"candle"
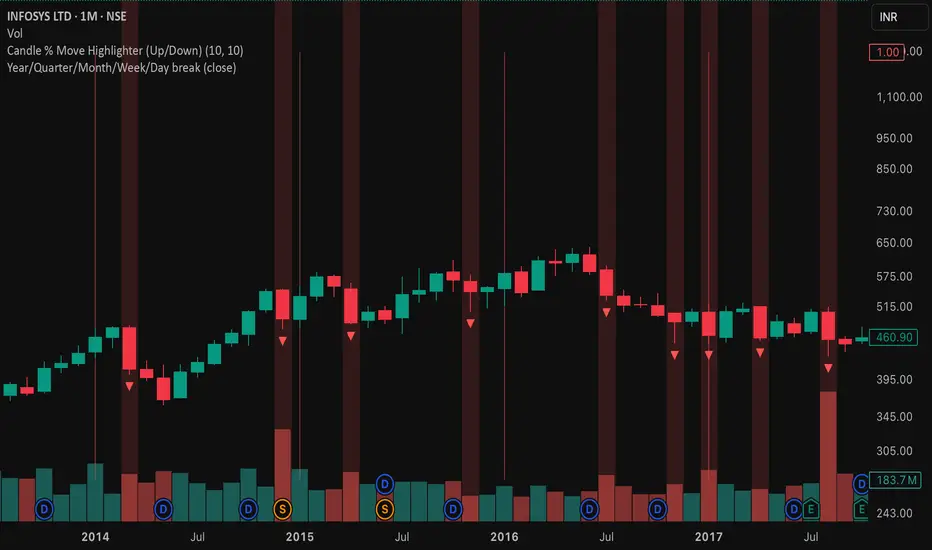
Candle % Move Highlighter (Up/Down)Candle % Move Highlighter (Up/Down with Labels)
This indicator highlights candles that move up or down by a specific percentage from their open price.
🔹 Key Features:
Highlight candles that move up or down by a user-defined %.
Set separate thresholds for up moves and down moves.
Choose to show only up, only down, or both types of candles.
Optional triangle markers above or below highlighted candles.
% Move labels shown directly on the chart above (or below) the candle.
💡 Use this to:
Spot strong momentum candles.
Identify breakout or breakdown moves.
Visually monitor extreme price movement days.
Customize thresholds and display options from the settings panel.
Candle Ratio Alert**Candle Ratio Alert System for Multi-Pair, 5-Minute Charts**
This Pine Script indicator is designed for traders who want to monitor specific candle patterns across multiple assets on a 5-minute timeframe. The tool calculates the ratio of the candle's body size to its total wick size, allowing you to identify significant candles based on their structure. It is ideal for strategies that rely on candlestick analysis, such as breakout or reversal trading.
### Key Features:
1. **Customizable Threshold**: Set the body-to-wick ratio using an input slider, ensuring flexibility to match your strategy.
2. **Visual Alerts**: The script plots a purple marker above candles that meet the specified criteria, making it easy to spot qualifying patterns at a glance.
3. **Dynamic Alerts**: Integrated alert functionality notifies you via email or app when a candle satisfies the ratio condition. Alerts include the asset's ticker and timeframe for quick action.
4. **Multi-Pair Capability**: Compatible with assets like XAUUSD, BTCUSD, EURUSD, and GBPUSD, making it versatile for Forex and cryptocurrency trading.
### How It Works:
The script calculates the body size and total wick size of each candle. If the ratio exceeds the user-defined threshold, the script triggers a visual marker and sends an alert. The 5-minute timeframe ensures rapid identification of trading opportunities in volatile markets.
With its intuitive interface and powerful alert system, this tool streamlines your trading workflow, helping you stay focused on key market movements. Perfect for both beginners and experienced traders seeking precision and efficiency in their analysis.

Candle Body Break (M/W/D/4H/1H)v5# Candle Body Break (M/W/D/4H/1H) Multi-Timeframe Indicator
This indicator identifies and plots **Candle Body Breaks** across five key timeframes: Monthly (M), Weekly (W), Daily (D), 4-Hour (4H), and 1-Hour (1H).
## Core Logic: Candle Body Break
The core concept is a break in the swing high/low defined by the body of the previous counter-trend candle(s). It focuses purely on **closing price breaks** of remembered highs/lows established by full candle bodies (close > open or close < open).
1. **Remembering the Swing:**
* After a bullish break (upward trend), the indicator waits for the first **bearish (close < open) candle** to appear. This bearish candle's high (`rememberedHigh`) and low (`rememberedLow`) are saved as the **breakout level**.
* Subsequent bearish candles that make a new low update this saved level, continuously adjusting the level to the most significant recent resistance/support established by the body's range.
2. **Executing the Break:**
* **Bull Break (Long signal):** Occurs when a **bullish candle's closing price** exceeds the last remembered bearish high (`rememberedHigh`).
* **Bear Break (Short signal):** Occurs when a **bearish candle's closing price** falls below the last remembered bullish low (`rememberedLow_Bull`).
Once a break occurs, the memory is cleared, and the indicator waits for the next counter-trend candle to establish a new level.
## Features
* **Multi-Timeframe Analysis:** Displays break lines and labels for M, W, D, 4H, and 1H timeframes on any chart.
* **Timeframe Filtering:** Break lines are only shown for timeframes **equal to or higher** than the current chart timeframe (e.g., on a 4H chart, only 4H, D, W, and M breaks are displayed).
* **Candidate Lines (Dotted Green):** Plots the current potential breakout level (the remembered high/low) that must be broken to trigger the next signal.
* **Direction Table:** A table in the top right corner summarizes the latest break direction (⇧ Up / ⇩ Down) for all five timeframes. This can be optionally limited to the 4H chart only.
* **1H Alert:** Triggers an alert when a 1-Hour break is detected.
## Input Settings Translation (for Mod Compliance)
| English Input Text | Original Japanese Text |
| :--- | :--- |
| **Show Monthly Break Lines** | 月足ブレイクを描画する |
| **Show Weekly Break Lines** | 週足ブレイクを描画する |
| **Show Daily Break Lines** | 日足ブレイクを描画する |
| **Show 4-Hour Break Lines** | 4時間足ブレイクを描画する |
| **Show 1-Hour Break Lines** | 1時間足ブレイクを描画する |
| **Show Monthly Candidate Lines** | 月足ブレイク候補ラインを描画する |
| **Show Weekly Candidate Lines** | 週足ブレイク候補ラインを描画する |
| **Show Daily Candidate Lines** | 日足ブレイク候補ラインを描画する |
| **Show 4-Hour Candidate Lines** | 4時間足ブレイク候補ラインを描画する |
| **Show 1-Hour Candidate Lines** | 1時間足ブレイク候補ラインを描画する |
| **Show Only Current TF Candidate Lines** | チャート時間足の候補ラインのみ表示 |
| **Show Table Only on 4H Chart** | テーブルを4Hチャートのみ表示 |
*Please note: The default alert message "1-Hour Break Detected" is also in English.*
※日本語訳
ろうそく足実体ブレイク(M/W/D/4H/1H)マルチタイムフレーム・インジケーター(日本語訳)
このインジケーターは、月足(M)、週足(W)、日足(D)、4時間足(4H)、1時間足(1H)の5つの主要な時間足におけるろうそく足実体ブレイクを検出し、プロットします。
コアロジック:ろうそく足実体ブレイク
このロジックの中核は、直近の**逆行ろうそく足(カウンター・トレンド・キャンドル)**の実体によって定義されたスイングの高値/安値のブレイクです。終値が実体のレンジ外で確定することを純粋に追跡します。
スイングの記憶(Remembering the Swing):
強気のブレイク(上昇トレンド)の後、インジケーターは最初に現れる弱気(終値<始値)のろうそく足を待ちます。この弱気ろうそく足の高値(rememberedHigh)と安値(rememberedLow)が、ブレイクアウトレベルとして保存されます。
その後、安値を更新する弱気ろうそく足が続いた場合、この保存されたレベルが更新され、実体のレンジによって確立された最新の重要なレジスタンス/サポートにレベルが継続的に調整されます。
ブレイクの実行(Executing the Break):
ブルブレイク(買いシグナル): 最後に記憶された弱気ろうそく足の高値(rememberedHigh)を、強気ろうそく足の終値が上回ったときに発生します。
ベアブレイク(売りシグナル): 最後に記憶された強気ろうそく足の安値(rememberedLow_Bull)を、弱気ろうそく足の終値が下回ったときに発生します。
一度ブレイクが発生すると、記憶されたレベルはクリアされ、インジケーターは次の逆行ろうそく足が出現し、新しいレベルを確立するのを待ちます。
機能
マルチタイムフレーム分析: 現在のチャートの時間足に関わらず、M、W、D、4H、1Hのブレイクラインとラベルを表示します。
時間足フィルタリング: ブレイクラインは、現在のチャート時間足と同じか、それよりも上位の時間足のもののみが表示されます(例:4時間足チャートでは、4H、D、W、Mのブレイクのみが表示されます)。
候補ライン(緑の点線): 次のシグナルをトリガーするためにブレイクされる必要がある、現在の潜在的なブレイクアウトレベル(記憶された高値/安値)をプロットします。
方向テーブル: 右上隅のテーブルに、5つの全時間足の最新のブレイク方向(⇧ 上昇 / ⇩ 下降)をまとめて表示します。これは、オプションで4時間足チャートのみに表示するように制限できます。
1時間足アラート: 1時間足のブレイクが検出されたときにアラートをトリガーします。
入力設定の翻訳
コード内の入力設定(UIテキスト)の日本語訳は以下の通りです。
英語の入力テキスト 日本語訳
Show Monthly Break Lines 月足ブレイクを描画する
Show Weekly Break Lines 週足ブレイクを描画する
Show Daily Break Lines 日足ブレイクを描画する
Show 4-Hour Break Lines 4時間足ブレイクを描画する
Show 1-Hour Break Lines 1時間足ブレイクを描画する
Show Monthly Candidate Lines 月足ブレイク候補ラインを描画する
Show Weekly Candidate Lines 週足ブレイク候補ラインを描画する
Show Daily Candidate Lines 日足ブレイク候補ラインを描画する
Show 4-Hour Candidate Lines 4時間足ブレイク候補ラインを描画する
Show 1-Hour Candidate Lines 1時間足ブレイク候補ラインを描画する
Show Only Current TF Candidate Lines チャート時間足の候補ラインのみ表示
Show Table Only on 4H Chart テーブルを4Hチャートのみ表示
Alert Message: 1-Hour Break Detected アラートメッセージ: 1時間足ブレイク発生

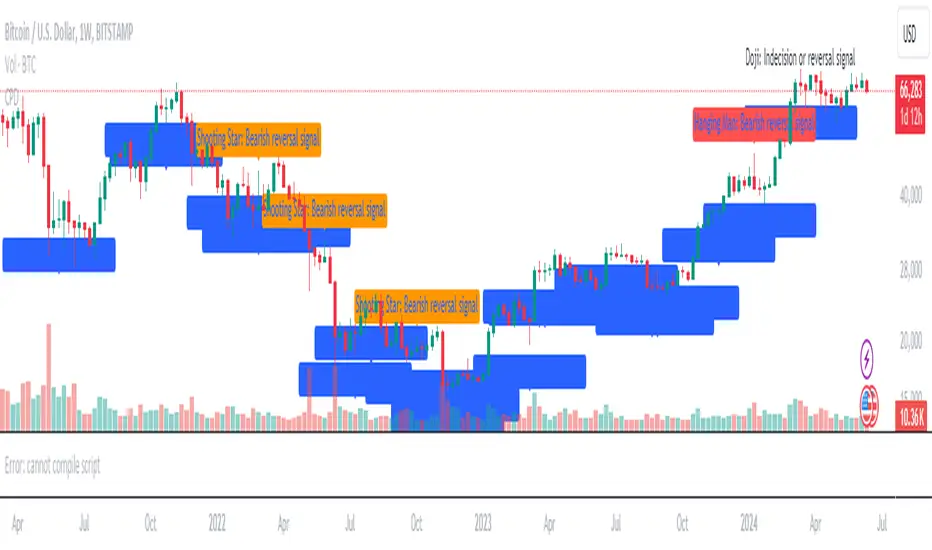
Candlestick Pattern DetectorCandlestick Pattern Detector
Overview
Welcome to the Candlestick Pattern Detector, a powerful tool designed to help traders identify key candlestick patterns on any chart. This indicator detects some of the most significant candlestick patterns and provides brief descriptions directly on the chart, making it easier for you to interpret market signals and make informed trading decisions.
Detected Patterns
Doji
Description: A Doji indicates market indecision. It occurs when the open and close prices are very close, suggesting a balance between bullish and bearish forces.
Signal: Possible trend reversal or continuation depending on the context.
Hammer
Description: A Hammer appears at the bottom of a downtrend, characterized by a small body and a long lower wick. It suggests that buyers are stepping in to push prices higher.
Signal: Bullish reversal.
Hanging Man
Description: The Hanging Man occurs at the top of an uptrend with a small body and a long lower wick. It indicates that selling pressure is starting to take over.
Signal: Bearish reversal.
Shooting Star
Description: The Shooting Star appears at the top of an uptrend with a small body and a long upper wick, indicating that buyers are losing control and sellers may push prices down.
Signal: Bearish reversal.
How to Use
Add to Chart: Click on the "Indicators" button in TradingView, search for "Candlestick Pattern Detector," and add it to your chart.
Visual Signals: The indicator will automatically mark detected patterns with labels on your chart.
Interpret Patterns: Use the brief descriptions provided with each detected pattern to understand market sentiment and potential price movements.
Conclusion
The Candlestick Pattern Detector is a helpful tool for traders of all levels, providing clear and concise information about key candlestick patterns. By integrating this indicator into your trading strategy, you can enhance your ability to read price action and make better trading decisions.
Candlestick Pattern Identifier (Extended + Alerts)Candlestick Pattern Identifier (Extended + Alerts)


Candles Colored Green/Red According To Buy & Sell PressureCANDLES COLORED GREEN OR RED ACCORDING TO BUY & SELL PRESSURE
This indicator paints each candle green, red or blue depending on whether the buy/sell pressure for that candle is bullish, bearish or neutral.
***TURN OFF NORMAL CANDLE COLORS***
For this script to show properly on the chart, make sure you go to chart settings(gear icon in top right corner) and in the symbol tab, uncheck body, borders and wick.
***HOW TO USE***
When the directional movement index indicator shows more buying pressure than selling pressure, the candle will appear lime green. This indicates bullish buying pressure.
When the directional movement index indicator shows more selling pressure than buying pressure, the candle will appear red. This indicates bearish selling pressure.
When the directional movement index indicator shows the same amount of buy and sell pressure, the candle will appear blue. This indicates neutral buy/sell pressure.
Use the color changes to see if there is more buying or selling to pinpoint reversals and understand current market buying. Wait to enter or exit positions until the candles turn the opposite color.
***MARKETS***
This indicator can be used as a signal on all markets, including stocks, crypto, futures and forex.
***TIMEFRAMES***
This DMI color coded candlestick indicator can be used on all timeframes.
***TIPS***
Try using numerous indicators of ours on your chart so you can instantly see the bullish or bearish trend of multiple indicators in real time without having to analyze the data. Some of our favorites are our Auto Fibonacci, Directional Movement Index, Color Coded Buy & Sell Pressure Volume Profile, Auto Support And Resistance and Money Flow Index in combination with this Buy & Sell pressure Candle indicator.

CANDLE STICK HEATMAPCANDLE STICK HEATMAP shows the statistics of a candle at a particular time. its very useful to find repeating pattern's at a particular time in a day.
based on the settings you can see regular repeating patterns of a day in an hourly chart. During a particular time in day there is always a down or up signal or candles.
The table boxes are candles in RED and GREEN based on open and close of the chart. The Heat map is very useful in analyzing the daily Hourly candlesticks in a week. The Time of each candlestick is plotted on the table along with default Indicators like RSI, MACD, EMA, VOLUME, ADX.
Additionally this can be used as a screener of candles on all timeframes. Analysis is easy when you want to see what happened exactly at a particular time in the previous hour, day, month etc.,
Hopefully additional updates will be introduced shortly.
Indicators:
1. MACD (close,12,26,9)
2.RSI (close,14)
3.EMA 200
3.Volume MA
Option is provided to show indicator statistics and time.
Color can be changed using settings.
Supports all Time Zones

Candlesticks Not Touching EMA 3 & EMA 5 ScannerCandlesticks Not Touching EMA 3 & EMA 5 Scanner
Short Title: EMA Scanner
Overview
This indicator scans for candlesticks that do not touch the EMA 3 and EMA 5, highlighting potential trading opportunities where price action is significantly distanced from these moving averages. It identifies momentum-based entries and helps traders spot strong trends.
How It Works
It checks if the candle's high and low are completely above or below both EMAs (3 & 5).
It ensures that the distance between the candle and EMA 5 is at least a user-defined multiple of the candle range.
When a valid candle is detected, a triangle marker appears below (for long trades) or above (for short trades).
Trade Execution Strategy
Entry:
Long Entry → Break of the candle’s high
Short Entry → Break of the candle’s low
Stop Loss:
Long SL → Low of the same candle
Short SL → High of the same candle
Target: EMA 5
Additional Features
✅ Plots EMA 3 (Blue) and EMA 5 (Red) for reference
✅ Marks potential long and short trades with arrows
✅ Detects & plots when Target or Stop Loss is hit
✅ Alerts for valid signals, target hits, and stop loss hits
Best Use Cases
🔹 Suitable for intraday & swing traders looking for momentum-based trades
🔹 Works well in trending markets
🔹 Helps identify mean-reversion & breakout opportunities
🚀 Use this indicator to refine your trading setups & boost your market edge! 🚀

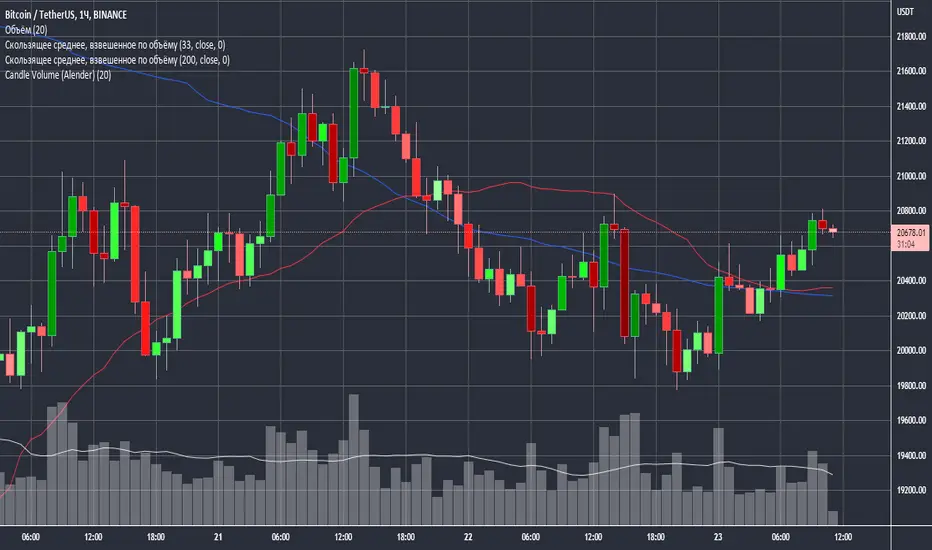
Candle Volume (Alender)Candle Volume by Alender is an indicator that changes the color of candles depending on the volume.
If you use VSA (Volume Spread Analysis) - this indicator will allow you to quickly assess the market situation.
For plotting, a moving average by volume for the specified period is used. Volume/Average * 100 - percentage of the current volume from the average.
* If the current volume is less than the average - the candle will be proportionally (0-100%) lighter than red (for bearish candles) or green (for bullish candles). For 0% - the candle is as light as possible.
* If the current volume is greater than the average, the candle will be proportionately (100-400%) darker than red (for bearish candles) or green (for bullish candles). For 400% and more - the candle is as dark as possible.
Candle Patterns AlertCandlestick pattern alerts for strategies "Candle Patterns Strategy" and "Candle Patterns Strategy - 2".
In order not to receive unnecessary signals, in the "Manage alerts" option should be selected "Once per bar close".
Candle Color FlipCandle Color Flip highlights potential short-term reversals caused by back-to-back candles closing in opposite colors.
The script:
Watches for a green candle that closes after a red candle without making a lower low, and for a red candle that closes after a green candle without making a higher high.
Plots compact markers on qualifying bars (green triangles below for red→green flips, red triangles above for green→red flips).
Offers alert conditions for both directions, so you can set notifications that fire only when a confirmed bar meets the flip rules.
Can also be used to determine exit points on trades by confirming reversals.
Use it to quickly spot where buyers or sellers may be stepping in while the prior candle’s extremes still hold. You can enable “Any alert() function call” for real-time notifications, or stick with bar-close alerts for confirmation.

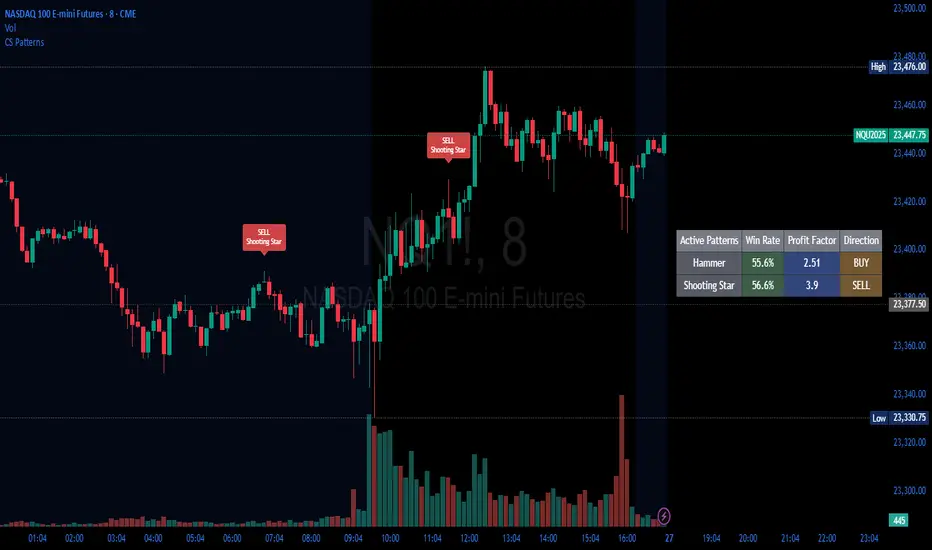
Candlestick Patterns Backtester [Optimized]Candlestick Patterns Backtester
What this is: This indicator is based on a really cool candlestick pattern backtester that I found (I'll update this later when I remember where I got it from or find the actual author). The original had this massive table showing win/loss ratios for a bunch of candlestick patterns, and according to the built-in backtester, it was actually profitable - which was pretty impressive.
The Problem: I played around with the original for a while but honestly wasn't really able to get it to work well at all for actual trading. It was still pretty cool to look at though! The main issues were:
It was just a big static table - hard to do anything useful with it
Couldn't send signals out to other strategies
The code was a monster - like 2,000+ lines of repetitive mess
What I Did: I completely refactored this thing and got it down from 2,000+ lines to just a few hundred lines. Much cleaner now! Here's what it does:
45+ Candlestick Patterns - All the classics are in there
Dynamic Filtering - Set your own requirements (minimum win rate, profit factor, total trades, etc.)
Flexible Logic - Choose AND/OR logic for your filters
Signal Generation - Creates actual buy/sell signals you can use with other strategies
Visual Badges - Shows pattern badges on chart when they meet your criteria
Active Patterns Table - Only shows patterns that are currently profitable based on your settings
Settings You Can Adjust:
Minimum win rate threshold
Minimum profit factor
Minimum number of trades required
Whether to use AND or OR logic for filtering
Colors, badge display, debug options
Reality Check: Trading these patterns really wasn't for me, but it was still a great learning experience. The backtesting results look good on paper, but as always, past performance doesn't guarantee future results. Use this as a research tool and educational resource more than anything else.
Credit: This is based on someone else's original work that I heavily modified and optimized. I'll update this description once I track down the original author to give proper credit where it's due.
This introduction captures your casual, honest tone while explaining the technical improvements you made and setting realistic expectations about the indicator's practical use.
Candles for VSACandles in which the open is equal to the previous close. (For VSA theory)
Свечи в которых открытие равно предыдущему закрытию. (Сделано для анализа по ВСА).

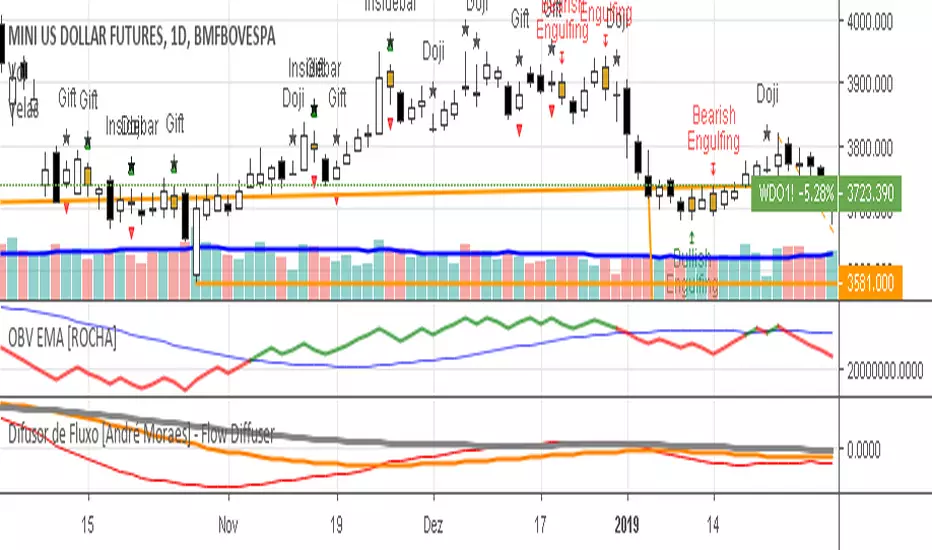
Candlestick Pattern Detector (v8)Indicator Description – Candlestick Pattern Detector (v8)
This indicator automatically detects and highlights some of the most popular candlestick reversal and continuation patterns directly on the chart. It’s designed for traders who want clear visual signals for price action setups without having to scan every candle manually.
Patterns Included:
Bullish Engulfing – Strong bullish reversal when a green candle fully covers the previous red candle.
Bearish Engulfing – Strong bearish reversal when a red candle fully covers the previous green candle.
Morning Star – A 3-candle bullish reversal pattern, signalling exhaustion of selling pressure.
Evening Star – A 3-candle bearish reversal pattern, signalling exhaustion of buying pressure.
Three White Soldiers – Three consecutive strong bullish candles with small wicks, often showing trend continuation.
Three Black Crows – Three consecutive strong bearish candles with small wicks, often marking trend continuation.
Hammer – A bullish rejection candle with a small body and a long lower wick, usually after a downtrend.
Inverted Hammer – A potential bullish reversal candle with a small body and a long upper wick.
Features:
Labels on chart: Each detected pattern is marked with a label (e.g., Bull Engulf, Morning Star, 3WS, Hammer).
Colored candles: Optionally colors bars when patterns appear (green for bullish, red for bearish).
Engulfing mode toggle: Choose between strict wick-to-wick engulfing or body-only engulfing.
Customizable display: Toggle individual patterns on/off to focus on the setups you use.
Why use this indicator?
Candlestick formations provide insight into market psychology and momentum shifts. By automating the detection of these patterns, this tool helps traders:
Spot potential reversals early.
Confirm trade setups with clear visual cues.
Save time manually checking each candle.
⚠️ Disclaimer: This indicator is for educational and analysis purposes only. It does not provide financial advice or guarantee profitability. Always combine candlestick signals with broader technical/fundamental analysis and risk management.

Candlestick PatternsWhat It Does:
Automatically identifies and displays:
🟢 16+ Bullish patterns (Hammer, Engulfing ↑, Morning Star, etc.)
🔴 Bearish patterns (Shooting Star, Engulfing ↓, Evening Star, etc.)
🔵 Break & Retest signals (70-80% win rate setups)
⚪ Neutral patterns (Doji, Spinning Top - indecision)
🎯 Automatic alerts for all major patterns
Purpose: Shows you exactly when reversals are likely and identifies the highest-probability entry points (Break & Retest).Key Patterns:Bullish (Green labels above/below):
HAMMER - Long lower wick, small body (reversal from bottom)
ENGULF ↑ - Big green candle swallows previous red (strong reversal)
MORNING★ - Three candles: red, doji, green (major bottom)
3 BULLS - Three consecutive green candles (strong momentum)
PIERCE - Green closes above 50% of previous red
RETEST ↑ (BEST!) - Price broke resistance, pulled back, bounced (cyan circle)
Bearish (Red labels above/below):
SHOOT★ - Long upper wick, small body (reversal from top)
ENGULF ↓ - Big red candle swallows previous green (strong reversal)
EVENING★ - Three candles: green, doji, red (major top)
3 BEARS - Three consecutive red candles (strong momentum)
DARK☁ - Red closes below 50% of previous green
RETEST ↓ (BEST!) - Price broke support, bounced back, rejected (orange circle)
Neutral:
DOJI - Indecision, potential reversal coming
SPINNING TOP - Small body, long wicks (indecision)
Best Practices:✅ Wait for confirmation - Don't trade pattern alone, check context
✅ Combine patterns - Retest + Candlestick = 80%+ win rate
✅ Check trend - Bullish patterns in uptrend work best
✅ Volume matters - Larger patterns with volume = stronger
✅ Fresh retests - First retest after break = highest probability
✅ Use alerts - Set alerts for Engulfing, Retest, Morning/Evening Star
✅ Size matters - Bigger candles = stronger signals❌ Don't trade every pattern - Quality over quantity
❌ Don't ignore context - Hammer at resistance = weak signal
❌ Don't trade against trend - Bearish in strong uptrend = risky
❌ Don't skip stop loss - Always protect your trades
❌ Don't trade small patterns - Need clear, visible patterns

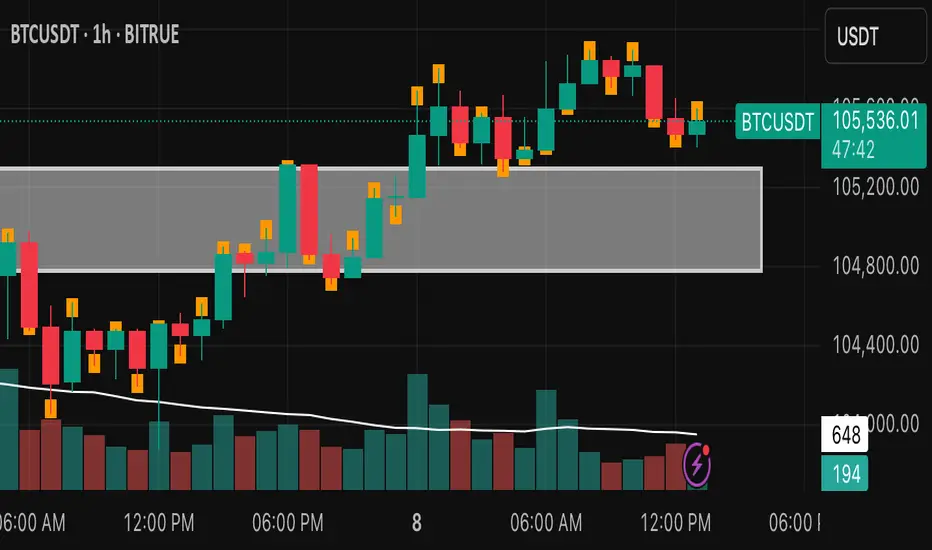
Candle Close Location MarkerThis script customizes the appearance of candlesticks by highlighting whether the candle closed in the upper, middle, or lower part of its range — using a small orange marker inside each candle.
It also includes a traditional volume histogram with two simple moving averages (SMA 20 and SMA 50), helping traders detect volume trends and potential reversals.
📌 Useful for identifying strength of momentum and visualizing market sentiment clearly.
Features:
• ✅ Colored candles: green for bullish, black for bearish
• ✅ Orange square shows the position of the close (top, middle, or bottom of the candle)
• ✅ Volume bars with SMA 20 (orange) and SMA 50 (blue)
• ✅ Works on all timeframes
Developed by:
Version: 1.0
Language: Pine Script v5
Candle Analysis BiasDescription:
The "Candle Analysis Bias" indicator is designed to provide visual cues on the direction of price movements by labeling candles as either "Bullish" or "Bearish" based on specific criteria. This indicator helps traders quickly identify shifts in momentum and potential trend reversals.
Features:
Directional Labels: Candles are labeled "Bullish" if the closing price exceeds the previous candle's high, indicating potential upward momentum. Conversely, candles are labeled "Bearish" if the closing price falls below the previous candle's low, suggesting potential downward pressure.
Customizable Appearance: Users can customize the color of the labels through the indicator settings. The default colors are green for bullish labels and red for bearish labels, with a 50% opacity to ensure they are visually distinct yet not overly intrusive.
Label Offset: An offset can be applied to the labels to position them slightly away from the candles, enhancing readability. The default offset is set to 10 times the minimum price tick of the symbol.
Exclusion of Current Candle: The indicator does not label the current, open candle until it is confirmed. This ensures that labels are only applied to completed candles, avoiding premature signals.
Usage:
Trend Identification: Use the "Bullish" and "Bearish" labels to identify potential trend changes or continuations.
Confirmation Tool: Combine the labels with other indicators or analysis techniques to confirm trading signals.
Visual Analysis: Quickly scan the chart for clusters of "Bullish" or "Bearish" labels to gauge overall market sentiment.
Settings:
Bullish Color: Customize the color of the "Bullish" labels.
Bearish Color: Customize the color of the "Bearish" labels.
Label Offset: Adjust the distance between the labels and the candles.
Installation:
To install this indicator, copy the Pine Script code provided and paste it into the Pine Editor in TradingView. Click "Add to Chart" to apply the indicator to your selected chart.
This detailed description should help users understand the purpose and functionality of the "Candle Analysis Bias" indicator, making it easier for them to incorporate it into their trading strategies.

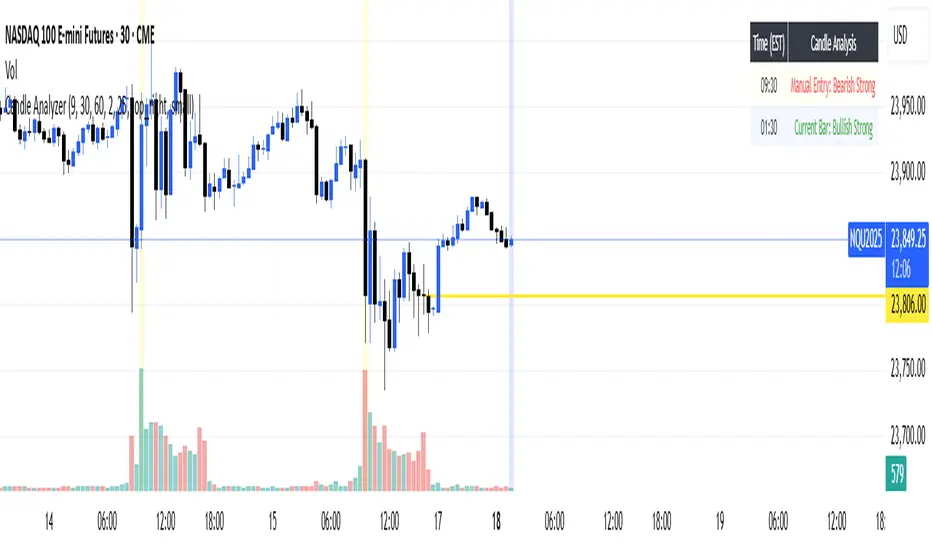
Candle AnalyzerThis tool classifies candles based on their body size and wick proportions, helping you quickly identify:
"Strong" Candles: When the body dominates, showing clear bullish or bearish momentum.
"Rejection" Candles: Long wicks indicate price was pushed back, suggesting potential reversals.
"Indecisive" Candles: When neither buyers nor sellers are clearly in control, or if wicks are balanced.
"Doji/Indecision": Very small or non-existent bodies, highlighting significant uncertainty.
Features
Manual Entry Time (Defaults to NY Open): The indicator analyzes the candle at this specific time.
Current Bar Analysis: This feature classifies the current, developing candle in real-time.
Analysis Table: A table displays details for the last four completed bars, including body size and wick percentages.
Customizable Thresholds: Adjust the "Min Body vs Wick %" and "Dominant Wick vs Body Ratio" to fine-tune how "strong" or "rejection" candles are identified.
Candlestick High/Low Labels📌 Indicator Name:
Candlestick High/Low Labels
🧠 Author:
Precious Life Dynamics (@Precious_Life)
📋 Description:
The Candlestick High/Low Labels indicator highlights recent price extremes by placing labels above highs and below lows of previous candles.
Additionally, it displays a live OHLCV dashboard in the bottom-right corner, offering a quick overview of recent market data.
This tool is especially useful for:
Identifying support/resistance levels
Tracking candle behavior
Visualizing volume trends in context
⚙️ How It Works:
🔸 High/Low Labels:
Each of the most recent candles (based on Candle Lookback) is annotated as follows:
🔹 Red label above each candle’s high
🔹 Green label below each candle’s low
🔹 Price values are rounded (no decimals)
🔹 Labels are dynamically updated; old ones are removed
🔹 Label visibility can be toggled via the Show Labels input
🔸 OHLCV Dashboard:
A real-time data table appears in the bottom-right corner of the chart.
It displays the last N candles (based on Dashboard Lookback) with the following fields:
🔹 Candle Number (1 = most recent)
🔹 Open, High, Low, Close
🔹 Volume
🔹 Values are rounded for readability
🔹 White background with black text ensures high visual clarity
🔧 Customizable Inputs:
✅ Candle Lookback → Number of candles to label (default: 10)
✅ Show Labels → Toggle High/Low label display on/off
✅ Dashboard Lookback → Number of candles shown in the OHLCV table (default: 10)
🎯 Use Cases:
🔹 Identify recent price extremes and reaction zones
🔹 Spot dynamic support and resistance levels
🔹 Observe how candles behave at swing highs/lows
🔹 Monitor volume activity in relation to price
🔹 Use as a clean visual tool for scalping and intraday trading
📝 Notes:
🔹 This indicator is purely visual – it does not generate trade signals
🔹 Best suited for traders who value clear, real-time price structure feedback

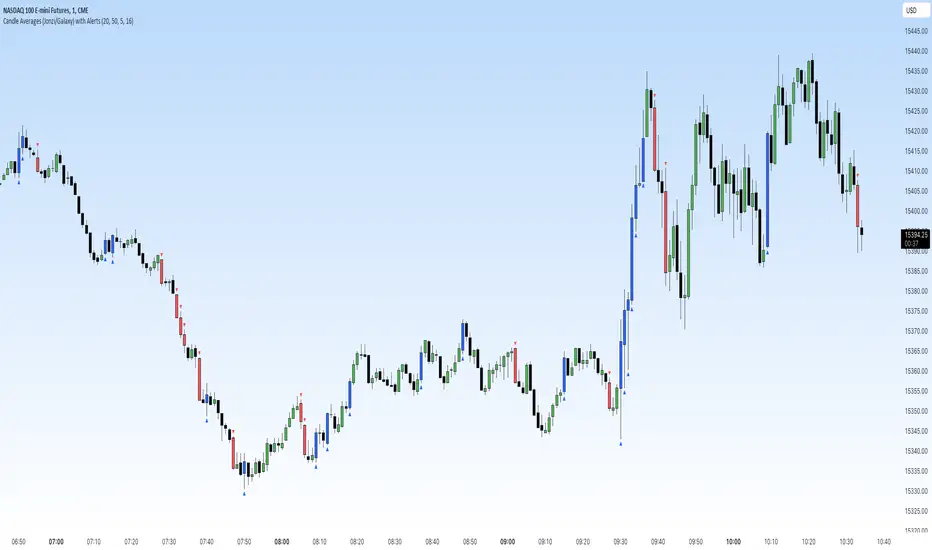
Candle Averages (Jonzi/Galaxy) with AlertsThis indicator is used to highlight outlying candles.
Our script takes the average of the trailing candles and then highlights and/or places a symbol at the candles outside the average.
Example: Your settings use the previous 20 candles and combine the range of each candle.
Divide by 20 and get the average. Let's assume the average is $10
Now if you have your settings at highlighting candles 50% larger than the average, once a candle gets to $15, the indicator would trigger the candle to be highlighted and/or place a symbol of your choice.
In case you don't want to pay attention to the consolidation, you can use the alerts feature. Just go on the timeframe you'd like to be notified on, set an alert for either a down close or up close trigger.