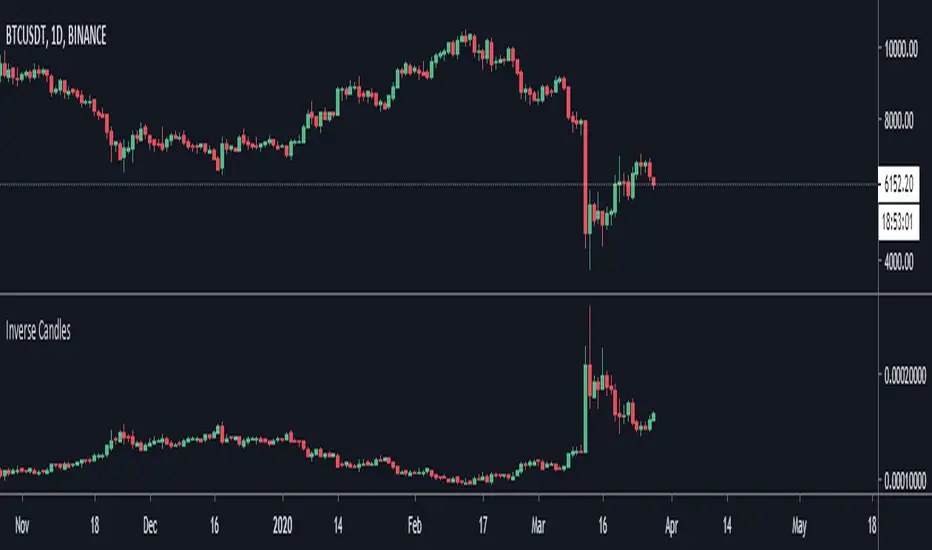
Open Interest with Heikin Ashi candlesA simple modification of the Tradingview free script of futures Open Interest to Heikin Ashi candles. It displays the volume of the Open Interest futures contracts by applying the HA formula.
I use it to clear out the "noise" of up's and down's especially in intraday small time frames when I am scalping in crypto.
Background color can be turned on/off.
Just to give back a little something to a community that gave me A LOT!
Let me know what you think and if you need anything to add.
Have fun :)
P.S. The way I use it is to try to find traps in the market and take (fast) advantage of them. When the OI are going up really fast in small time frames (which means either longs or shorts are going up) this creates a good opportunity for a squeeze (the trap).
Of course I use other indicators/oscillators to determine that but it gets me on my toes to look for... something ;)
在腳本中搜尋"candle"

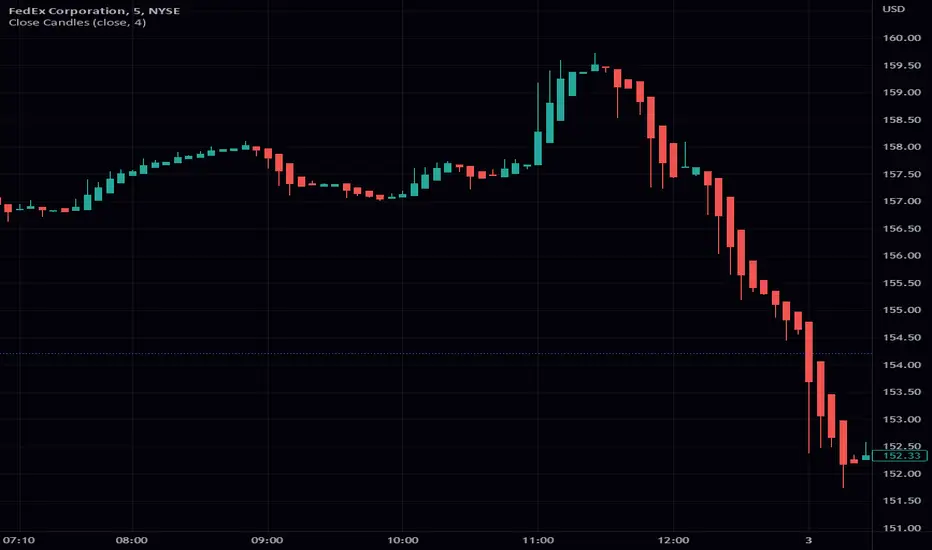
Close CandlesClosing candle takes any input and turs it into a candle stick chart. You can go from a regular candle chart by setting the length to 1, to heikin ashi by setting the length to 4. One of the features of this scripts is the ability to reuse the function. This function is a great addition to most scripts as it makes it really easy to give your script a candle view. As always I hope that you find this release useful. If you find any bugs please let me know. The same goes with any features you might want to request. This includes requesting custom indicators. Enjoy!
Turk Pivot Candle Order BlocksOrder Blocks based on pivot reversal candle
When a pivot High or Pivot Low is found and confirmed, a box will be plotted on the open and close values of that pivot candle
You also have the ability to change the amount of candles the box stretches over as well as the colors of the bullish and bearish boxes
How To Use:-
Pivot points often provide Support and Resistance points on their own,
one way of marking up order blocks is by taking the pivot candle and marking that up as a resistance area where you could be looking for price to reverse
Engulfing Candle Marker (Full Candle)A simple indicator that marks FULL CANDLE engulfing candles...
current high > previous high
current low < previous low
bullish: close > open (triangle below)
bearish: close < open (triangle above)
A lot of the engulfing indicators available are body only. I created a FULL CANDLE indicator because that's what I prefer using.
Can be useful for spotting both reversal and continuation price action. Always have a complete trading plan and backtest it for yourself, engulfing candles in themselves to not guarantee a profit.
You are more powerful than you know...keep expanding!

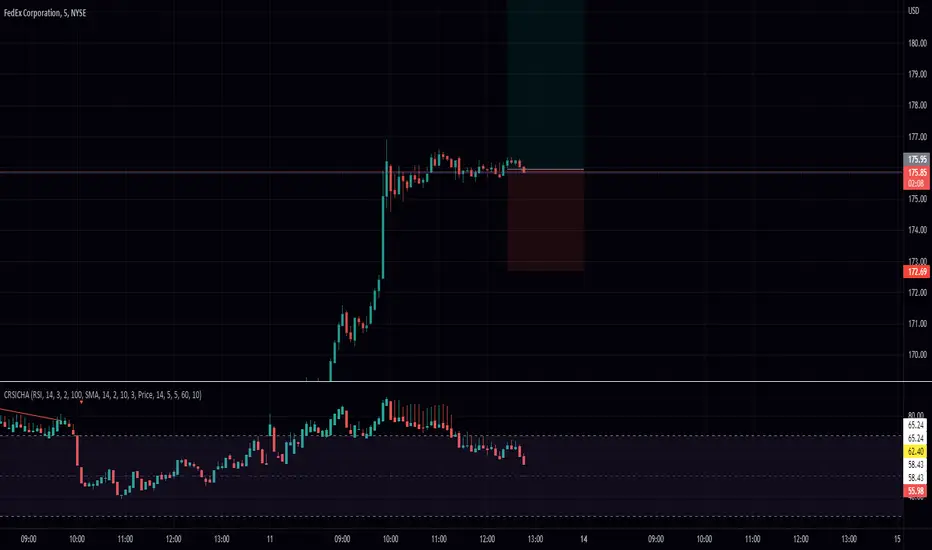
RSI Candle with Connors RSI and Heikin Ashi (CRSICHA)This script was designed to work and feel like the built in RSI script but with a lot of added feature that traders might enjoy. You get to see the RSI represented as candle sticks OR Heikin Ashi. I have added in Connors RSI as a bonus so you can see what this lesser used study looks like in candle form. Just like in the original script I have moving averages and Bollinger Bands. I must say, Heikin Ashi really excells in this situation because you don't need to know an exact price! As always I hope every one finds this useful! Enjoy!
[BM] HTF Candle Evolution█ OVERVIEW
This script shows how a higher timeframe candle evolves over time.
It was created as a visual aid to #TheStrat and provides a new way of looking at Timeframe Continuity.
█ FEATURES
General
HTF: Higher Timeframe selection with dropdown and ability to manually input a timeframe that is not present in the dropdown.
Label: Show a label with the selected higher timeframe.
Marker: Shows a marker symbol at the start of each new higher timeframe.
Align: Aligns the candles around a selected center line.
The Strat
Multi-timeframe analysis is used extensively in #TheStrat (created by Rob Smith), so the ability to add #TheStrat coloring has been made available.
Scenario: Define the colors for the strat scenario's.
Coloring of: Choose which part of the candles you want the selected strat scenario colors to be applied to.
Band: Display a band that shows the active strat scenario color of the selected higher timeframe.
All features are completely customizable.

Candle CurtainWHAT
This indicator hides the colour of the currently printing candle to avoid poor decisions being made.
WHY
Many trading strategies rely upon assessing the state of closed candles. Making trading decisions based on the currently printing candle's state can lead to poor trading outcomes (emotional decisions, FOMO, lack of restraint, etc) as it can be bullish one moment and bearish the next. This indicator acts to remind the trader to disregard the currently printing candle and wait for it to close.
IMPORTANT: Please click the three dots beside the indicator's name and select 'Visual Order' -> 'Bring to Front'

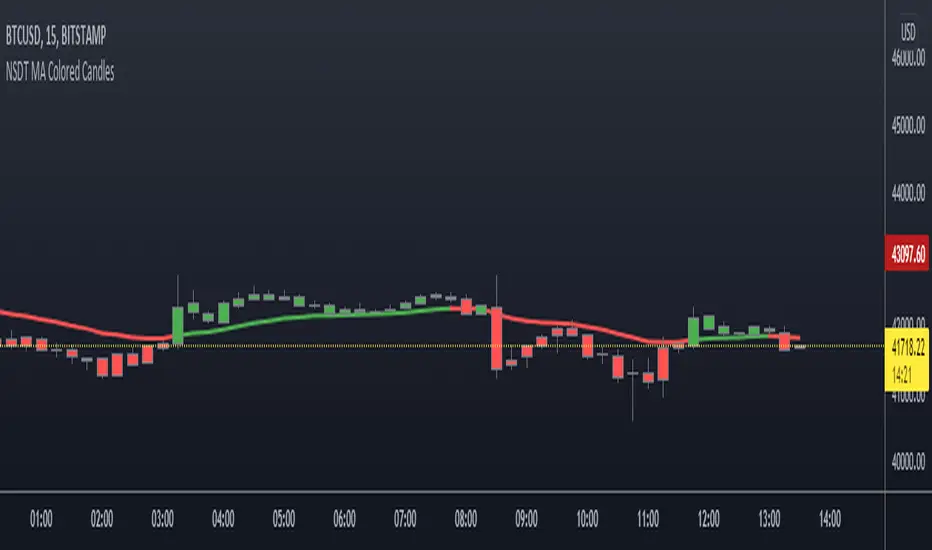
NSDT MA Colored CandlesA simple script that will change the color of the candle if it closes over/under the designated Moving Average. This makes it very easy to identify trends based on your selected Moving Average line length. You can choose EMA, SMA, or WMA and of course the length is adjustable as well. To see these candles, be sure to go into the Chart Settings and uncheck the candle Borders, Colors, and Wicks.
Multi Time Frame CandlesHello Traders,
This script can show (upto) 3 candles of another time frames without changing chart time frame realtime . You can choose the time frame and number of candles in the options. You have option to change body and wick colors as well.
in this example number of candles is 2:
You can set body and wick colors:
In this example, weekly candles are shown on 1h chart:
Enjoy!

HTF Candle CloseThis draws a label to alert user when a higher timeframe candle closes on a intraday chart.
Purpose of it is so that people who mainly use lower timeframe charts do not forget to look at higher timeframe candle closes.

8020 Momentum and Pin CandleWe know the 80-20 Rule works very well in real life. It works well in technical analysis and price action as well.
This script identifies strong or momentum candles applying the rule body should be 80% or more of the range This is 80% body and 20% shadow.
Then there are pin candles where there is a 80% shadow and open and close is in one extreme and body is 20% or less.
If we can trade these 8020 candles effectively our trading will improve dramatically.
Use Momentum Candles for entry, stop loss, watching follow through etc
Use Pin Candles to look for reversals.
Works best in direction of trend.
In bullish market, green momentum candles are more powerful and pin candles after retracement is more powerful and vice versa.

Compare CandlesShows the candles of a specified EXCHANGE:PAIR in an indicator without overlay.
Has the following advantages over the standard comparison in TradingView:
- The compared pair is below your main chart.
- You can see the price of the compared pair.
- You can add multiple compared pairs and all of them will be shown in their own space with their own price.

Highlight Running 30m CandleThis script highlight 30 minute running candle.
mostly used for crypto trading

TOBYGBADE1: Dynamic Big Candle Pip RangeDisplays candle ranges in pips as a histogram in a separate pane, highlights big candles exceeding a dynamic threshold, and colors bars and labels green/red based on bullish or bearish direction.”
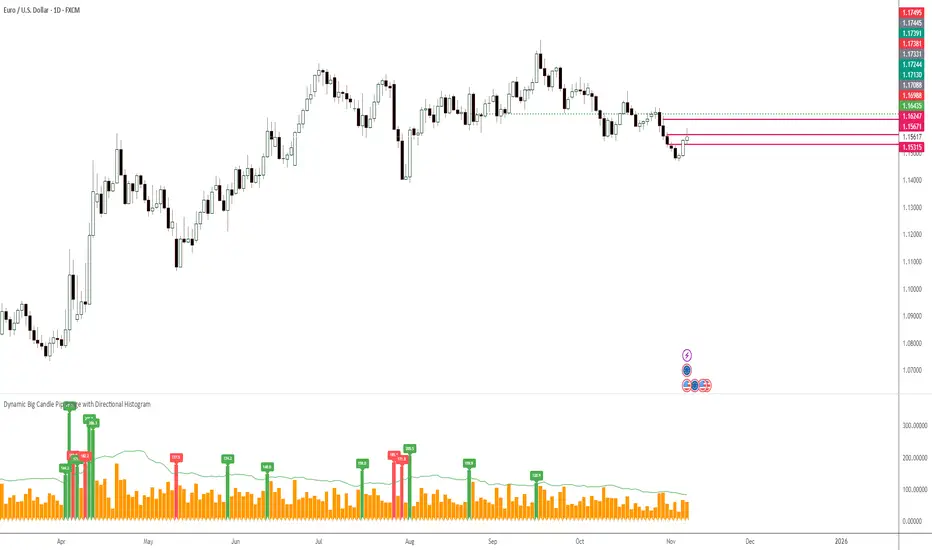
TOBYGBADE1: Dynamic Big Candle Pip RangeDisplays candle ranges in pips as a histogram in a separate pane, highlights big candles exceeding a dynamic threshold, and colors bars and labels green/red based on bullish or bearish direction.”

PDB 4 MA + Candle Strength/Weakness Detector
4MA Strength & Reversal Detector
Unlock the power of momentum with this advanced 4 Moving Average system (20, 50, 100, 200) designed to pinpoint market strength and early reversal zones with precision.
How It Works:
- Bearish Reversal: Triggered when all moving averages align (20 < 50 < 100 < 200) and bearish reversal candles appear — highlighting potential tops.
- Bullish Reversal: Triggered when all moving averages align (200 < 100 < 50 < 20) and bullish reversal candles form — marking potential bottoms
:Best For:
⚡ Scalpers and day traders using 1–5 minute timeframes
📈 Identifying momentum shifts and trend exhaustion early
Tip: Combine this with volume or RSI for stronger confirmation and fewer false signals.

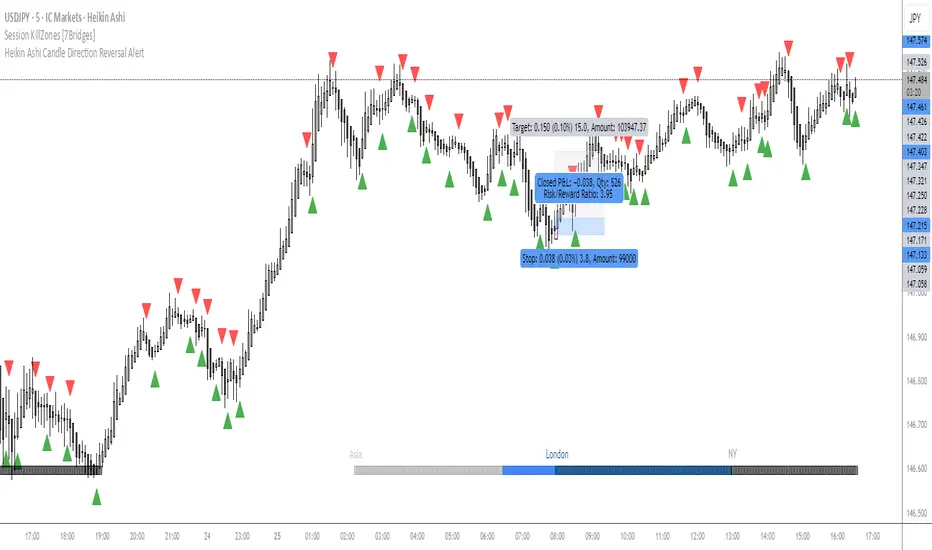
OMN Heikin Ashi Candle Direction Reversal AlertThis is a indicator to let you know once Heikin Ashi candle has changed direction compared to the candle before it. Set an alert on the indicator to get an audible alert.
> 50% Body Candle A script that give the number of ATR of a candle. Good to mesure how explosive a move is.

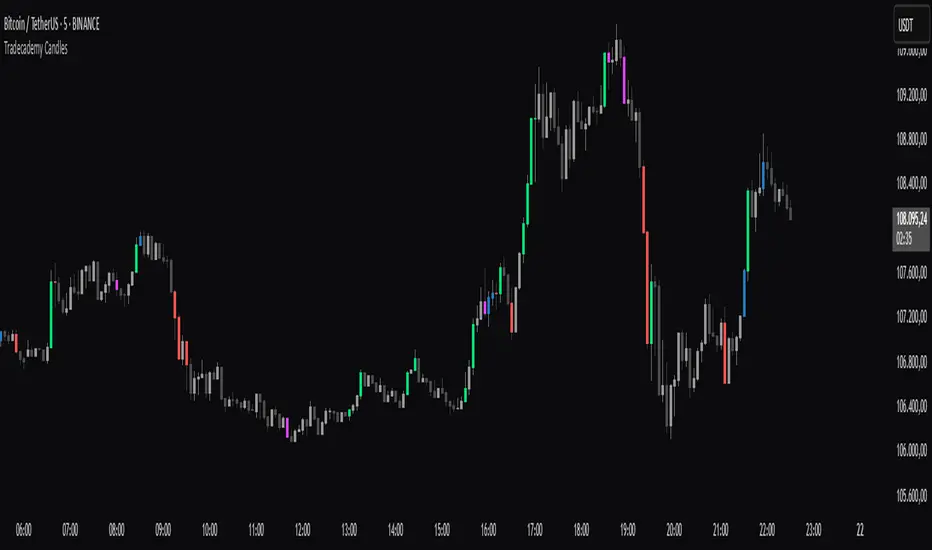
Tradecademy CandlesThe script highlights high-volume candles .
Upward candles with significantly increased volume = green
Upward candles with moderately increased volume = blue
Downward candles with significantly increased volume = red
Downward candles with moderately increased volume = pink
Average Candle RangeThis indicator calculates and displays the average trading range of candles over a specified period, helping traders identify volatility patterns and potential trading opportunities.
Features:
- Customizable lookback period (1-500 bars)
- Clean visual display in a top-right table overlay
- High-precision calculation showing 10 decimal places
- Real-time updates with each new bar
How it Works:
The indicator calculates the range of each candle (High - Low) and then computes the Simple Moving Average (SMA) of these ranges over your specified lookback period. The result is displayed in an easy-to-read table overlay.
Use Cases:
- Volatility Analysis: Monitor market volatility trends
- Position Sizing: Help determine position sizes based on average price movements
- Trading Strategy Development: Use as a reference for setting stop losses and take profits
- Market Phase Identification: Help identify high vs low volatility market phases
Settings:
- Lookback Period: Default is 140 bars, adjustable from 1 to 500
Note:
The indicator displays values with 10 decimal places for high-precision analysis, particularly useful in markets with small price movements.

Engulfing Candles Alert - Multi Symbol (Miu)This indicator plots triangle shapes on each engulfing candles (bullish or bearish) on current chart.
The main use for this indication is to set alerts on multiple symbols at once.
Please follow steps below to set your alarms:
1) Add indicator to the chart
2) Go to settings
3) Check symbols you want to receive alerts (choose up to 8 different symbols)
4) Check if you want only bullish or bearish alerts or both
5) Once all is set go back to the chart and click on 3 dots to set alert in this indicator, rename your alert and confirm
6) You can remove indicator after alert is set and it'll keep working as expected
What does this indicator do?
This indicator will generate alerts anytime a candle closes and reaches bullish or bearish engulfing condition for any of symbol set.
Alert messages example: "Bullish alert on {Symbol}"
This script requests open and close information for each symbol through request.security() built-in function.
Detailed indicator description:
If current bar open is less than or equal to the previous bar close AND current bar open is less than previous bar open AND current bar close is greater than previous bar open THEN True
bullishEngulfing = (openBarCurrent <= closeBarPrevious) and (openBarCurrent < openBarPrevious) and (closeBarCurrent > openBarPrevious)
The opposite condition will be bearishEngulfing
Feel free to give feedbacks on comments section below. Enhancement suggestions are welcome =).
Enjoy!

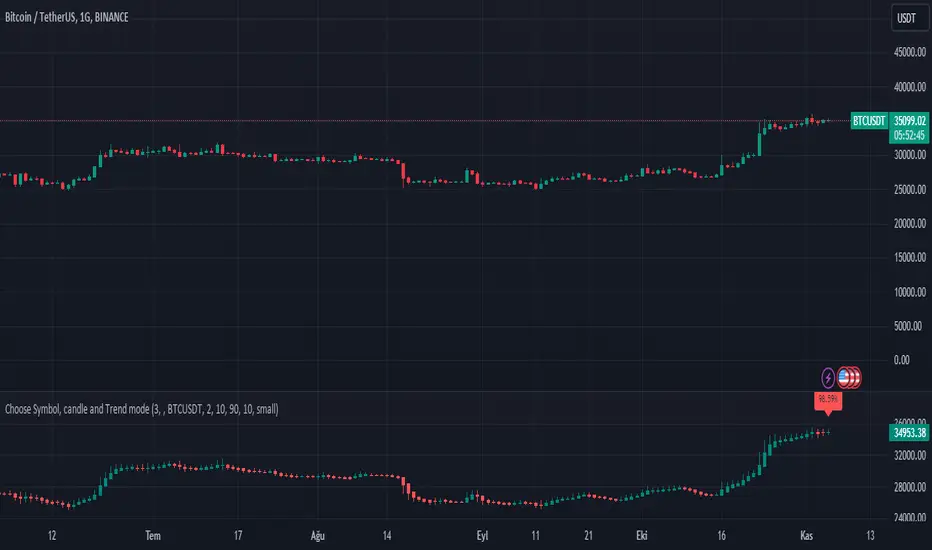
Choose Symbol, candle and Trend modeThis Pine Script code is designed for technical analysis and visualization of price movements on the TradingView platform. It serves as a tool for traders and investors to:
Price Chart Analysis: The code plots the price chart of a selected symbol and utilizes Heikin-Ashi candlesticks to visualize price movements. This aids in better understanding price trends, support and resistance levels, retracements, and other price actions.
Trend Identification: The code also employs the Exponential Moving Average (EMA) to identify the price trend. EMA is commonly used to determine the strength and direction of a trend. Traders and investors can use this information to track trends and develop trading strategies.
Buy and Sell Signals: The code generates buy and sell signals based on EMA. These signals provide information on when to consider buying or selling a specific symbol. This is particularly useful for traders when making trading decisions.
Timeframe Customization: Users can adapt the code to different timeframes. This flexibility is valuable for those looking to develop strategies for both short-term and long-term trading.
Customization: The code allows users to customize various parameters, including the symbol, timeframe, Heikin-Ashi mode, and others. This enables it to be tailored to different assets and trading styles.
Please note that this code is provided for educational and informational purposes only. It does not constitute financial advice or recommendations for specific trading actions. Any trading decisions made using this code should be based on individual research, analysis, and a clear understanding of the associated risks.