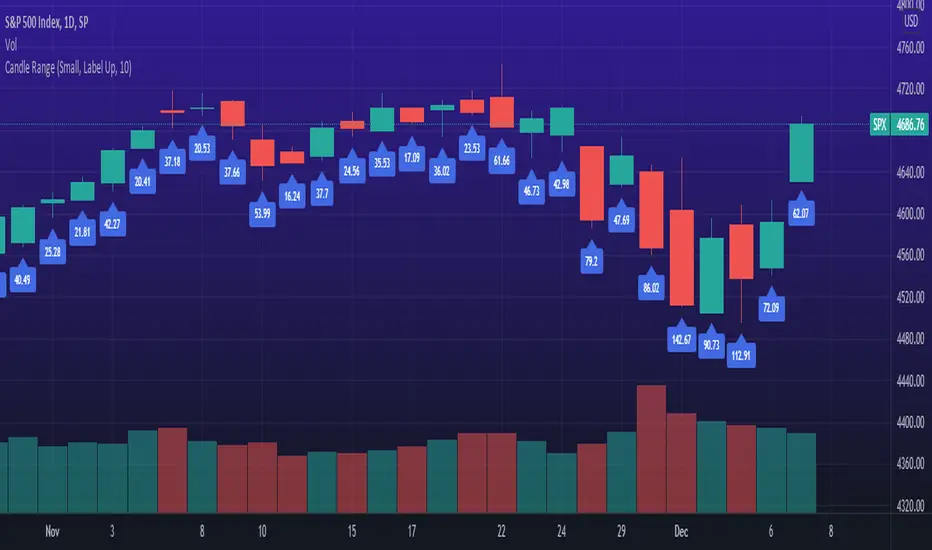
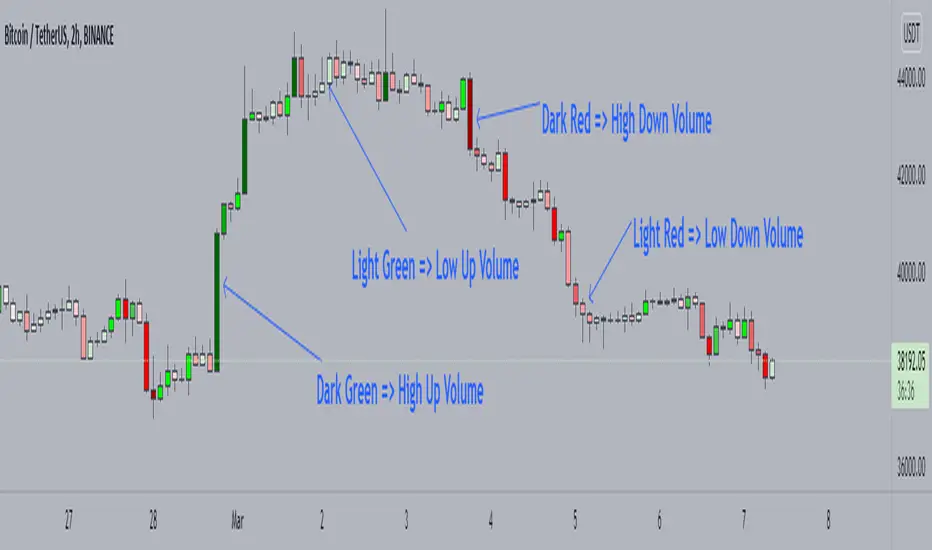
Candle Color by VolumeA simple but effective indicator that paints candles with different shades of colors based on the volume transacted.
-> Supports 6 levels of sensitivity at present. Might enhance the granularity later.
-> Darkest indicates the most volume transacted. Lightest, the least. Change it around however you see fit and based on your theme.
-> Use it for your Volume Spread Analysis and/or in conjunction with any other strategies that you employ.
-> Note that the volume ratio is calculated relative to the average volume of the last n candles ( EMA 20 by default).
在腳本中搜尋"candle"
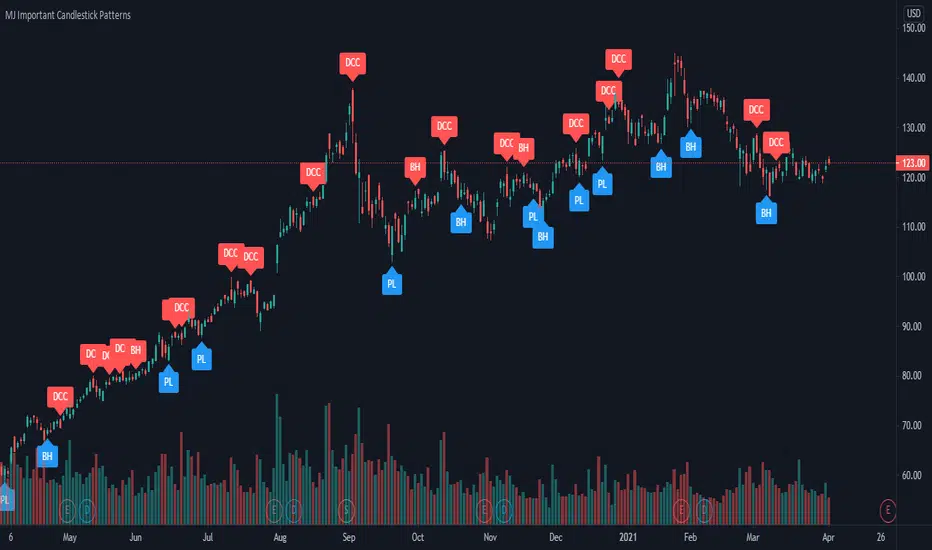
MJ Important Candlestick Patterns + Smart TrendThis script detects 6 important candlestick patterns defined by the author and puts chart labels on your chart for your attention. It also includes a smart trend checking algorithm to detect trends.
The six candlestick patterns covered are:
Bullish Engulfing
Bearish Engulfing
Piercing Line
Dark Cloud Cover
Bullish Harami
Bearish Harami
*** Smart feature of this indicator is that it can detect uptrends or downtrends before alerting you regarding the bullish or bearish reversal candlestick pattern. This is achieved by comparing the typical price (high+low+close divided by 3) of today's candle versus three days ago.
Candle Color ChangeSimple code for change in Barcolor if the range (high-low) is bigger than the last 5 candles.

Heikin Ashi Candles - Actual CloseHeikin Ashi Candles - Actual Close is a simple script that instead of displaying Heikin Ashi Close it displays the actual close.
This script is a handy tool for anyone that wants to use Heikin Ashi candles that displays the real close. The coloring of the candles is still based on the Heikin Ashi calculations.
Enjoy.

Reverse candles chartTurn on all your animal instincts and trade using reverse candles! It is known that beginners do the wrong thing: they catch market reversals, hold losses and quickly take profits.
With reverse candles you will do it right, in theory :)
If anyone tries, please tell me about the results.

Candle Color GeneratorCandle Color Generator:
This indicator is designed to highlight the candle colors based on the combinations of Parabolic SAR (PSAR) and 2 Hull Moving Averages (HMA).
Colors:
Yellow, Red, and Green colors are used to describe the candle colors depends on its position to PSAR and 2 HMAs.
PSAR:
PSAR position above or below candle position is differentiated by Red and Green colors
HMAs:
As default settings 20 HMA is considered as lower period and 50 HMA is considered period for the calculation
Trade What You See:
This indicator will help to see how the setup of particular instrument coming up. Users/Traders can use and trade based on what they see and interpret from it.
Disclaimer:
Idea of publishing this script is to identify the strength of the instrument using multiple confirmation.
Using this indicator, changing inputs (show/hide/change period), and trading decisions are up to the users/traders.
Courtesy:
Thanks to inventors of HMA (Alan Hull), PSAR(Welles Wilder) as these inputs are used to make some calculations

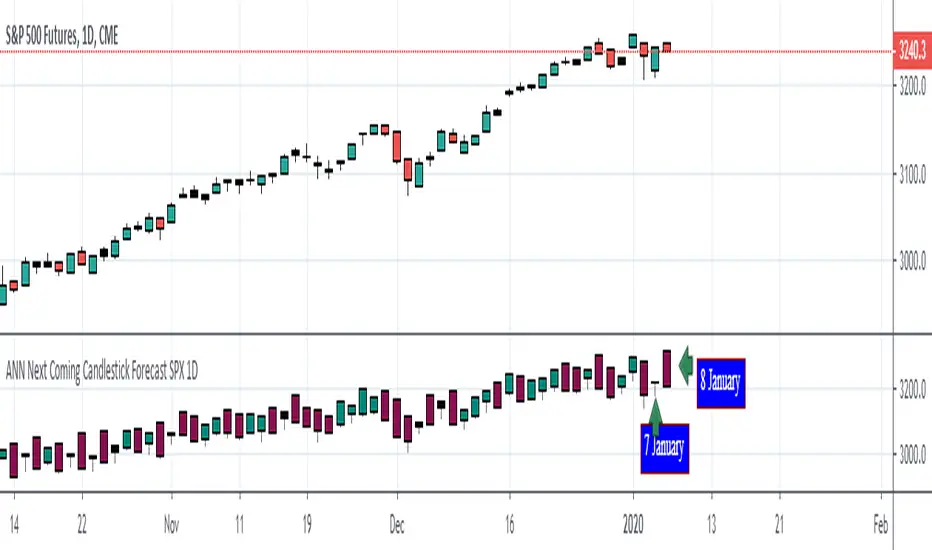
ANN Next Coming Candlestick Forecast SPX 1D v1.0WARNING:
Experimental and incomplete.
Script is open to development and will be developed.
This is just version 1.0
STRUCTURE
This script is trained according to the open, close, high and low values of the bars.
It is tried to predict the future values of opening, closing, high and low values.
A few simple codes were used to correlate expectation with current values. (You can see between line 129 - 159 )
Therefore, they are all individually trained.
You can see in functions.
The average training error of each variable is less than 0.011.
NOTE :
This script is designed for experimental use on S & P 500 and connected instruments only on 1-day bars.
The Plotcandle function is inspired by the following script of alexgrover :
Since we estimate the next values, our error rates should be much lower for all candlestick values. This is just first version to show logic.
I will continue to look for other variables to reach average error = 0.001 - 0.005 for each candlestick status.
Feel free to use and improve , this is open-source.
Best regards.

First 5-Min Candle DetectorHighlights the high and low of the first 5-minute candle of the regular trading session, beginning at 9:30am EST.

Previous Day Candle [ApexFX]Previous Day Candle is a precision tool designed for intraday traders who rely on previous daily structures to find support and resistance.
While most indicators simply mark the previous high and low, this tool focuses on Session Continuity. It highlights the full 24-hour range of the previous day and extends those levels into the "Killzone" of the current trading day (up to 2:00 PM EST / 12:00 PM MST).
Why use this? Market reaction often occurs at the previous day's extremes. By extending these lines into the current session, you can easily spot:
Breakouts: Price pushing through yesterday's high.
Failed Auctions: Price sweeping yesterday's low and reversing.
Support/Resistance Flips: Old highs becoming new support.
Main Features:
Asset Class Presets: Don't worry about timezones. Simply select your market:
Forex: Aligns to the standard 5:00 PM EST New York Open.
Indices: Aligns to the 6:00 PM EST Globex Open.
Crypto: Aligns to UTC Midnight.
Custom: Full manual control for specific needs.
Visual "Boxing": Vertical dotted lines clearly demarcate the start and end of the previous trading day.
Dynamic History: Choose to show just yesterday's levels or look back at the last 5+ days.
Smart Color Coding: The indicator automatically cycles colors for each day (Blue = Yesterday, Green = 2 Days Ago, etc.), making it instant to read historical price action.
Best Used On: Intraday timeframes (5m, 15m, 1h).

First 5-Min Candle High/Low by grantratcliff7Draws two pale yellow lines at the open and the close of the first 5 min candle of the trading session (9:35 EDT)

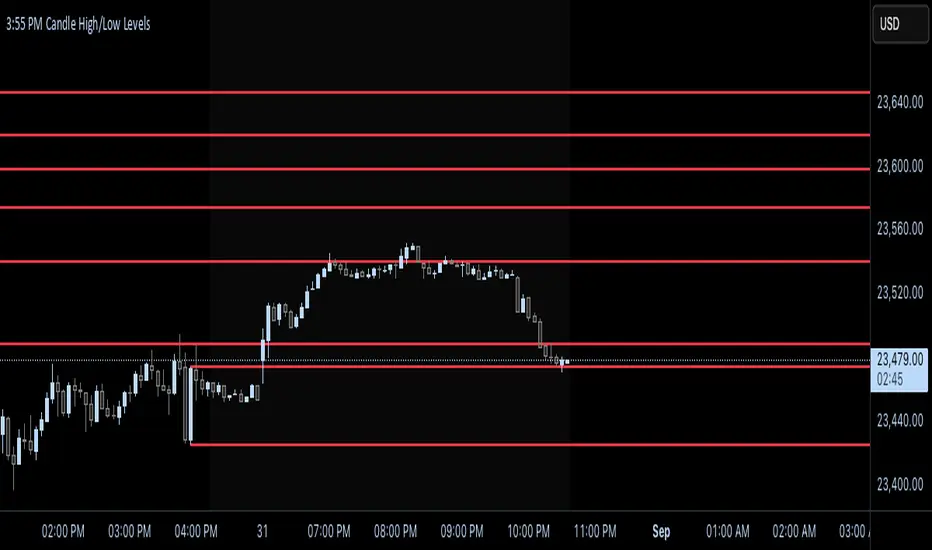
🔫 10:00 AM Candle Range – Bhavishya Sniper ScriptMarks the 10:00 AM candle high and low for intraday breakout trading. Designed for Bhavishya’s sniper entry system during Trading Reset 3.0."

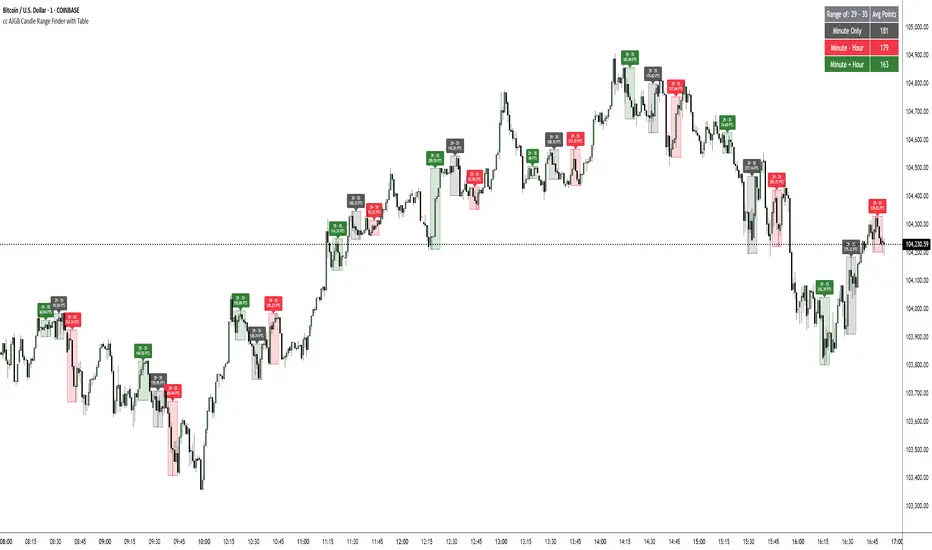
cc AJGB Candle Range Finder with TableOverview:
The "cc AJGB Candle Range Finder with Table" is a versatile Pine Script indicator designed to identify and visualize price ranges within the 1 minute charts based on UTC+2 Time Zone. Unlike traditional range indicators, it offers three unique calculation methods to define ranges based on minute and hour interactions, displays ranges as boxes with labeled point values, and summarizes average range sizes in a customizable table. This tool is ideal for analyzing price ranges of specific time based ranges.
Features:
Customizable Time Range: Users specify a start and end minute (0-59) to define the range period (e.g., 29th to 35th minute).
Three Calculation Methods:
Minute Only: Uses the minute of each bar to identify ranges (e.g., matches user-specified minutes).
Minute - Hour: Adjusts the minute by subtracting the hour, allowing for dynamic range detection across hourly cycles.
Minute + Hour: Combines minute and hour values for a unique range calculation, useful for specific intraday patterns.
Visual Output: Draws boxes around detected ranges, with labels showing the start/end minutes and range size in points.
Summary Table: Displays the average range size (in points) for each method, with customizable position, colors, and text size.
How It Works:
The indicator evaluates each bar’s timestamp in (UTC+2 ONLY) to match user-specified minutes using one or more selected methods. When a start minute is detected, it tracks the high and low prices until the end minute, drawing a box to highlight the range and labeling it with the range size in points. A table summarizes the average range size for each method, helping traders assess typical price movements during the specified period.
Market Analysis: Compare range sizes across different methods to understand intraday volatility patterns.
Settings Customization: Adjust colors, table position, and label sizes to suit your chart preferences.
Settings:
Range to Find: Set start and end minutes.
Range Selection: Enable/disable each method and customize colors.
Range Label Size: Choose label size (Tiny to Huge).
Table Settings: Configure table position (Top, Bottom, Left, Right), sub-position, text size, and colors.
Notes:
Only works on 1 minute charts
The indicator works best using Start Times that are lower than the End Times.
Ensure the chart is set to UTC+2 Time Zone for accurate range detection.
Why It’s Unique:
Unlike standard range indicators that focus on sessions or fixed periods, this tool allows precise minute-based range detection with three distinct calculation methods, offering flexibility for data gathering. The interactive table provides quick insights into average range sizes.
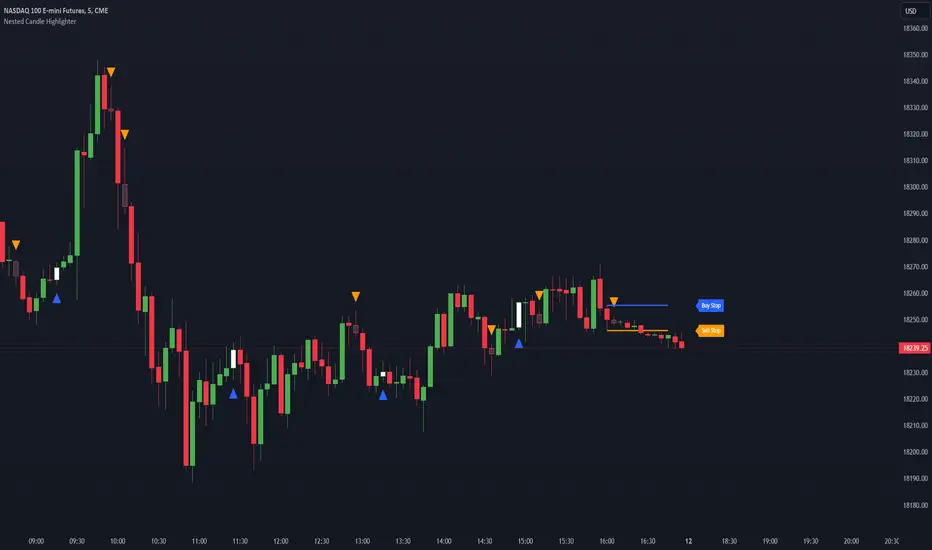
Nested Candle Highlighter @shrilssThe Nested Candle Highlighter identifies when the current candle's body is completely enclosed by the previous candle's wick zones. It examines the upper wick zone, from the previous high to the open or close, and the lower wick zone, from the low up to the open or close. This focused analysis can signal consolidation and potential shifts in momentum, offering an insightful addition to your trading analysis.
Candle Body Color change with Alert-Yogesh PawarThose who wants to get alert for Candle Body Color change, can try this. It will help you.

Traders Reality Vector Candle ZonesVector Candle Zone indicator displays areas of unrecovered liquidity based on PVSRA with override option for the chart symbol.
Developed for TradersReality by infernixx with library conversion by peshocore

HTF Candle Close EpidcoThis draws a label to alert user when a higher timeframe candle closes on a intraday chart.
Purpose of it is so that people who mainly use lower timeframe charts do not forget to look at higher timeframe candle closes.

Hammers & Stars Candle [2022]Hammer and Shooting Star Candle analysis >)
“The home crowd have been right behind their team and there are boos for the officials as they walk off at half-time. Elanga was unfortunate not to win the free-kick, although the clearer foul on him had come before the final tumble. He is entitled to think the ref would bring that back. Instead, United are a goal down.

Igor Sessions Average Candle RangeCalculated Average Candle Range for Igor Sessions. Resets average at these time UTC: 00:00, 06:00, 12:00, 20:00.