Reversal Candlestick Pattern Detector// Name: Reversal Candlestick Pattern Detector
// Condition:
// 1-up move: last n candles, 3/5 move higher; and/or the last is the highest in past n bars
// 2-down move: last n candles, 3/5 move lower; and/or the last is the lowest in past n bars
//
// Show Bullish reversal pattern in down move; Show Bearish reversal pattern in up move;
//
//Reversal candlestick patterns:
//1. Hammer/Shooting Star,
//2. Engulfing,
//3. Morning/Evening Star,
//4. Harami, --Also Harami could be used in continuation (Rally based Rally/Drop based Drop);
//5. Piercing/Dark Cloud cover,
//6. Hook Reversal
//7. Breakaway Gap, or Gap Crosses SMA8, SMA50. This is for un-filled Gap only. low >high or high
在腳本中搜尋"candle"

Bull/Bear CandleThis script will display a small triangle under the latest two candles to indicate whether that candle is bullish or bearish based on the following definition.
A bullish candle closes in the top portion of the trading range of the candle while a bearish candle closes in the bottom portion of the trading range of the candle.
The cutoff is currently set at 65% (you can adjust it) so the close must be outside or equal to 65% of the trading range to be considered bullish or bearish. If less than 65% the triangle will indicate a neutral candle.
Colours are;
green triangle = bullish candle
red triangle = bearish candle
yellow triangle = neutral candle
I hope this helps those using TraderCobb's cradle strategy.
Stocktech- Neutral Candle VisualiserStocktech.in™ — Neutral Candle Visualizer
Stocktech Neutral Candle Visualizer highlights price candles based on body strength.
Large-body candles follow trend direction (green/red), while small or neutral candles are marked in blue.
Simple, clean, and optimized for discretionary traders who prefer clear visual cues without indicators.
Features:
Auto-colored candles based on body size
Trend candles = green (bull) / red (bear)
Neutral/low-strength candles = blue
Works on all markets & timeframes
Created by Stocktech.in™

12 Band Volume matched Candles📌 12 Band Volume matched Candles (Official Description)
12 Band Volume matched Candles is a next-generation volume-strength visualisation tool designed for traders who rely on precision, speed, and clarity.
Instead of colouring candles by price action or relative indicators, this script maps every candle to one of 12 absolute-volume strength bands, using real contract/share volume thresholds that you define.
No guessing.
No subjective smoothing.
No repainting.
Just pure, clean, calibrated volume pressure — visualised instantly.
🔥 Why This Indicator Exists
Traditional volume colouring is vague, delayed, or tied to assumptions (like moving averages).
Scalpers, orderflow watchers, and tape-readers all know the truth:
👉 The raw size of volume matters more than relative volume.
This tool removes all ambiguity and lets you define exact thresholds that match the behaviour of your market:
5k volume
10k volume
20k
35k
50k
70k
… all the way to
200k+ (or whatever instrument volume you want)
Those thresholds map to a 12-band spectrum, ranging from the coldest low-volume purples to the hottest high-volume reds.
The result?
A visual system that lets you read volume pressure instantly, the same way our RSI 12-band spectrum lets you read momentum immediately.
🎨 Premium 12-Band Colour Spectrum
This indicator uses the same refined colour spectrum as the In The Zone RSI – 12 Band script:
Weak Volume (Bands 1–6) – Cold Side
Ultra-dark violet
Deep purples
Cool blues
Light icy blue
Strong Volume (Bands 7–12) – Hot Side
Warm yellows
Oranges
Orange-reds
Deep maroons
Ultra-dark red for max volume
You instantly know:
When volume is dying
When volume is building
When a trend is being pushed
When a breakout has REAL participation
When a reversal is weak or strong
Your brain doesn’t need to “interpret” numbers — just read the colours.
⚙️ Key Features
✔ 12 Custom Volume Thresholds
Set exact volume values that match your instrument.
A perfect companion for multi-indicator visual alignment.
✔ Borders-Only Mode
Keep your chart clean and still read volume strength.
✔ Adjustable Brightness & Opacity
Fine-tune the aesthetic for dark or light chart themes.
✔ Legend Placement Options
Display the volume band legend in any corner of the chart.
✔ Zero Lag – Zero Repaint
Everything is based on historical volume — no tricks.
🚀 Who It’s For
This tool is extremely powerful for:
Scalpers
Momentum traders
Orderflow readers
Breakout traders
Reversal hunters
Algo / quant-style chart readers
Anyone who trades with candle-flow awareness
If you rely on the “feel” of a chart, volume rhythm, or momentum pressure — this indicator becomes a cheat-code.
🎯 Practical Uses
Spot when large players enter a move
Filter weak vs strong pullbacks
Confirm breakout candles
See exhaustion before reversals
Separate noise from real interest
Pair with IZ RSI + price structure for elite scalp precision
⭐ Why Traders Love It
Because it's clear.
Instant.
And it treats volume as the truth, not something to smooth or average.
This is how scalpers and tape-readers naturally think — now in a visual form.
🔥 Final Line
12 Band Volume matched Candles turns raw volume into a crystal-clear language.
Once you see volume this way, you will never go back to traditional colouring again.

Volume-Based Candle ShadingThe Volume Shading indicator dynamically adjusts the color brightness of each price bar based on relative volume levels. It helps traders quickly identify whether a candle formed on low, average, or high volume without needing to reference a separate volume pane.
Candles are shaded dynamically as they form, so you can watch volume flow into them in real time. This indicator is designed to be as minimally intrusive as possible, allowing you to visualize volume levels without extra clutter on your charts.
The additional volume indicator in the preview above is there just for a point of reference to allow you to see how the shading on the bars correlates to the volume.
⸻
SETTINGS:
Bullish and bearish base colors — These serve as the midpoint (average volume) for shading.
Brightness mapping direction — Optionally invert the shading so that either high volume appears darker or lighter.
Volume smoothing length — Defines how many bars are averaged to determine what constitutes “normal” volume.
Candles with volume above average will appear darker or lighter depending on user preference, while those with average volume will be painted the chosen colors, giving an intuitive gradient that enhances volume awareness directly on the chart.
⸻
USES:
Confirming price action: Highlight when breakout candles or reversal bars occur with high relative volume, strengthening signal conviction.
Spotting low-volume moves: Identify candles that lack volume support, potentially signaling weak continuation or false breakouts.
Enhancing visual analysis: Overlay volume dynamics directly onto price bars, reducing screen clutter and aiding faster decision-making.
Custom visual workflows: Adapt the visual behavior of candles to your trading style by choosing color direction and base tones.

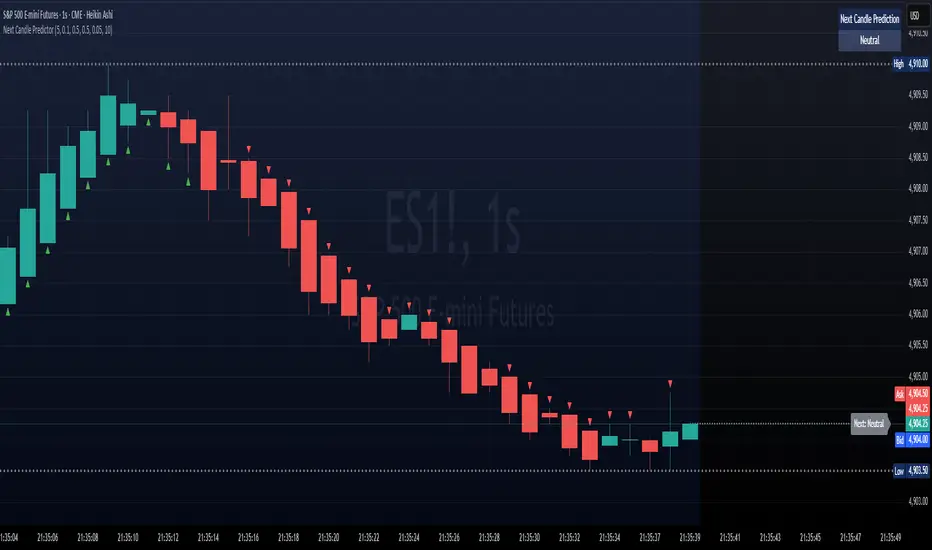
Next Candle PredictorNext Candle Predictor for TradingView
This Pine Script indicator helps predict potential price movements for the next candle based on historical price action patterns. It analyzes recent candles' characteristics including body size, wick length, and volume to calculate a directional bias.
Key Features
Analyzes recent price action to predict next candle direction (Bullish, Bearish, or Neutral)
Visual indicators include small directional arrows and a prediction line
Customizable sensitivity and lookback period
Works best on lower timeframes for short-term price action trading
Displays clear prediction labels that extend into future bars
How It Works
The script analyzes recent candles by examining:
Candle body size (weighted by your preference)
Wick length (weighted by your preference)
Volume activity (weighted by your preference)
These factors combine to create a directional strength indicator that determines if the next candle is likely to be bullish, bearish, or neutral.
Visual Feedback
Green up arrows indicate bullish predictions
Red down arrows indicate bearish predictions
A directional line extends from the last candle showing predicted price movement
A label displays the prediction text at the end of the line
Information table in the top right displays the current prediction
Settings
Lookback Candle Count: Number of historical candles to analyze (2-20)
Wick/Body/Volume Weight Factors: Adjust importance of each component
Prediction Sensitivity: Threshold for triggering directional bias
Prediction Line Length: How far the prediction line extends
Perfect for day traders and scalpers looking for an edge in short-term directional bias.
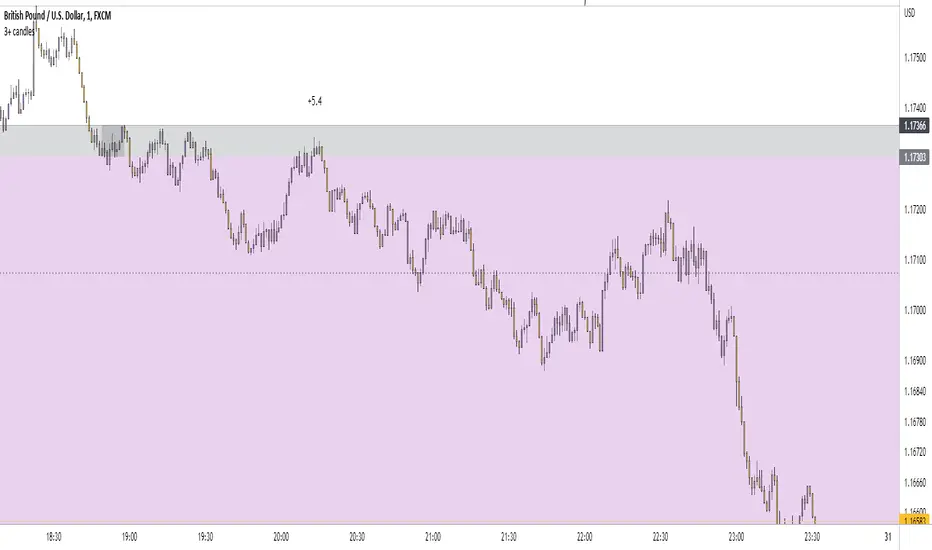
Profitable L 1800 Candle Highlight [Beta]
Certainly! Here's a user guide for the provided Pine Script code:
User Guide: 1800 Candle Highlight Indicator
Overview:
The "1800 Candle Highlight" indicator is designed to visually emphasize the 18:00 (6:00 PM) candle on the chart, providing clarity on its open and close prices, and highlighting its timeframe with a distinctive color.
Key Features:
Candle Highlighting: The indicator identifies the candle that opens at 18:00 and visually distinguishes it from other candles on the chart.
Open and Close Prices: The indicator plots the open and close prices of the 18:00 candle as step lines, making it easy to identify price movements during that timeframe.
Background Color: It colors the background within the 18:00 candle's timeframe with a transparent blue shade, providing further emphasis on that period.
Start Marker: A downward triangle shape marks the start of the 18:00 candle, aiding in identifying the beginning of the highlighted timeframe.
Usage:
Overlay: The indicator is designed to be overlaid on the price chart, allowing users to visualize the highlighted candle alongside price movements.
Interpretation: Traders can observe the open and close prices of the 18:00 candle relative to previous and subsequent candles, aiding in analysis and decision-making.
Timeframe Focus: The highlighted candle's timeframe can serve as a reference point for analyzing price action during specific hours, such as the end of a trading day.
Installation:
Access: Users can access the Pine Script editor within the TradingView platform to create a new indicator.
Copy and Paste: Copy the provided Pine Script code and paste it into the editor.
Save and Apply: Save the indicator and apply it to the desired chart, adjusting settings as needed.
Customization:
Color Scheme: Users can customize the colors used for highlighting, open/close prices, and background to suit their preferences and chart aesthetics.
Styling: Adjustments can be made to line styles, widths, and marker sizes to enhance visibility and clarity.
Compatibility:
The indicator is compatible with TradingView's Pine Script version 5 and can be applied to various financial instruments and timeframes supported by the platform.
Disclaimer:
The "1800 Candle Highlight" indicator is provided for informational purposes only and should not be considered as financial advice. Users are encouraged to conduct thorough analysis and consider multiple factors before making trading decisions.

Identify Rally, Base & Drop CandleThis Pine Script indicator identifies and labels rally, base, and drop candles on your chart, aiding traders in recognizing key price action phases. Rally candles represent periods of upward price momentum, typically characterized by strong bullish movement. Base candles indicate consolidation or sideways movement, suggesting a temporary pause in the trend. Drop candles signify downward price momentum, often accompanied by strong bearish movement. By identifying these distinct candle types, traders can gain insights into the market's current phase and potential future price movements.
Key Features:
Identifies rally, base, and drop candles based on customizable criteria such as body percentage.
Labels each candle type for easy visualization and interpretation.
Helps traders identify trend continuation or potential reversal points.
Compatible with various timeframes and trading instruments.
Customizable parameters allow traders to adjust the sensitivity of the identification process to suit their trading strategies.
Usage Instructions:
Apply the indicator to your chart.
Configure the settings according to your preferences
Observe the labeled candles on the chart to identify rally, base, and drop phases.
Consider additional analysis and risk management strategies to confirm trading decisions and manage risk effectively.
Disclaimer: This indicator is provided for informational and educational purposes only. It is not intended as financial advice or trading recommendations. Trading involves risks, and it's essential to conduct thorough research and practice proper risk management techniques.

Stochastic CandlesIn this indicator I have transformed the %K line into adjustable candles. Because of this I have increased the length of the %D line to be more useful in this context. It is worth noting that you get the same momentum indication as %D set to 4 just because of the default candle transform setting. Incase you need to brush up on how stoch works here is the built in summery.
The Stochastic Oscillator (STOCH) is a range bound momentum oscillator. The Stochastic indicator is designed to display the location of the close compared to the high/low range over a user defined number of periods. Typically, the Stochastic Oscillator is used for three things; Identifying overbought and oversold levels, spotting divergences and also identifying bull and bear set ups or signals.

3 or more consecutive candles
This indicator Colors in candles if there are 3 or more consecutive bearish or bullish candles.
If you are familiar with the BTMM/Stacey Burke Trading concept of expecting a stop hunt after 3 cycles of rise/fall this indicator may be useful to you.
I'm new to coding/making indicators so the code may not be as polished so please bare with me, I am in the process of learning :)
Eventually I'll make it so that you can edit the minimum and maximum number of candles needed for it to be colored, but it may take a long time lol.
EM_RSI Gradient Candles
I've missed the beautiful trend visualization of Heiken Ashi candles ever since I first learned they don't play well with other indicators largely due to the method with which they're plotted.
I wanted to color code a gradient onto candles to help visualize trend strength, and the Relative Strength Index was the first thing to come to mind. For coloring, it's possible the new color.from_gradient function would have worked, but I couldn't guarantee a highly customizable indicator with a single gradient so I took a more classic approach.
First, RSI was calculated using Tradingview's built-in RSI code.
Then I broke down the RSI's range of 1-100 into 10 tiers and assigned each a color option with the ability to turn any particular tier off if desired.
I found it to be extremely modular and helpful in visualizing both trend strength and identifying potential trend reversals due to a reduction in strength.
You can use it on every candle to help inform decisions, or keep all but <10 and >90 turned off so that it only changes candle color during the most extreme trends.
Or anything in between!
This is my first self-coded indicator so I'm already proud.
Please let me know what you think, and feel free to suggest improvements for future versions in the comments!

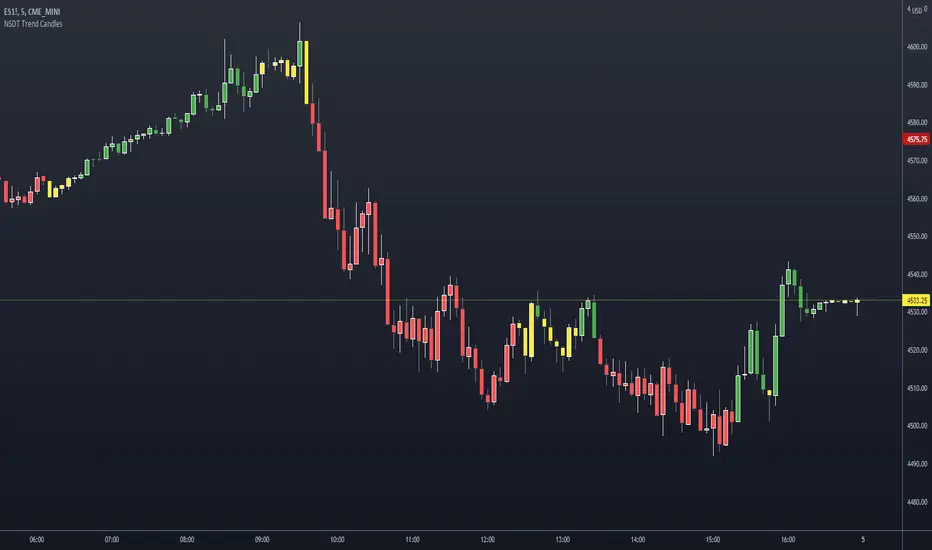
NSDT Trend CandlesThis script changes the color of the candles based on uptrend (green), downtrend (red), neutral/chop (yellow). It uses an ATR and Pivots to determine the direction, or lack of. Since all markets move differently and market volatility changes, you will need to adjust the settings to find a potential match for the day. It's pretty simple to use. Just enter in the direction of the trend and exit (or reverse) when the candle color changes.
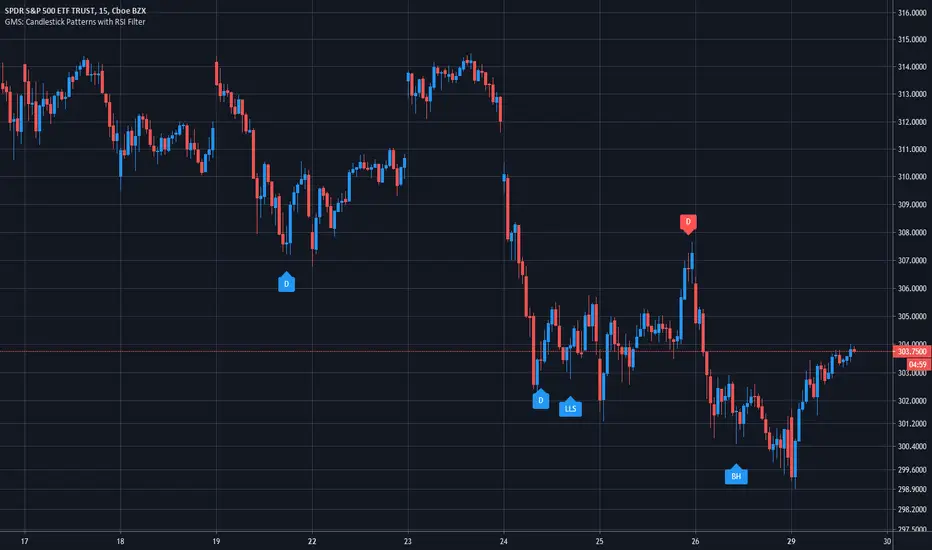
GMS: Candlestick Patterns with RSI FilterI wanted to apply an RSI filter to some of the new Candlestick Patterns (in the indicators tab) since some of them looked to be quite effective for picking reversals. Turns out it's a pretty good pairing.
You can modify the RSI length in addition to the upper and lower thresholds. I also added in check boxes to combine different bullish and bearish patterns.
The candlestick patterns included are:
1. Long Upper Shadow
2. Long Lower Shadow
3. Doji
4. Bullish Harami
5. Bearish Harami
6. Bullish Engulfing
7. Bearish Engulfing
Hope it helps!
Andre
Basing CandlesBasing Candles using custom candles.
First, change default chart from candle to line or something other than candle to make this meaningful

[RS]Multiple Moving Average Candle System V0double ma system built into candle sticks,
wick, above body shows true high, under true low.
the body symbolizes the double ma's, colors for expansion/contraction of the ma's.
optional: can hide true close point(black dots)
good usage with rsi candles:

EMA/SMA Full color signal candles💡 What It Does:
The indicator calculates and plots the 21-period Exponential Moving Average (EMA) and the 30-period Simple Moving Average (SMA). It then analyzes the closing price of each candle and colors the entire candlestick (body and border) according to pre-defined trend conditions.
This visualization allows traders to identify strong trend environments versus periods of consolidation or indecision at a glance, removing the need to constantly check the price relationship manually.
🎨 Color Conditions and Meaning:
The indicator uses three distinct color states to signal the market's current momentum:
Color,Condition,Market Interpretation
🟢 GREEN,Closing Price is ABOVE both the 21 EMA AND the 30 SMA.,Strong Bullish Trend: Suggests high momentum and confirmation of an uptrend. Ideal for long bias.
🔴 RED,Closing Price is BELOW both the 21 EMA AND the 30 SMA.,Strong Bearish Trend: Suggests high downward pressure and confirmation of a downtrend. Ideal for short bias.
⚫ GRAY,"Closing Price is in any other state (e.g., between the two MAs, or under one and over the other).","Neutral / Consolidation: Indicates uncertainty, low momentum, or potential trend exhaustion/reversal. Caution is advised."
🔧 Customization Options:The indicator is fully customizable, allowing users to fine-tune the periods to match their preferred trading style (e.g., scalping, swing trading).Dĺžka EMA (Length EMA): Allows you to change the period for the Exponential Moving Average (default is 21).Dĺžka SMA (Length SMA): Allows you to change the period for the Simple Moving Average (default is 30).
I added also Extra 4 EMA lines to have extra edge.
Manipulation Candle SystemThis indicator is based on One Candle Scalping Strategy by ProRealAlgos
## **Manipulation Candle System – Simple Explanation**
This indicator helps traders identify **potential market manipulation** during the **US stock market session (New York)** and highlights **key reversal signals**.
---
### **1. Daily ATR (Average True Range)**
* Measures the **average price movement** of the day.
* Helps determine if a move is **normal** or **abnormally large**.
* The indicator calculates **daily ATR** automatically.
* If 15 minute opening candle is more than 25% of Daily ATR, we can call it manipulation is happen .
---
### **2. 15-Minute Opening Candle Box**
* Highlights the **first 15-minute candle** of the US session.
* The box **extends for 2 hours** after the market opens.
* **Color indicates market condition**:
* **Red box** → the opening candle range is bigger than 25% of the daily ATR → potential **manipulation**.
* **Blue box** → the opening candle range is normal → **neutral session**.
* Helps traders visually spot when the market might be trying to **trap traders**.
---
### **3. 5-Minute Reversal Detection**
* Looks for **reversal candle patterns** on the 5-minute chart:
* Bullish engulfing or strong bullish pin → **buy reversal**.
* Bearish engulfing or strong bearish pin → **sell reversal**.
* Only checks during the **US session**, after 15 minute opening candle.
* Helps traders **time entries** in the direction of potential market reversals.
---
### **4. Buy / Sell Signals**
* Shows **triangle markers** on the chart:
* **Green triangle below candle** → buy signal.
* **Red triangle above candle** → sell signal.
* The signal text also indicates:
* `"BUY (Trap Reversal)"` → if the reversal occurs during manipulation.
* `"BUY (Normal Reversal)"` → if the reversal occurs during a neutral session.
* `"SELL (Trap Reversal)"` → if a sell reversal occurs during manipulation.
* `"SELL (Normal Reversal)"` → otherwise.
---
### **5. Info Table**
* Appears at the **top-right** of the chart.
* Shows:
1. Daily ATR value.
2. 15-minute opening candle range.
3. Session condition → `"MANIPULATION"` or `"NEUTRAL"`.
4. Current reversal signal text.
---
### **How a New Trader Can Use It**
1. Look at the **color of the opening box**:
* Red → be cautious, price may trap traders.
* Blue → normal market behavior.
2. Watch for **reversal signals** on the 5-minute chart.
3. Use the **info table** to confirm ATR, session bias, and signals.
4. Combine this with **risk management** before entering trades.

Multi-Ticker Anchored CandlesMulti-Ticker Anchored Candles (MTAC) is a simple tool for overlaying up to 3 tickers onto the same chart. This is achieved by interpreting each symbol's OHLC data as percentages, then plotting their candle points relative to the main chart's open. This allows for a simple comparison of tickers to track performance or locate relationships between them.
> Background
The concept of multi-ticker analysis is not new, this type of analysis can be extremely helpful to get a gauge of the over all market, and it's sentiment. By analyzing more than one ticker at a time, relationships can often be observed between tickers as time progresses.
While seeing multiple charts on top of each other sounds like a good idea...each ticker has its own price scale, with some being only cents while others are thousands of dollars.
Directly overlaying these charts is not possible without modification to their sources.
By using a fixed point in time (Period Open) and percentage performance relative to that point for each ticker, we are able to directly overlay symbols regardless of their price scale differences.
The entire process used to make this indicator can be summed up into 2 keywords, "Scaling & Anchoring".
> Scaling
First, we start by determining a frame of reference for our analysis. The indicator uses timeframe inputs to determine sessions which are used, by default this is set to 1 day.
With this in place, we then determine our point of reference for scaling. While this could be any point in time, the most sensible for our application is the daily (or session) open.
Each symbol shares time, therefore, we can take a price point from a specified time (Opening Price) and use it to sync our analysis over each period.
Over the day, we track the percentage performance of each ticker's OHLC values relative to its daily open (% change from open).
Since each ticker's data is now tracked based on its opening price, all data is now using the same scale.
The scale is simply "% change from open".
> Anchoring
Now that we have our scaled data, we need to put it onto the chart.
Since each point of data is relative to it's daily open (anchor point), relatively speaking, all daily opens are now equal to each other.
By adding the scaled ticker data to the main chart's daily open, each of our resulting series will be properly scaled to the main chart's data based on percentages.
Congratulations, We have now accurately scaled multiple tickers onto one chart.
> Display
The indicator shows each requested ticker as different colored candlesticks plotted on top of the main chart.
Each ticker has an associated label in front of the current bar, each component of this label can be toggled on or off to allow only the desired information to be displayed.
To retain relevance, at the start of each session, a "Session Break" line is drawn, as well as the opening price for the session. These can also be toggled.
Note: The opening price is the opening price for ALL tickers, when a ticker crosses the open on the main chart, it is crossing its own opening price as well.
> Examples
In the chart below, we can see NYSE:MCD NASDAQ:WEN and NASDAQ:JACK overlaid on a NASDAQ:SBUX chart.
From this, we can see NASDAQ:JACK was the top gainer on the day. While this was the case, it also fell roughly 4% from its peak near lunchtime. Unlike the top gainer, we can see the other 3 tickers ended their day near their daily high.
In the explanations above, the daily timeframe is used since it is the default; however, the analysis is not constrained to only days. The anchoring period can be set to any timeframe period.
In the chart below, you can observe the Daily, Weekly, and Monthly anchored charts side-by-side.
This can be used on all tickers, timeframes, and markets. While a typical application may be comparing relevant assets... the script is not limited.
Below we have a chart tracking COMEX:GCV2026 , FX:EURUSD , and COINBASE:DOGEUSD on the AMEX:SPY chart.
While these tickers are not typically compared side-by-side, here it is simply a display of the capabilities of the script.
Enjoy!

KJS -- Max Volume CandleKJS — Max Volume Candle
Identifies and highlights the highest-volume candle relative to all candles to its left on the chart.
As each new bar forms, the script checks whether its volume exceeds every prior bar. When a new volume peak appears, that candle is marked (blue for bullish, yellow for bearish), making it easy to spot where momentum, participation, or exhaustion reached a new extreme.
Use it to quickly identify:
• True volume pivots during momentum runs
• Potential trap candles and liquidity grabs
• Continuation moves backed by breakout volume
• Shifts in participation that may precede reversals
The indicator updates automatically as you scroll and works on any symbol and timeframe.

TLM HTF CandlesTLM HTF Candles
Higher timeframe candles displayed on your current chart, optimized for The Lab Model (TLM) trading methodology.
What It Does
Plots up to 6 HTF candles side-by-side on the right of your chart with automatic swing detection, expansion bias coloring, and a quick-reference info table. Watch multiple timeframes at once without switching charts.
Swing Detection - Solid lines for confirmed swings, dashed for potential swings. Detects when HTF levels get swept and rejected.
Expansion Bias - Candles colored green (bullish), red (bearish), or orange (conflicted) based on 3-candle patterns showing expected price expansion.
HTF Info Table - Compact dashboard showing time to close, active swings, and expansion direction for all timeframes. Toggle dark/light mode.
Equilibrium Lines - 50% midpoint from previous candle to current, great for mean reversion targets.
Based on "ICT HTF Candles" by @fadizeidan -
Heavily customized with swing analysis, expansion patterns, and info table for TLM trading concepts.

B A N K $ - HTF Candle Boxes (Power of 3)This indicator allows you to visualise the HTF candles on the LTF's, this is useful for using the Power of 3 / Accumulation, Manipulation & Distribution concepts.
By default, the HTF interval is set to 1h, this means that an outline will be created around the LTF candles that are within that 1h window. (i.e from 13:00-14:00 etc).
Features
HTF Interval Selector - this allows the user to customise which HTF interval to use
Candle Boxes - this outlines the full outer perimeter of the relevant candles
Include Body - this highlights the distance between the candle Open & Close
Show MidLine
Additional Settings
Hide Side Lines - this will only draw the Top & Bottom lines
Extend Lines to Current Candle - most recent Top & Bottom lines will extend to current price
Draw Lines from Exact Candle - this makes the most recent candle lines cleaner
I personally use this indicator to outline the most recent 3 1h candles to make it easier to identify sweeps & reversals however there is additional functionality to allow the user to customise the indicator to their preference.
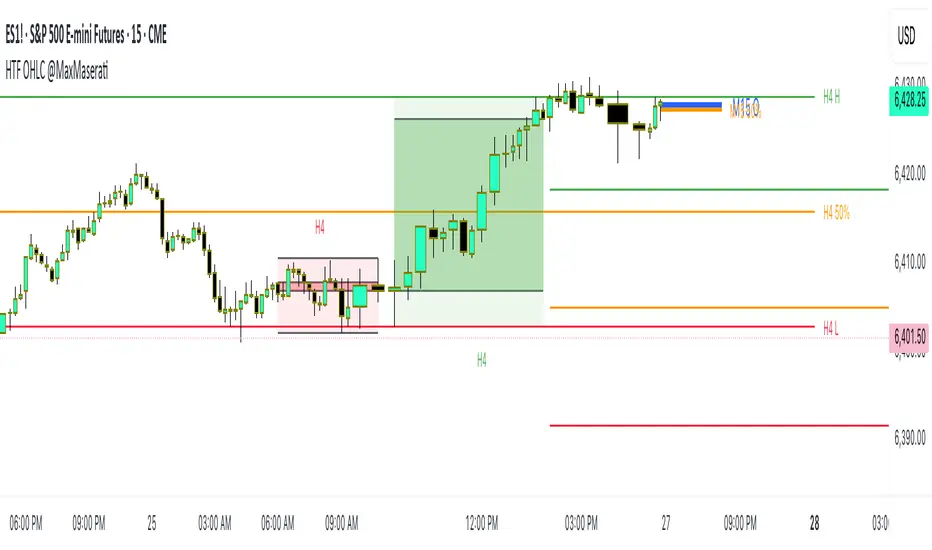
HTF OHLC Candle + 50% @MaxMaseratiHTF OHLC Candle + 50% @MaxMaserati
This advanced multi-timeframe indicator displays higher timeframe OHLC data as visual candle boxes and extended key levels on lower timeframe charts, providing essential context for institutional trading decisions.
Core Functionality:
Multi-Timeframe Box Display:
Main Timeframe Box (Default H4): Shows complete higher timeframe candles as colored boxes with separate body and wick visualization, including bullish (green) and bearish (red) candle representation with customizable transparency levels.
Independent Box 2 (Default M15): Secondary timeframe display with lime/fuchsia color scheme, allowing traders to monitor intermediate timeframes simultaneously with different visual styling.
Independent Box 3 (Default H1): Third independent timeframe with blue/orange color scheme, providing additional context for multi-timeframe analysis and confluence identification.
OHLC Level Analysis:
Each timeframe box includes individual Open, High, Low, and Close level lines with customizable colors and visibility settings. These levels act as key support and resistance zones that institutional traders often respect.
50% Retracement Levels:
Automatic calculation and display of 50% levels between each timeframe's high and low, representing critical equilibrium zones where price often finds support or resistance during retracements.
Extended Line System:
Current Live Timeframe Extended Lines: Real-time extension of the forming candle's Open, High, Low, and 50% levels with customizable line weights and label positioning.
TF2 Extended Lines (Default H4): Previous completed candle's key levels extended forward, showing immediate higher timeframe reference points for current price action.
TF3 Extended Lines (Default Daily): Longer-term reference levels from daily or weekly timeframes, providing macro trend context and major institutional levels.
Key Features:
Smart Timeframe Detection: Only displays boxes for timeframes higher than the current chart timeframe, preventing redundant information and maintaining chart clarity.
Global Box Limit Control: Intelligent cleanup system that maintains optimal performance by limiting total displayed elements while preserving the most recent and relevant timeframe periods.
Comprehensive Customization: Full control over colors, transparency, line weights, label sizes, and visibility for each timeframe component, allowing personalized setups for different trading styles.
Label System: Automatic timeframe identification labels (H4, M15, D1, etc.) positioned on each box for instant timeframe recognition and clear multi-timeframe organization.
Current Candle Options: Optional display of forming/current candles for each timeframe, enabling real-time monitoring of developing price action and potential setup completion.
This indicator is essential for traders utilizing multi-timeframe analysis, institutional trading concepts, and higher timeframe confluence strategies, providing clear visual representation of key levels and candle structures that drive major market movements.
Moving Average Candles**Moving Average Candles — MA-Based Smoothed Candlestick Overlay**
This script replaces traditional price candles with smoothed versions calculated using various types of moving averages. Instead of plotting raw price data, each OHLC component (Open, High, Low, Close) is independently smoothed using your selected moving average method.
---
### 📌 Features:
- Choose from 13 MA types: `SMA`, `EMA`, `RMA`, `WMA`, `VWMA`, `HMA`, `T3`, `DEMA`, `TEMA`, `KAMA`, `ZLEMA`, `McGinley`, `EPMA`
- Fully configurable moving average length (1–1000)
- Color-coded candles based on smoothed Open vs Close
- Works directly on price charts as an overlay
---
### 🎯 Use Cases:
- Visualize smoothed market structure more clearly
- Reduce noise in price action for better trend analysis
- Combine with other indicators or strategies for confluence
---
> ⚠️ **Note:** Since all OHLC values are based on moving averages, these candles do **not** represent actual market trades. Use them for trend and structure analysis, not trade entries based on precise levels.
---
*Created to support traders seeking a cleaner visual representation of price dynamics.*
