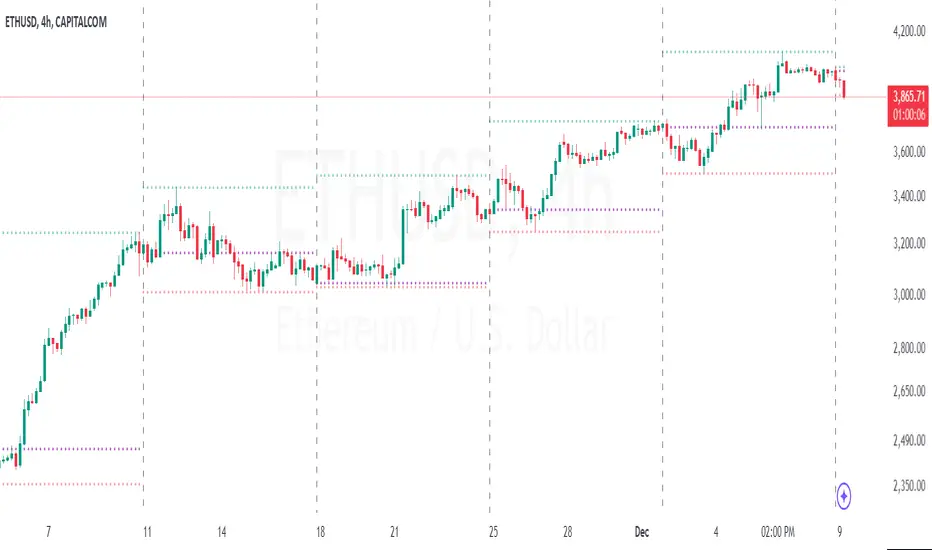
Real-time price distribution in candlesThis indicator splits the candle time into 30 units to indicate where the price was at each time.
In the case of a 1-hour time zone, 60 minutes / 30 = 2 minutes, so this display the location of the price every 2 minutes.
In case of 1 minute time zone, it is displayed every 2 seconds.
CAUTION
If a transaction does not occur, the display may be omitted.
You can change the color of the opening and closing prices and the size of the dots.
在腳本中搜尋"candle"

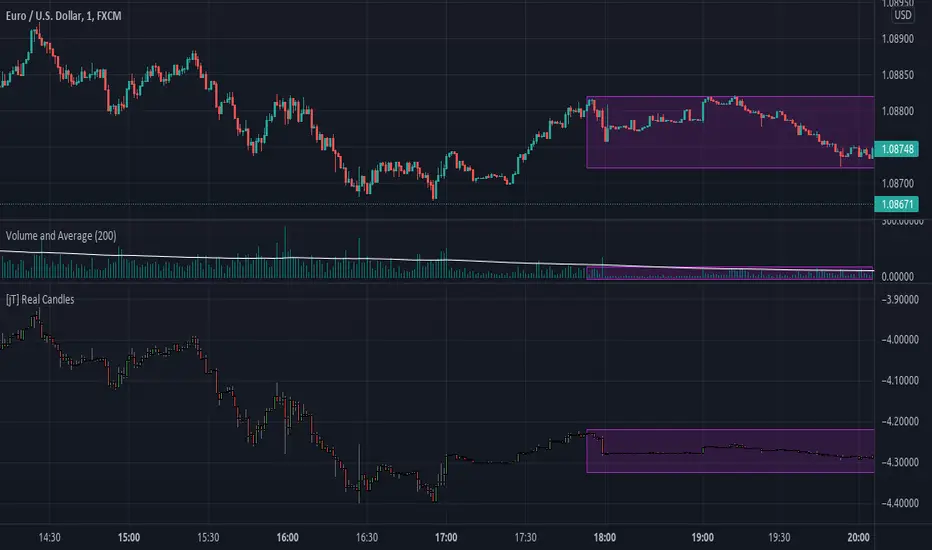
[jT] Real CandlesThis is an "indicator" that takes the candle's size and multiply it by the current volume, so now the candle size is affected by how much volume is being traded.
Here we assume that the volume traded is essential, and now it kinda have a weight on how the price acts. So "dead-volume" areas will be almost inexpressive in the chart, while the areas with huge volume are where the volatility really happens.
Note: the purple rectangles aren't part of the script, they are just to show how a area with no volume behaves.
HTF Candles & PivotsThis indicator displays HTF candles and pivot points.
The candles are displayed in a box and you can select Open-Close, High-Low or both.
You can show all of the past, or just "today only" or "previous day only".
You can also shift one previous candle to the current one.
The pivot point is the normal one.
There is an option to display CPR (Central pivot range).
Example: Shift previous to current

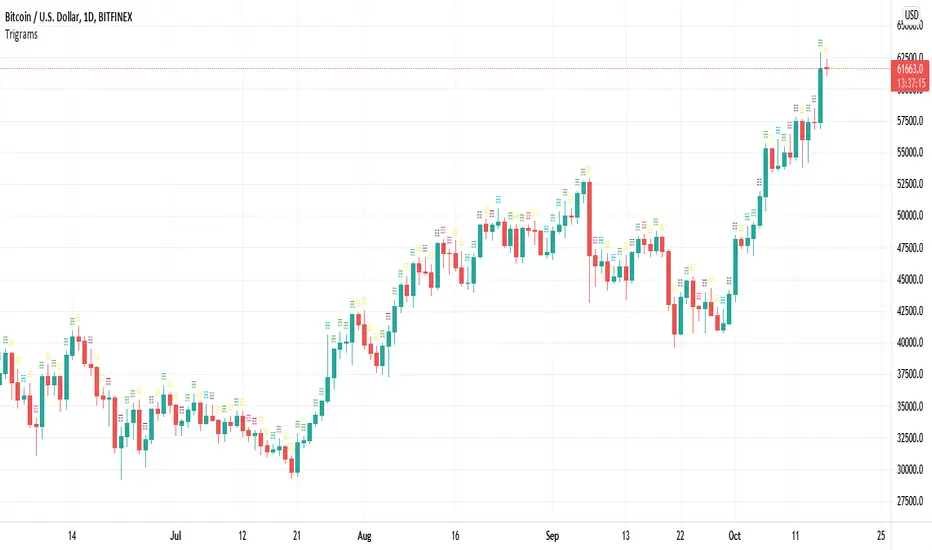
Trigrams based on Candle PatternThis script matches a Trigram for the current candle from its pattern Bullish/Bearish: Marubozu, Hammer, Inverted Hammer, Spinning Top.
The source for Trigram to candlestick pattern can be found online. I'm missing the reputation to add the link here.
Heaven = Bearish Marubozu
Earth = Bullish Marubozu
Thunder = Bearish Spinning Top
Water = Bullish Inverted Hammer
Mountain = Bullish Hammer
Wind = Bullish Spinning Top
Flame = Bearish Hammer
Lake = Bearish Inverted Hammer
The idea is simple. It takes the current candles pattern to match the Trigram.
Inspired by the Trigram Script from ByzantineSC
Anyways, not sure what use it is yet, but if there is anyone else out there interested in I Ching, Yin/Yang theory and trading, this is for you.
No gaps candlesThis indicator repaints the candles so that every candle's open price is the previous candle's close price. This helps visualize stocks and ETFs that have big gaps, usually between trading days.
You should hide visibility of the ticker for this to be displayed properly.

Pivot Point CandlesIndicator that highlights Hammer, Inverted Hammer, Engulfing, and Harami candlestick patterns. Great for those looking for a quick way to show the most popular reversal patterns on the charts.
Options will allow you to select to show Hammers, Engulfing or Harami patterns only. You choose the combinations that you want. Great tool to learn and training your eyes to the patterns.
You also have an option to select "Super" versions of the Engulfing and the Harami patterns, the Supers only shows if the pattern engulfs the body and the wick of the smaller candle in the pattern.
The indicator will show Bullish opportunities and Bearish opportunities on the chart for each of the patterns. The inverted hammer will show at the top indicating a Bear move, and the Hammer will show below price indicating a Bullish move.
Use this indicator in conjunction with other Support & Resistance such as the simple moving averages, trend lines, flat lines, or even Bollinger bands. When these patterns show at or around these points on the chart they will indicate a reversal is pending. Wait for the next candle as confirmation that the move will actually take place in the direction indicated and you will have your pivot point on the chart and create a higher probability of success. Leverage Stochastic, RSI, or CCI indicators to help confirm the reversal as well. Look out for resistance above or support below to determine your targets for the reversal.
Happy trading!

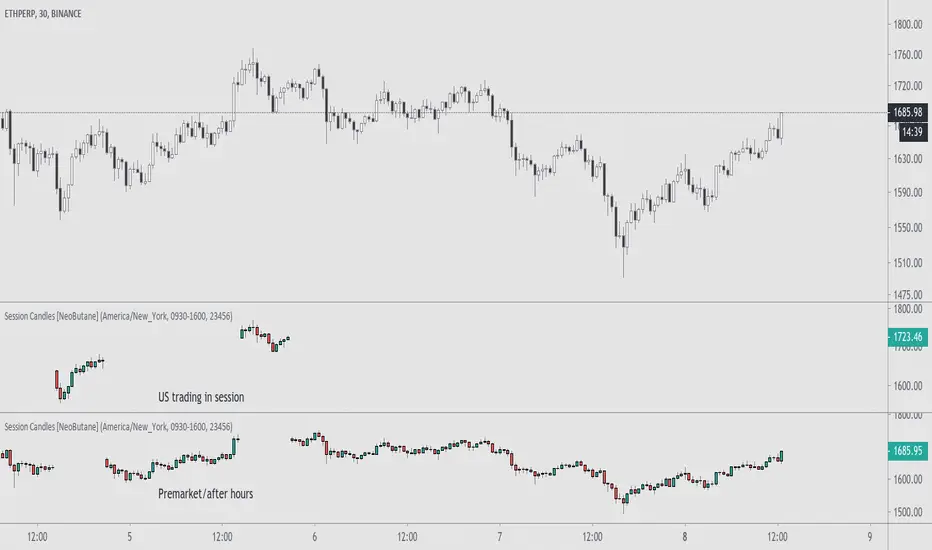
Trading Session Candles [NeoButane]█ OVERVIEW
Display candlesticks for the selected session, regular or extended.
█ CONFIGURATION
Options to change include displaying the regular or extended session, timezone, session hours, and session days.
█ CONCEPTS
Meant for charts with longer trading sessions or to view only extended hours trading action on US stocks that have afterhours available.
█ Notes
For trading days, '23456' refers to Monday to Friday.
Off-chart 21 MA, Bollinger Bands and Heikin Ashi CandlesThis off-chart indicator provides three basic and useful tools for trend trading in Bitcoin and probably other markets. Heikin Ashi candles being utilized with classic candle patterns at the same time could be considered as a conservative and safe confirmation approach for entring your position.

Small candle indicatorI've modified the original script by Wiscodish to show any candle that's smaller than the median of the previous 10 as green. As soon as it crosses the median point it'll change colour to gray.
I've also added a horizontal line where the median is so you can see how close the candle is to becoming large.


Indecision Candle IdentifierThis script helps identify indecision candles on for better entries into trade reversals. Note that I don't believe this signal/indicator should be used as a sole basis for entering/exiting a trade. This is simply to help you have an edge in terms of your chart/candle analysis when your brain fails to keep up with your trades.

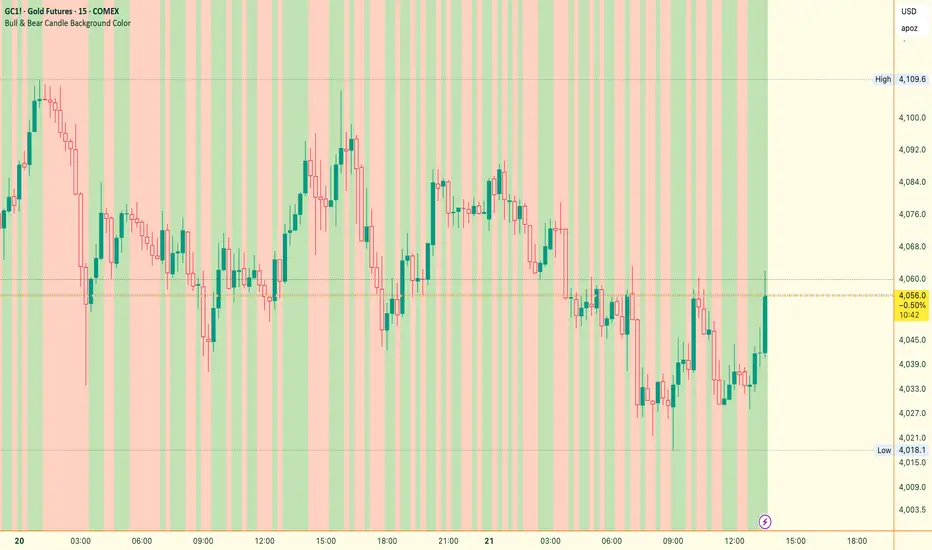
Bull & Bear Candle By Background ColorThe essential chart overlay for high-speed momentum confirmation.
This professional-grade Pine Script v5 indicator provides instant, unfiltered visual feedback on the market's immediate bias by coloring the chart background based on the short-term relationship between Close and Open. It’s designed to streamline decision-making and enhance trade conviction.
Why Traders Use This Tool
In dynamic markets, reading momentum rapidly is critical. This indicator removes visual clutter and cognitive lag.
Zero-Lag Momentum Filter: Instantly identifies if control belongs to buyers (Close > Open) or sellers (Close < Open). A sustained background color acts as a directional bias filter for all your setups.
Trade Confirmation & Conviction: Use the background color as a high-level confluence factor. Only execute Long trades when the background is Bullish and Short trades when it is Bearish. This drastically reduces counter-trend entries.
Risk Management Signal: The appearance of the Neutral/Doji Color flags market equilibrium and consolidation, often preceding a critical structural shift. This is your immediate signal to tighten stops or prepare for a potential reversal setup.
Dual Confirmation: The script offers a highly requested feature: Bar Coloring layered atop the background to provide a second, granular layer of visual context, making momentum shifts impossible to miss.
⚙️ Key Features & Settings Usage
All settings are optimized for clarity, using high transparency to prevent the indicator from obscuring underlying price action or other analytical tools.
🎨 Background Color Settings (Primary)
These controls allow you to define the market state you are reading:
1. Background: Bullish Color: Confirms short-term buying pressure (Close > Open). Set a distinct color for confirmed upward momentum.
2. Background: Bearish Color: Confirms short-term selling pressure (Close < Open). Set a high-contrast color for immediate recognition of downward pressure.
3. Background: Neutral/Doji Color: Signals market indecision (Close ≈ Open). Use as a caution flag, highlighting pivot points and ranging periods.
✨ Added Feature: Bar Coloring
4. FEATURE: Enable Bar Coloring: When enabled, the individual candles are colored with a lighter hue matching the background. This provides dual visual confirmation, maximizing impact on lower timeframes where momentum flips quickly.
🧭 How to Achieve Confluence
Entry Filter: Wait for the background color to flip to your desired direction, then seek your primary entry signal (e.g., breakout, pullback, or MACD cross).
Trade Hold: As long as the background color remains consistent, the short-term momentum is confirmed, justifying the continuation of your trade.
Exit Signal: A flip to the Neutral/Doji Color should be treated as a warning shot, signaling a mandatory review of your position and stops.
Disclaimer: This indicator is a powerful visual and confirmation tool and does not generate buy/sell signals on its own. It is designed to be used in conjunction with your established trading strategy and comprehensive risk management principles
Bullish/Bearish Engulfing Candle ScannerFinds instances on any time frame of bullish or bearish engulfing candles, those with some increased average volume showing green arrows to highlight, otherwise red.

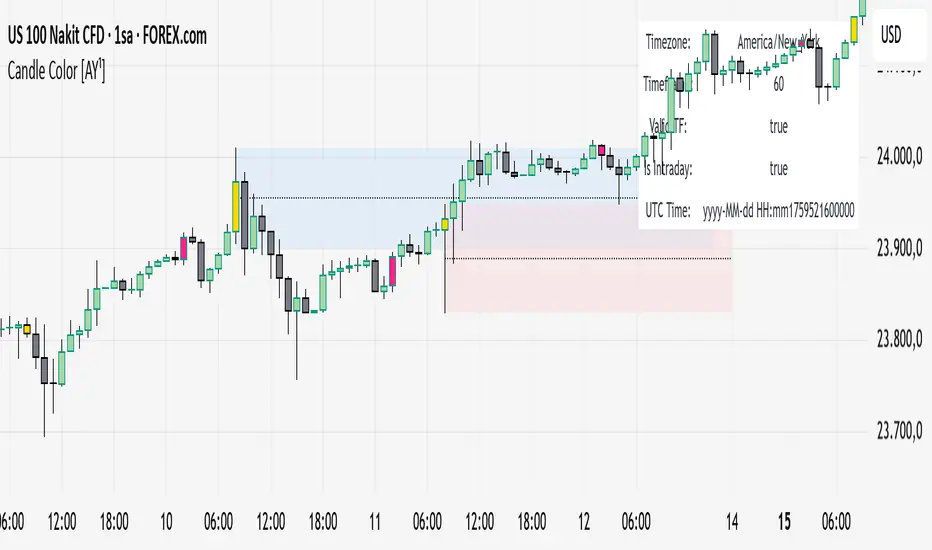
Candle Color [AY¹]Visually highlight specific time periods with custom colors on intraday charts.
Ideal for session-based traders who want to emphasize New York, London or any custom trading hours. Developed by AY¹
Candle Color Highlighter
A simple yet powerful intraday visualization tool that colors candles or chart background during your chosen trading sessions.
Perfect for traders who rely on time-based confluences — such as ICT, SMC, or session scalping frameworks.
🔧 Key Features
✅ Highlight up to four custom time periods (e.g. London Open, NY Open, Lunch Hour, etc.)
✅ Supports multiple highlight styles:
• Bar Color only
• Background only
• Both
✅ Full timezone control (Exchange, UTC, New York, London, Tokyo, or custom UTC+3)
✅ Works on all intraday timeframes or only those you select (1m–4h).
✅ Optional labels marking session starts.
✅ Integrated alerts when any period becomes active.
✅ Informative status table showing timezone, timeframe, and active period.
🕒 Use Cases
Highlight New York Killzone (07:30–09:30) or London Open (02:00–03:00)
Separate different liquidity windows
Emphasize your backtest periods
Combine with volume, displacement, or structure indicators for time-based confluence setups
🎨 Customization
Each of the four configurable periods allows you to choose:
Start/End time
Custom color and transparency
Session label visibility
Highlight style preference
💡 Example Setup
Period Session Time Color Notes
Period 1 02:00–03:00 Magenta London Killzone
Period 2 07:30–08:30 Yellow NY Pre-market
Period 3 08:30–09:30 Blue NY Open
Period 4 09:30–10:00 Green Initial Balance
Volume Avg Every Fifth Candlegives you you a volume to avg (like 1.8x) for the last five candles to help spot momentum moves

UT Bot + LinReg Candles (Dual Sensitivity)
Script Description:
This indicator combines the popular UT Bot Alerts system with Linear Regression Candles (open source) for enhanced trend detection and trading signals in one singel script. The UT Bot features independent, then 2 x ATR sensitivity and periods controls for buy and sell signals, allowing you to fine-tune entries and exits to match your strategy. The script also overlays colored Linear Regression Candles with an optional signal line, helping you visually identify trend strength and direction. All calculations are performed on standard chart prices (no Heikin Ashi). Suitable for all asset classes and timeframes.
Eample setting for usdjpy 5 min chart for repeated buy and sell singnals based on trend:
BUY ATR period 300 multiplier 1
SELL ATR period 1 multiplier 2
Disclaimer:
This script is for informational and educational purposes only. It is not financial advice. Use at your own risk; the author assumes no responsibility for any trading results or losses.
Credits goes to to Ugurvu for linreg candles and quantnomad for UT Bot alerts that make this script possible.
Author: Patrick

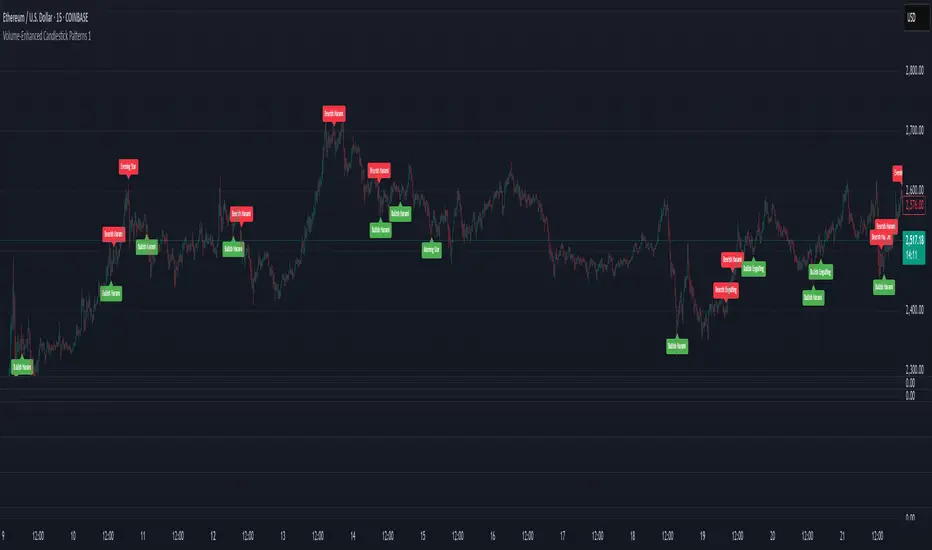
Volume-Enhanced Candlestick Patterns 1
Overview
Scans for four major candlestick reversal patterns:
Harami
Engulfing
Morning/Evening Star
Piercing Line/Dark Cloud Cover
Underlying logic assumes that, at a turning point, the dominant side (bulls or bears) often delivers a “final” push—either a last surge of buying or selling—before the reversal truly takes hold.
Pattern Toggles
Each individual pattern can be turned on or off in the inputs.
Enable only the patterns you want to monitor to reduce chart clutter and speed up performance.
Volume Filter Toggle
On: Requires volume-based exhaustion or climax to confirm each pattern.
Off: Relies purely on price-action candlestick logic (no volume checks).
Grouped Labels & Confluence
When one or more patterns trigger on the same bar close, a single label is drawn:
Grouping multiple confirmed patterns on one bar increases confluence and signal strength.
Climax Volume × Multiplier
Adjusting this input affects signal frequency and conviction:
Higher multiplier → fewer signals but with stronger volume confirmation
Lower multiplier → more signals, each with a looser volume requirement
Alerts
Built-in alert condition for each individual pattern (bullish/bearish Harami, Engulfing, Star, Piercing, Dark Cloud Cover), so you can receive real-time notifications whenever a confirmation occurs.
Follow for Weekly Scripts
If you find this helpful, please hit Follow and 🚀button —I release a new scripts every week.
Disclaimer
Not Financial Advice. This script is for educational and research purposes only.
Use as Part of a Larger System. It should not be used in isolation; combine it with your own risk management rules, additional indicators, and broader market analysis.
No Guarantees. Candlestick patterns and volume filters can improve signal quality, but they do not guarantee profitable trades. Always perform your own due diligence before entering any position.
MTF Candle Direction Forecast + Breakdown🧭 MTF Candle Direction Forecast + Breakdown 🔥📈🔼
This script is a multi-timeframe (MTF) price action dashboard that helps traders assess real-time directional bias across five customizable timeframes — with a focus on candle behavior, trend alignment, and confidence strength.
📌 What It Does
For each timeframe, this dashboard summarizes:
Current direction → Bullish, Bearish, or Neutral
Confidence score (0–100) → How strongly price is likely to continue in that direction
Candle strength → 🔥 icon appears if the current candle has a large body relative to its range
Trend alignment:
📈 = EMA9 is above EMA20
🔼 = Price is above VWAP
Color-coded background to visually reinforce directional state
Each row gives you a visual “at-a-glance” readout of what price is doing right now — not in the past.
💡 Why It’s Useful
✅ Direction forecasting based on price action
Instead of lagging indicators, this script prioritizes:
Candle body-to-range ratio (momentum)
Real-time VWAP/EMA structure
Immediate price positioning
✅ Confidence is quantified
The score (0–100) helps you judge how reliable each directional signal is:
90+ → Strong conviction
50–70 → Mixed but potentially valid
<40 → Weak move or early signal
✅ Timeframe confluence at a glance
See whether multiple timeframes are aligning directionally — helpful for scalping, day trading, or waiting for multi-timeframe breakout setups.
✅ Visual & intuitive
Icons, colors, and layout make it easy to scan your dashboard instead of deciphering charts or code.
🛠️ Adjustable Settings
Setting Description
Timeframe 1–5 Choose any timeframes to monitor (e.g., 5m, 15m, 1h, 4h)
Candle Display Mode Show trend color via emoji (🟢/🔴) or background shading
Strong Candle Threshold Adjust the body-to-range % needed to trigger 🔥 strength
Bullish/Bearish Background Customize label color coding
Neutral Background (opacity) Set transparency or styling for flat/consolidating zones
Table Location Place the dashboard anywhere on the chart
🎯 Use Cases
Scalpers: Confirm trend across 1m/5m/15m before entering
Day Traders: Use confidence score to avoid low-momentum setups
Swing Traders: Monitor higher timeframes for trend shifts while tracking intraday noise
VWAP/EMA traders: Quickly see when price is reclaiming or losing critical trend levels
🧠 What Makes It Unique?
Unlike generic trend meters or mashups of standard indicators, this script:
Uses live candle dynamics (not just closes or lagging values)
Computes directional bias and confidence together
Visualizes strength and structure in a compact, readable interface
Let’s you filter by price action, not just indicator alignment
💥 Why Traders Love Will Love It
✅ Instant clarity on which timeframes agree
✅ No more guessing candle strength or trend health
✅ Confidence score keeps you out of weak trades
✅ Works with any strategy — trend following, VWAP reclaim, EMA scalps, even breakouts
✅ Keeps your chart clean — all the context, none of the clutter
⚠️ Transparency🧬 Under the Hood
Powered by live candle body analysis, trend structure (EMA9 vs EMA20), and VWAP placement.
All scores are generated in real-time — No repainting or lookahead bias: all values are computed with lookahead=barmerge.lookahead_on
Confidence scores reflect the current candle only — they do not predict future moves but measure momentum and alignment in real-time
Labels update per bar and respond to subtle shifts in candle structure and trend indicators
✅ MTF Trend Snapshot (Live Output Example Shown in Chart Above)
This dashboard gives you a fast, visual summary of market trend and momentum across 5 timeframes. Here's what it's telling you right now:
🕔 5 Minute (5m)
📉 EMA Trend: Down
🔼 Price: Above VWAP
Direction: Bearish (42)
🟥 Weak bearish bias. Short-term pullback against a stronger trend. Use caution — lower confidence and mixed structure.
⏱️ 15 Minute (15m)
📈 EMA Trend: Up
🔼 Price: Above VWAP
Direction: Bullish (73)
🟩 Clean bullish structure with growing momentum. Solid for intraday confirmation.
🕧 30 Minute (30m)
📈 EMA Trend: Up
🔼 Price: Above VWAP
Direction: Bullish (77)
🟩 Stronger trend forming. Above VWAP and EMAs — building conviction.
🕐 1 Hour (1h)
📈 EMA Trend: Up
🔼 Price: Above VWAP
Direction: Bullish (70)
🟩 Confident, clean trend. Good alignment across indicators. Ideal timeframe for swing entries.
🕓 4 Hour (4h)
🔥 Strong Candle
📈 EMA Trend: Up
🔼 Price: Above VWAP
Direction: Bullish (100)
🟩 Full trend alignment with max momentum. Strong body candle + structure — high confidence continuation.
🧠 Quick Takeaway
🔻 5m is pulling back short term
✅ 15m through 4h are fully aligned Bullish
🔥 4h has max confidence — big-picture trend is intact
📈 Ideal setup for momentum traders looking to ride trend with multi-timeframe confirmation
Try pinning this dashboard to your chart during live trading to read price like a story across timeframes, and filter out weak setups with low-confidence noise.

Inside 4+ Candles Box (Entry + Target + SMA Stop Logic)🔍 What This Script Does
This indicator detects price compression areas using 4 or more consecutive inside candles, then draws a breakout box to visually highlight the range.
Once price closes above the box, a long entry marker is plotted, along with:
🎯 Target line at 1x box size above the breakout.
❌ Stop-loss at the box low or at a dynamic SMA-based level if the box is too large.
🧠 Why It’s Unique
This script combines inside bar compression, breakout logic, risk control, and visual clarity — all in one tool.
It also cancels the setup entirely if price closes below the box low before breakout, avoiding late or false entries.
⚙️ Customizable Settings
Minimum inside candles (default = 4)
SMA length (used as stop if box is large)
Box size % threshold to activate smart stop
Entry, Target, and Stop marker colors
📌 Notes
For long setups only (no short signals).
Use on any asset or timeframe (ideal on 4H/1D).
This is not financial advice. Use with proper risk management.
Backtest thoroughly before live use.
Built with ❤️ by using Pine Script v6.
🇸🇦 وصف مختصر باللغة العربية:
هذا المؤشر يكتشف مناطق تماسك السعر من خلال 4 شموع داخلية أو أكثر، ثم يرسم مربعًا يحدد منطقة الاختراق المحتملة.
عند الإغلاق أعلى المربع، يتم عرض إشارة دخول وسطر هدف بنسبة 100% من حجم المربع.
كما يتم احتساب وقف الخسارة تلقائيًا إما عند قاع المربع أو عند متوسط متحرك ذكي (SMA) إذا كان حجم المربع كبيرًا.
الميزة الإضافية: إذا تم كسر قاع المربع قبل الاختراق، يتم إلغاء الصفقة تلقائيًا لتجنب الدخول المتأخر.
🧪 للاستفادة التعليمية والتحليل فقط. لا يُعتبر توصية مالية.

Correction Candle CounterIndicator that identifies “correction” candles using the classic 3-1-3 pattern, highlights them with customizable colors and arrow markers, and tallies occurrences across all data, a selected year, or any defined month range. Flexible styling and date-filter options make it ideal for quick, focused analysis.

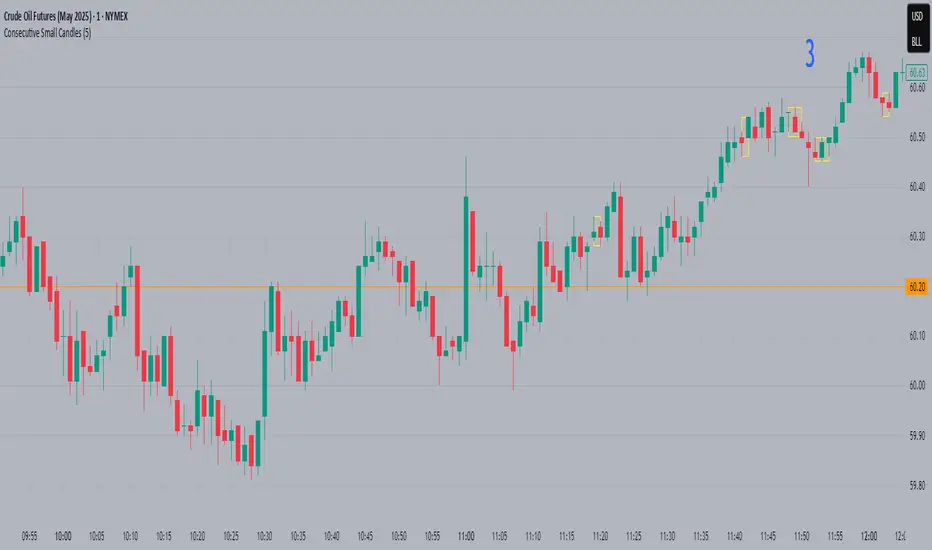
Consecutive Small CandlesThis script identifies relatively "small" candles based on their being smaller than a maximum size you set based on the instrument and your own criteria. Default is 5, as I use this indicator largely on CL which rarely has candles smaller than 3 ticks but frequently greater than 5.
It identifies 2 or more consecutive candles to help identify patterns similar to Bob Volman's Double Doji Break methodolgy. Written by Grok 3.
CHAKRA RISS ENGULFING CANDLESTICK STRATEGYChakra RISS Engulfing Candlestick Strategy
Type: Technical Indicator & Strategy
Platform: TradingView
Script Version: Pine Script v6
Overview:
The Chakra RISS Engulfing Candlestick Strategy combines a momentum-based approach using the Relative Strength Index (RSI) with Engulfing Candlestick Patterns to generate buy and sell signals. The strategy filters trades based on price movement relative to a 50-period Simple Moving Average (SMA), making it a trend-following strategy.
The indicator uses color-coded bars to visually represent market conditions, helping traders easily identify bullish and bearish trends. The strategy is designed to be dynamic, adapting to changing market conditions and filtering out noise using key technical indicators.
How It Works:
RSI-Based Color Conditions:
Green Bars: When the RSI crosses above a specified UpLevel (default: 50), indicating a bullish momentum and signaling potential buy conditions.
Red Bars: When the RSI crosses below a specified DownLevel (default: 50), indicating a bearish momentum and signaling potential sell conditions.
Buy Signal:
Triggered when the following conditions are met:
RSI crosses from below the UpLevel (default: 50) to above it, signaling increasing bullish momentum.
The close price is above the 50-period Simple Moving Average (SMA), confirming an uptrend.
The Buy Signal is plotted below the bar with a green arrow and a "BUY" label.
Sell Signal:
Triggered when the following conditions are met:
RSI crosses from above the DownLevel (default: 50) to below it, signaling increasing bearish momentum.
The close price is below the 50-period Simple Moving Average (SMA), confirming a downtrend.
The Sell Signal is plotted above the bar with a red arrow and a "SELL" label.
Stop Loss and Take Profit:
For long trades (buy signals), the stop loss is placed below the previous bar's low, and the take profit is set at 3% above the entry price.
For short trades (sell signals), the stop loss is placed above the previous bar's high, and the take profit is set at 3% below the entry price.
Dynamic Bar Coloring:
The bar colors change dynamically based on RSI levels:
Green Bars: Indicating a potential uptrend (bullish).
Red Bars: Indicating a potential downtrend (bearish).
These visual cues help traders quickly identify market trends and potential reversals.
Trend Filtering:
The 50-period Simple Moving Average (SMA) is used to filter trades based on the overall market trend:
Buy signals are only considered when the price is above the moving average, indicating an uptrend.
Sell signals are only considered when the price is below the moving average, indicating a downtrend.
Alerting System:
Alerts can be set for both buy and sell signals. These alerts notify traders in real-time when potential trades are generated, allowing them to act promptly.
Alerts can be configured to send notifications through email, SMS, or a webhook for integration with other services like IFTTT or Zapier.
Key Features:
RSI and Moving Average-Based Signals: Combines RSI with a moving average for more accurate trade signals.
Stop Loss and Take Profit: Dynamic risk management with custom stop loss and take profit levels based on previous high and low prices.
Buy and Sell Alerts: Provides real-time alerts when a buy or sell signal is triggered.
Trend Confirmation: Uses the 50-period Simple Moving Average to filter signals and confirm the direction of the trend.
Visual Bar Color Changes: Makes it easy to identify bullish or bearish trends with color-coded bars.
Usage:
This strategy is suitable for traders who prefer a trend-following approach and want to combine momentum indicators (RSI) with price action (Engulfing Candlestick patterns). It is particularly useful in volatile markets where quick identification of trend changes can lead to profitable trades.
Best Used For: Day trading, swing trading, and trend-following strategies.
Timeframes: Works well on various timeframes, from 1-minute charts for scalping to daily charts for swing trading.
Markets: Can be applied to any market with sufficient liquidity (stocks, forex, crypto, etc.).
Settings:
UpLevel: The RSI level above which the market is considered bullish (default: 50).
DownLevel: The RSI level below which the market is considered bearish (default: 50).
SMA Length: The period of the Simple Moving Average used to filter trades (default: 50).
Risk Management: Customizable stop loss and take profit settings based on price action (default: 3% above/below the entry price).

Period Separator & Candle OHLCThis script combines two powerful tools for traders: period separators and custom timeframe-based OHLC (Open, High, Low, Close) data visualization. Here's what it does:
Period Separators:
The script draws vertical lines to indicate the start of new time periods based on a user-defined timeframe (e.g., hourly, daily, weekly).
Users can customize the separator color, line style (solid, dashed, dotted), and width to suit their preferences.
Fetches OHLC data from a higher or custom timeframe (e.g., 4 hours) and overlays it on the current chart.
Users can choose to display the open, high, low, and close prices as dots or circles for easy visualization.
Optionally, the open and close dots can be visually connected with a filled bar for a candlestick-like effect.
The script color-codes the close price relative to the open (green if higher, red if lower) to highlight price direction at a glance.
Fully Customizable:
Users have full control over which OHLC values to display and whether the dots should be filled.
Transparency settings for plotted dots and fills are also adjustable for optimal visibility on different chart styles.
How It Is Useful for Trading:
Timeframe Analysis:
The period separators make it easy to distinguish trading activity across custom time intervals. This is crucial for intraday, swing, and long-term traders who analyze price movements within specific periods.
Multi-Timeframe Insights:
By overlaying OHLC data from a higher timeframe on a lower timeframe chart, traders can identify key support and resistance levels, pivots, and trends that are not immediately visible on the current timeframe.
Trend Recognition:
The color-coded close dots (green for bullish, red for bearish) provide an instant visual cue of market sentiment, helping traders confirm or refute their bias.
Whether you're a scalper, day trader, or position trader, the flexibility in timeframe selection, styling, and data presentation ensures this tool can adapt to your trading strategy.