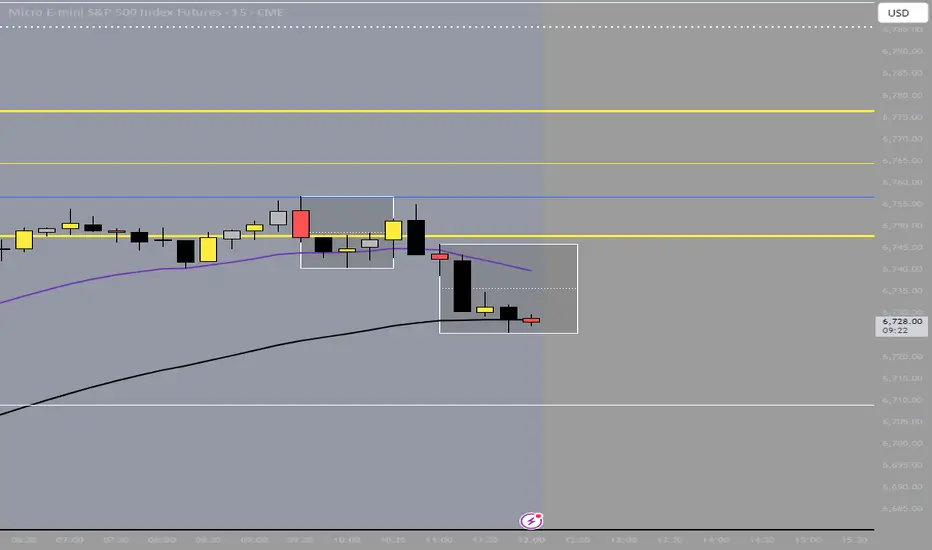
MTF VWAP + Candlestick VWAP Reactions (Bounce + Score)It’s an intraday VWAP + candlestick confluence tool that:
Draws daily, weekly, monthly, yearly VWAPs.
Detects textbook candlestick patterns, classed as BuH/BuM (bullish high/moderate) and BeH/BeM (bearish high/moderate) with colored boxes.
Triggers long/short arrows only when price bounces off a VWAP by at least 0.15% AND there’s a recent matching pattern.
Grades every signal as A / B / C with a score 1–10:
A (8–10) = high-reliability pattern (BuH/BeH) + strong 2-candle body reaction (your A+ setups).
B (5–8) = moderate pattern (BuM/BeM) + one solid bounce.
C (1–5) = weaker / mixed context (scalpy or gamble).
在腳本中搜尋"candle"

First Sub-Candle Coloring (Fixed) - NEXT LEVELThis script colors the first 15m candle inside a 30m candle based on it being bullish or bearish.
Does the same for the first 30m candle inside a 1h candle.
Directional Candle Size TrackerThis indicator measures the strength of bullish and bearish momentum by tracking the average size of candles — but only when they’re moving in the intended direction.
🟢 Bullish Strength rises when green candles expand in size
🔴 Bearish Strength rises when red candles grow in size
When the market pauses or flips direction, the opposing line flatlines, preserving the last value
Unlike traditional moving averages that blend all candles together, this tracker isolates directional pressure, giving you a clearer read on which side is truly in control. It’s especially useful for spotting momentum decay, trap setups, and regime transitions.
Use it to:
Confirm breakout strength
Detect fading conviction
Compare bullish vs. bearish aggression in real time

2 bearish candles above the 8 EMAYou will get a signal when:
Candle n-1 is bearish
Candle n is bearish
Candle n closes above the 8EMA
All on 30-minute timeframe

Volume Quintile Candle ColorsRecolors the candles based on the quintile of volume in that candle compared to the most recent 100 candles

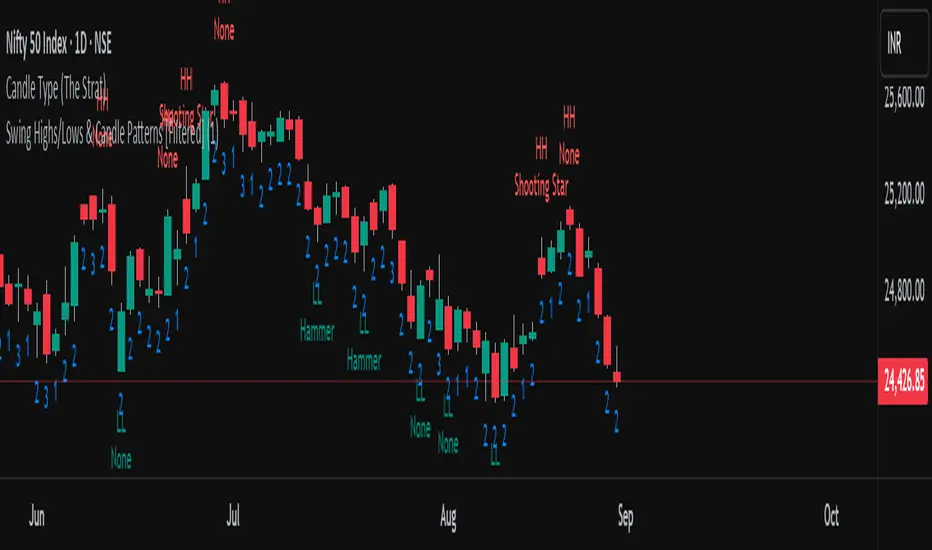
Swing Highs/Lows & Candle Patterns[LuxAlgo] [Filtered]Swing Highs/Lows & Candle Patterns - Tweaked Version
This indicator is a customized and enhanced version of LuxAlgo’s original Swing Highs/Lows & Candle Patterns indicator. It identifies and labels critical swing high and swing low points to help visualize market structure, alongside detecting key reversal candlestick patterns such as Hammer, Inverted Hammer, Bullish Engulfing, Hanging Man, Shooting Star, and Bearish Engulfing.
With added options to selectively display only Lower Highs (LH) and Higher Lows (HL), this tweaked version offers greater flexibility for traders focusing on specific market dynamics. Users can also customize the lookback length and label styling to fit their preferences.
Credit to LuxAlgo for the original concept and foundation of this powerful tool, which this script builds upon to support more tailored technical analysis. Ideal for swing traders and technical analysts seeking improved entry and exit signals through a combination of price swings and candlestick pattern recognition.
First Opposite Candle After 3+ (Yellow & Streak Alerts)This overlay tracks consecutive candle direction: when three or more bars run the same way, the very next opposite-color candle is spotlighted in yellow. Two built-in alert events keep you hands-free:
“First Opposite Candle After 3+” – fires the moment that yellow reversal prints.
“3+ Candle Streak” – pings every bar while a bullish-or-bearish run is ≥ 3 candles long.

[TehThomas] - Displacement CandlesOverview:
This PineScript is designed to detect and visualize significant price movements, called displacements, on a trading chart. It's particularly useful for traders who want to identify potential trend changes or strong market sentiment quickly.
How the Script Works
User Input:
The script allows users to set a custom threshold for displacement detection and choose colors for bullish and bearish movements.
Displacement Detection Function:
isDisplacement(series, threshold) =>
percentage_change = math.abs(series - series ) / series * 100
percentage_change > threshold
This function calculates the percentage change between the current and previous price.
If the change exceeds the set threshold, it's considered a displacement.
Bullish and Bearish Detection:
bullish_displacement = isDisplacement(close, threshold) and close > close
bearish_displacement = isDisplacement(close, threshold) and close < close
Identifies whether the displacement is bullish (price increase) or bearish (price decrease).
Candle Coloring:
barcolor(bullish_displacement ? bullish_color : bearish_displacement ? bearish_color : na)
Changes the color of candles based on the detected displacement type.
Usefulness and Applications:
Trend Identification: Helps in quickly spotting potential trend changes or continuations.
Volatility Analysis: Provides a visual representation of market volatility.
Entry and Exit Signals: Can be used to identify potential entry or exit points for trades.
Market Sentiment: Offers insights into the strength of bullish or bearish sentiment.
Customizable Sensitivity: The adjustable threshold allows traders to fine-tune the indicator based on the asset's typical volatility.
Visual Clarity: By changing candle colors, it provides a clear, at-a-glance view of significant price movements.
Complementary Tool: Can be used alongside other technical indicators for confirmation of signals.
Multiple Timeframe Analysis: Applicable across different timeframes to suit various trading styles (day trading, swing trading, etc.).
Educational Purpose: Helps new traders understand and visualize significant price movements in the market.
Backtesting: Can be incorporated into strategy backtests to assess its effectiveness in different market conditions.
This script is particularly handy for traders who want to cut through market noise and focus on significant price movements. It's versatile enough to be used across different trading strategies and can be a valuable addition to a trader's technical analysis toolkit.
It's a very easy script and not alot to mention. If you see any improvements please let me know.

BoS yellow candleThe "BoS Yellow Candle" indicator identifies and highlights the first candle that breaks a Break of Structure (BoS) in a given look-back period. A BoS occurs when the price either breaks above the highest high or below the lowest low within a user-defined look-back range (default set between 7 and 12 candles).
Bullish Break of Structure: The first candle to break above the previous high is marked with a yellow body.
Bearish Break of Structure: The first candle to break below the previous low is also marked with a yellow body.
This visual aid helps traders quickly identify potential structural breakouts for further analysis or strategy development.

Custom 4-Hour Candle Colors with Opening Price LinesDescription:
This indicator enhances the visual clarity of 4-hour candles by allowing users to assign custom colors to each 4-hour time block on their chart. It also provides the option to plot horizontal lines at the opening price of each 4-hour candle, with the lines extending for a customizable duration (up to 36 hours), making it easy to track the opening price levels over time.
Features:
Custom 4-Hour Candle Colors: Define unique colors for each 4-hour candle block on the chart. You can configure the colors for six different 4-hour periods, making it easier to visually differentiate between different parts of the trading day.
Opening Price Lines: The indicator plots horizontal lines at the opening price of each 4-hour candle, with the option to extend the lines for up to 36 hours into the future. The lines can also have different colors, which you can configure separately for each time block.
Flexible Time Configuration: Set custom open times for each 4-hour candle block, allowing you to adjust the indicator to match specific market sessions or time zones.
Fully Customizable: Choose both the candle colors and the opening price line colors independently for each 4-hour period. This allows for a highly personalized chart setup.
Use Cases:
Session Tracking: Easily track different trading sessions by assigning specific colors to different time periods.
Key Price Levels: Keep an eye on important opening price levels throughout the day by extending opening price lines into the future.
Visual Organization: For traders who prefer color-coded charts for improved readability, this indicator helps to organize trading days visually by color-blocking each time segment.
Important Notes:
Due to TradingView’s limitations, the opening price lines can only extend up to 500 bars into the future. The indicator automatically limits the duration of the lines to this maximum.
The script is designed to be flexible and user-friendly, allowing for easy adjustments to suit different trading styles and market conditions.

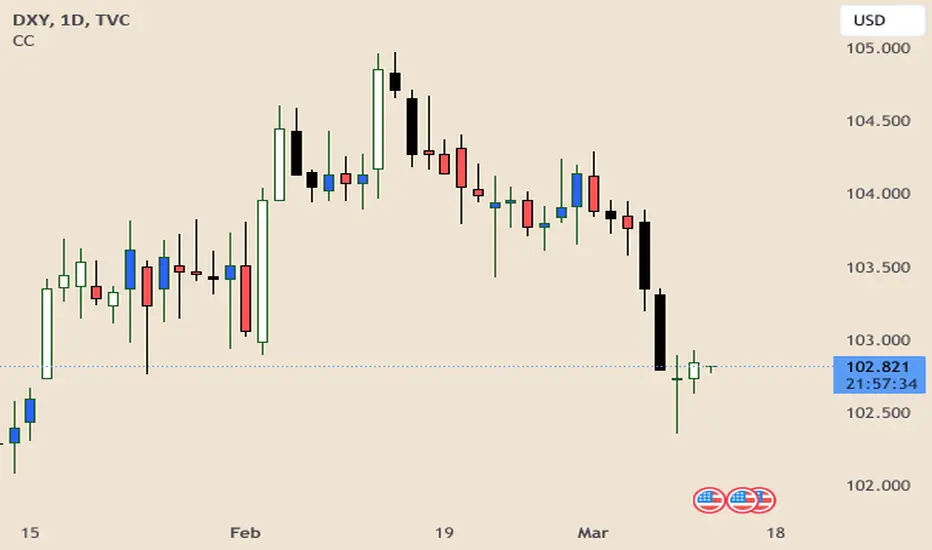
Correlation Coefficient Colored CandlesThis script utilizes Tradingview's built in Correlation Coefficient indicator to calculate the correlation coefficient between two assets and changes candle colors based on the related data.
Info From Correlation Coefficient Indicator:
Correlation Coefficient (CC) is used in statistics to measure the correlation between two sets of data. In the trading world, the data sets would be stocks, etf's or any other financial instrument. The correlation between two financial instruments, simply put, is the degree in which they are related. Correlation is based on a scale of 1 to -1. The closer the Correlation Coefficient is to 1, the higher their positive correlation. The instruments will move up and down together. The higher the Correlation efficient is to -1, the more they move in opposite directions. A value at 0 indicates that there is no correlation.
This indicator allows for choosing the correlated asset, between direct and inverse correlation, the length of the series, and the correlation factor that will trigger the candles to change colors.
Example 1: You choose Direct correlation with a factor of 0.75, the candles that fall below that correlation factor will paint in your desired colors based on their closing price (up or down).
Example 2: You choose Inverse correlation with a factor of -0.75, the candles that rise above that correlation factor will paint in your desired colors based on their closing price (up or down).
Chart Shows Direct correlation of DXY and US10Y with length 3 and correlation factor of 0.75
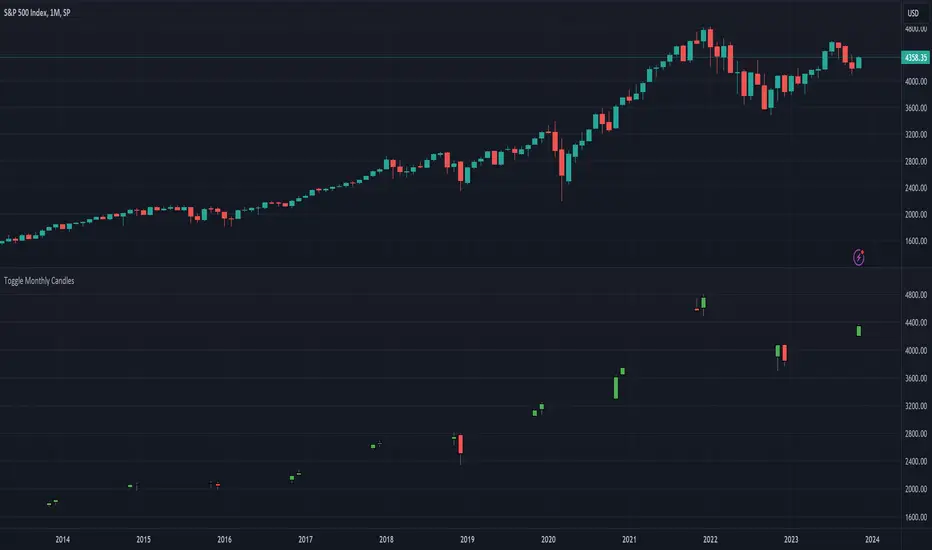
[dharmatech] : Toggle Monthly CandlesThis indicator allows you to only show specific monthly candles.
It's designed to be used with the monthly interval.
The settings allow you specify which months to show.
By default, it only shows January.
In this example screenshot, Nov and Dec are shown.
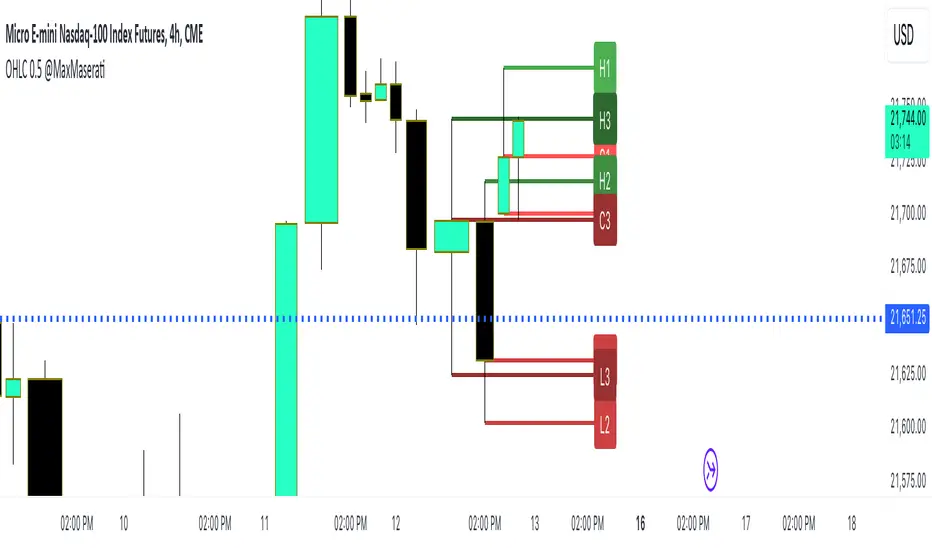
OHLC Lines + 50% of the previous candleThis indicator automatically put a straight line on the High, Low, Close, and Open and calculates the Consequent Encroachment or the midline (50%) of the previous candle. The calculation for the midline can be based on either the High and Low or the Open and Close. The option to disable OHLC labels is available. The indicator displays the premium and discount areas of the previous candle, allowing for a strategy of buying on discount and selling on premium based on each candle stick.
Custom Candle color Inside/Outside candles, Highwave, Star Patt.This script paints outside and inside candles (orange), highwave candles (purple, and morning and evening star patterns (red). You should use hollow candle sticks with this script. I use it to find change in trends or where indecision is present.
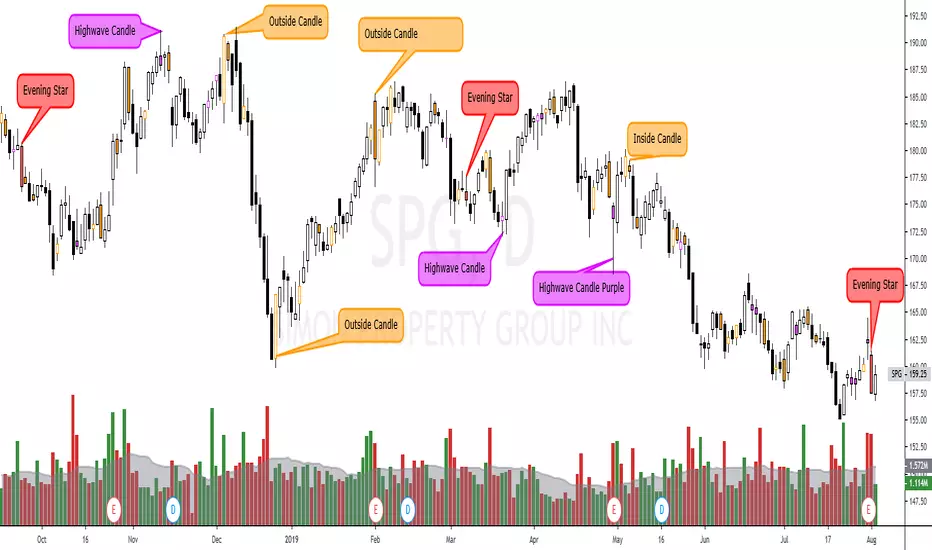
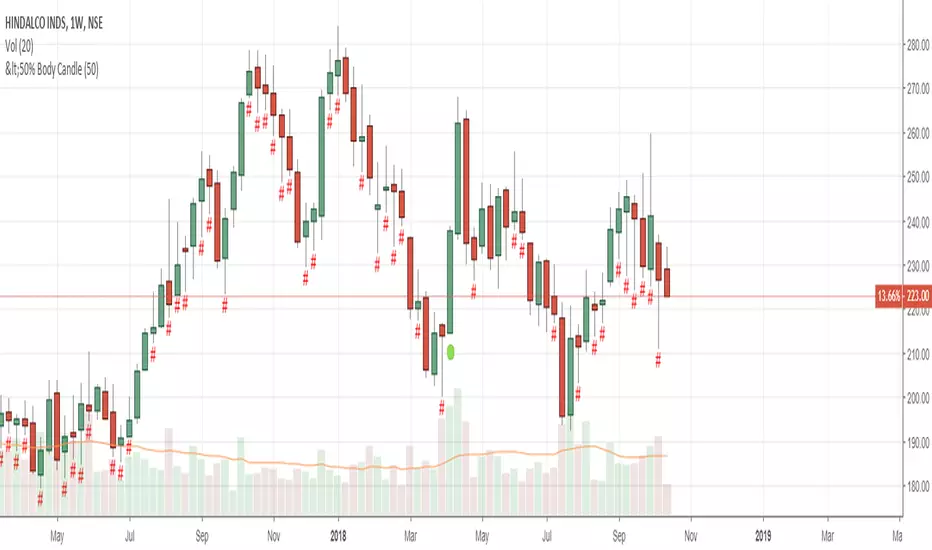
Indecisive candlesIndecisive candles are candles with <20% of the candle being the candle body and 80% of the candle being wicks.

Pullback Candle (Bullish & Bearish, No EMA)🔍 Purpose
This indicator detects simple pullback reversal patterns based on price action and swing highs/lows — without any moving average or trend filters.
It highlights:
Bullish pullbacks (potential bounce/long setups)
Bearish pullbacks (potential rejection/short setups)
📈 Bullish Pullback Criteria
Three-bar pattern:
Bar 3: Highest close
Bar 2: Lower close
Bar 1: Even lower close
Current bar closes above previous bar (bullish reversal)
One of the last two candles is the lowest low of the past 6 bars (swing low)
📍 Result: A small green cross is plotted below the bar, and the bar is colored green.
📉 Bearish Pullback Criteria
Three-bar pattern:
Bar 3: Lowest close
Bar 2: Higher close
Bar 1: Even higher close
Current bar closes below previous bar (bearish reversal)
One of the last two candles is the highest high of the past 10 bars (swing high)
📍 Result: A small red cross is plotted above the bar, and the bar is colored red.
🔔 Alerts
One alert condition each for bullish and bearish pullback detection.
Can be used to trigger TradingView alerts.
🛠️ Customization
No inputs — fully automated logic
Clean, minimal, and fast
Can be extended with labels, alert sounds, or signals

Largest Candles with Price DifferenceThis script shows the largest move on a candle on a particular time frame. So if you are looking at the 10-minute chart, it will tell you what the largest 10-minute candle has been in the past.

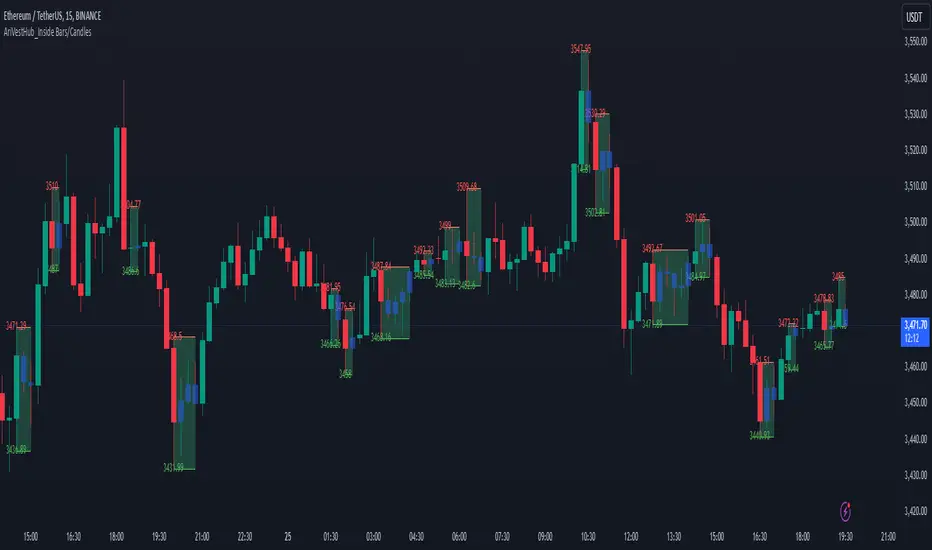
AriVestHub_Inside Bars/Candles
Introduction:
This script identifies and marks inside bars on your TradingView charts. An inside bar pattern is a two-bar candlestick pattern where the second bar is entirely within the range of the first bar. This pattern often signals consolidation and can indicate a potential breakout or trend continuation.
Trading Signals:
Inside bars can indicate potential trading signals. Traders often watch for breakouts above or below the inside bar to identify potential entry points.
Customization:
You can customize the colors, styles, and labels to suit your preferences.
Conclusion
This script is a useful tool for traders looking to identify inside bar patterns on their TradingView charts. By highlighting these patterns, traders can make more informed trading decisions based on potential market consolidations and breakouts.
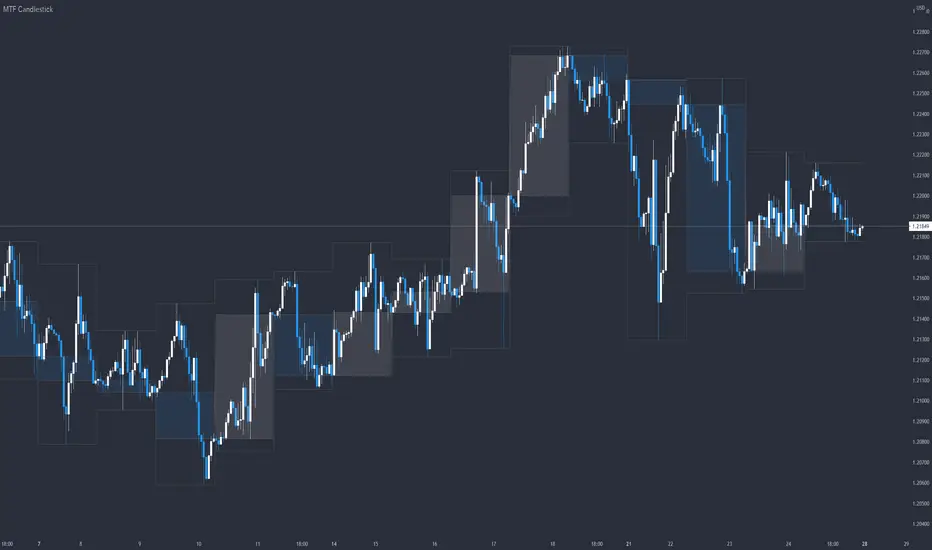
MTF CandlestickOne of the most important thing to understand in order to estimate the trend direction and its continuation is how the lower time frame candlesticks have been formed.
There are many processes by which candlesticks have been formed even if same size.
So in this script, daily candlestick is overlapped on the currently chart as default, and that can be changed.
Only real body is shown so as not to interfere with the currently chart.
Large Candle HighlightHighlights candles whose range exceeds a specified threshold by shading the chart background.
This indicator is designed to visually identify unusually large price movements without generating trade signals.
キャンドルの長さを設定し、数値以上なら背景をハイライトするインジケーターです。

Avg Candle Size (Ticks) – Last N Closed Barsaverage last 5 candles only useful if you are me really sorry

Avg Candle Size Table (Ticks) The average of the last N candles in ticks shown on a table in the top right of the chart
