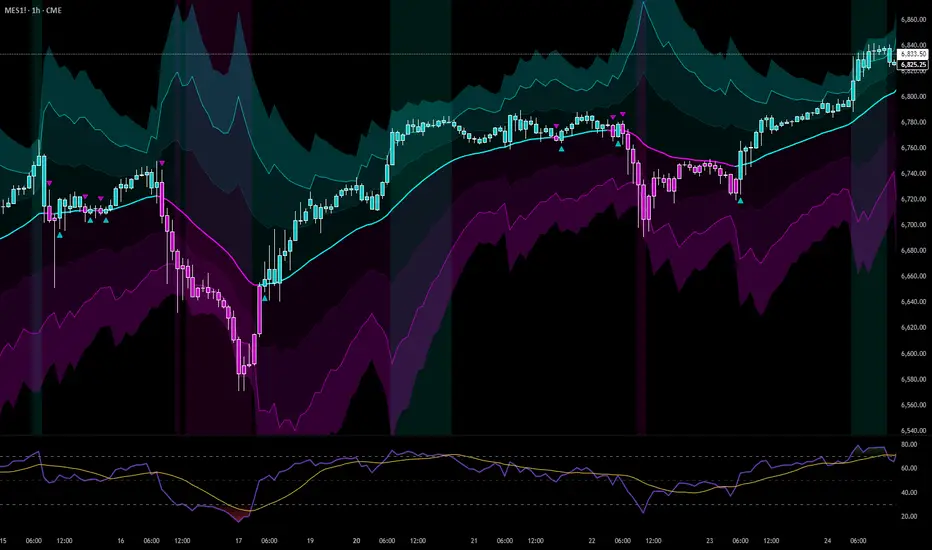
INAZUMA Bollinger BandsThis is an indicator based on the widely used Bollinger Bands, enhanced with a unique feature that visually emphasizes the "strength of the breakout" when the price penetrates the bands.
Main Features and Characteristics
1. Standard Bollinger Bands Display
Center Line (Basis): Simple Moving Average (\text{SMA(20)}).
1 sigma Lines: Light green (+) and red (-) lines for reference.
2 sigma Lines (Upper/Lower Band): The main dark green (+) and red (-) bands.
2. Emphasized Breakout Zones: "INAZUMA / Flare" and "MAGMA"
The key feature is the activation of colored, expanding areas when the candlestick's High or Low breaks significantly outside the \pm 2\sigma bands.
Upper Side (Green Base / Flare):
When the High exceeds the +2\sigma line, a green gradient area expands upwards.
Indication: This visually suggests strong buying pressure or overbought conditions. The color deepens as the price moves further away, indicating higher momentum.
Lower Side (Red Base / Magma):
When the Low falls below the -2 sigma line, a red gradient area expands downwards.
Indication: This visually suggests strong selling pressure or oversold conditions. The color deepens as the price moves further away, indicating higher momentum.
Key Insight: This visual aid helps traders quickly assess the momentum and market excitement when the price moves outside the standard Bollinger Bands range. Use it as a reference for judging trend strength and potential entry/exit points.
Customizable Settings
You can adjust the following parameters in the indicator settings:
Length: The period used for calculating the Moving Average and Standard Deviation. (Default: 20)
StdDev (Standard Deviation): The multiplier for the band width (e.g., 2.0 for -2 sigma). (Default: 2.0)
Source: The price data used for calculation (Default: close).
指標和策略

Gamma & Volatility Levels [Pro]General Purpose
This indicator analyzes volatility levels and expected price movements, combining gamma concepts (financial options) with volatility analysis to identify support and resistance zones.
Main Components
High Volatility Level (HVL): Calculates a volatility level based on the simple moving average (SMA) of the price plus one standard deviation. This level is represented by an orange line showing where volatility is concentrated.
Expected Movement (Movimiento Esperante): Uses the Average True Range (ATR) multiplied by an adjustable factor to project potential upward and downward movement ranges from the current price. It is drawn in green (upward) and red (downward).
Gamma Levels (Nivelas Gamma): Identifies two key levels: the call resistance (highest high of the last 50 periods) in blue, and the put support (lowest low) in purple. These are based on recent extreme prices.
Additional Information: The indicator calculates the percentage distance between the current price and the HVL, displaying it in a label.
Visual Elements
Colored lines on the chart for each level.
Labels with exact values next to each line.
A table in the upper right corner summarizing all calculated values.
Options to show or hide each element according to preference.
This is a useful tool for traders who work with options or seek to identify levels of extreme volatility and dynamic support/resistance zones.

Victor aimstar past strategy -v1Introducing the ultimate all-in-one DIY strategy builder indicator, With over 30+ famous indicators (some with custom configuration/settings) indicators included, you now have the power to mix and match to create your own custom strategy for shorter time or longer time frames depending on your trading style. Say goodbye to cluttered charts and manual/visual confirmation of multiple indicators and hello to endless possibilities with this indicator.
What it does
==================
This indicator basically help users to do 2 things:
1) Strategy Builder
With more than 30 indicators available, you can select any combination you prefer and the indicator will generate buy and sell signals accordingly. Alternative to the time-consuming process of manually confirming signals from multiple indicators! This indicator streamlines the process by automatically printing buy and sell signals based on your chosen combination of indicators. No more staring at the screen for hours on end, simply set up alerts and let the indicator do the work for you.

Nooner's Heikin-Ashi/Bull-Bear CandlesCandles are colored red and green when Heikin-Ashi and Bull/Bear indicator agree. They are colored yellow when they disagree.

ICT Macro Tracker - Study Version (Original by toodegrees)This indicator is a modified study version of the ICT Algorithmic Macro Tracker by toodegrees, based on the original open-source script available at The original indicator plots ICT Macro windows on the chart, corresponding to specific time [ periods when the Interbank Price Delivery Algorithm undergoes checks/instructions (aka "macros") for the price engine to reprice to an area of liquidity or inefficiency.
This study version adds functionality to hide bars outside macro periods. When enabled, the indicator draws boxes that cover the full chart height during non-macro periods, obscuring those bars so only macro periods are visible. This helps focus on macro-only price action. The feature is configurable, allowing users to enable or disable it and customize the box color. All original functionality remains intact.

Resampling Reverse Engineering Bands XRREB X: Visual Oscillator Projection Bands
Based on the innovative "Resampling Reverse Engineering" concept pioneered by Donovan Wall, this enhanced script fixes the core mathematical symmetry and provides anchored, non-repainting bands for reliable analysis.
This indicator transforms any RSI, Stochastic, or CCI calculation directly onto your price chart as dynamic support/resistance bands. Instead of watching an oscillator below your chart, you see its overbought/oversold levels projected as price levels the market must reach.
RREB X reverses standard oscillator formulas to answer one question: "What price must the market reach for my chosen oscillator to hit an extreme level like RSI=70, Stoch=80, or CCI=100?" It then plots these levels as actionable bands.
Key Improvements
Adjustable Oscillator Values - While the original was hard coded the reverse engineered oscillator length which limited its usefulness, this script finally allows you to visualize any length oscillator as dynamic OB/OS regions directly on the chart.
Dynamic OB/OS levels: This version also lets you dynamically adjust the OB/OS levels location, making bands tighter or wider as your strategy demands.
Mathematical Symmetry: Outer bands are perfect mirrors, providing reliable projected levels.
Fixed Anchoring: Bands don't repaint historically, offering stable reference lines.
Direct Price Translation: Oscillator overbought/oversold conditions are visualized as clear price levels.
The Band Calculation Type switch lets you project different oscillator logics, each with unique characteristics for different market conditions.
RRSI - General trend & momentum. Change RSI Period (e.g., 7 for fast, 21 for slow). Adjust OB/OS (e.g., 80/20 for strong trends). The bands show the price needed to push your custom RSI into overbought/oversold territory.
RStoch - Ranging markets & short-term reversals. Focus on the Stochastic Period. The projected bands are highly sensitive to recent highs/lows. Excellent for spotting reversals at the edges of a range.
RCCI - Strong trends & volatile markets. Use a higher Outer Bands Multiplier. CCI's lack of upper/lower bounds means bands reflect extreme momentum shifts. Great for identifying explosive breakout or breakdown levels in trends.
Use Middle Band as Filter: Price above the white middle band suggests a bullish bias for long setups; below suggests bearish for shorts. Same as the 50 midline on the RSI or Stochastic or 0 for CCI.
Customizing the Calculation:
The power lies in changing the oscillator lengths that the bands reflect. Adjust these in the settings:
Change from 14 to 7 for faster, more reactive bands, or to 21 for slower, smoother bands.
Overbought/Oversold: Change from 70/30 to 80/20 for stronger-trend filters, or to 60/40 for more frequent signals.
Trading the Bands:
Bands as Dynamic S/R: The solid cyan (Upper 100) and magenta (Lower 0) bands act as dynamic support and resistance. A touch and reversal can signal a trade.
Gradient as Momentum: The colored fills between bands visually represent the "pressure" needed to reach the next oscillator level.
Middle Band as Trend Filter: Price above the white middle band suggests a bullish bias for long setups; below suggests bearish for short setups.
VWAP Mean Reversion (RSI + Deviation + ATR Risk)33this is an indicator that relies on other indicators. it relies on volume price action fvgs.OBS. and standard deviations.

Multiple Horizontal Lines_SanHorizontal lines can be drawn with given coordinates with defined intervals

Daily Levels [cryptalent]Daily High / Low / Mid / Open Levels is a session-based reference indicator designed to visualize key daily price levels directly on the chart.
This indicator automatically plots the Daily High, Daily Low, Daily Midpoint (High + Low / 2), and Daily Open as horizontal lines for each trading day. These levels help traders quickly identify important structural prices where liquidity, reactions, or acceptance often occur.
Key Features
Automatic Daily Levels
Plots Daily High (H), Low (L), Mid (M), and Open (O) using higher-timeframe daily data.
Levels update in real time as the current day develops.
Multi-Day History
Displays daily levels for a configurable number of past days.
Older levels are automatically removed to keep the chart clean.
Line Extension
Current day levels can be extended forward by a user-defined number of bars.
Useful for projecting intraday reaction zones and liquidity targets.
Visual Customization
Independent line width and color settings for each level.
Mid level is shown as a dashed line for quick visual distinction.
Labels & Price Tags
Optional letter labels (H / L / M / O) displayed near the extended levels.
Optional price labels showing the exact level values on the right side of the chart.
Labels update dynamically and only display for the active trading day.
Performance-Oriented Design
Efficient line and label management using arrays.
Automatically cleans up unused objects to stay within TradingView limits.
Use Cases
Identifying intraday support and resistance
Tracking daily range behavior
Monitoring mean reversion vs. range expansion
Aligning intraday execution with higher-timeframe structure
This indicator is particularly useful for traders who rely on market structure, session behavior, and objective price references rather than subjective trend lines.

Quantum Darvas BoxesQuantum Darvas Boxes - The Modern Evolution
The original Darvas Box methodology, conceived by Nicolas Darvas in the 1950s, revolutionized breakout trading by identifying consolidation phases as "boxes." However, modern markets move with algorithmic speed and fractal volatility that often trigger false breakouts. Quantum Darvas Boxes were designed not as a nostalgic tribute, but as a computational upgrade. By anchoring boxes to volatility-adjusted boundaries rather than raw highs/lows, and introducing adaptive stability mechanisms, this indicator transforms a classic discretionary tool into a systematic, noise-filtered engine.
Description & Improvements
Quantum Darvas Boxes solve the three fatal flaws of the original: false breakouts, arbitrary box sizing, and lack of confirmation. Instead of drawing boxes at exact recent highs/lows, it creates volatility-buffered boundaries using ATR, ensuring breakouts require meaningful momentum. The boxes remain anchored until a confirmed close beyond the buffer occurs, preventing the constant redrawing that plagued traditional Darvas implementations. Built-in volume and RSI filters add discretionary-grade confirmation to pure price action. Visually, the system presents as a stable, semi-transparent blue zone between red (resistance) and lime (support) lines, with clear triangle signals appearing only on validated breakouts.
How It's Based on Darvas
The core philosophy remains true to Darvas' 1950s methodology:
Identify Consolidation: Finds price ranges where the market consolidates
Draw Box: Creates a "box" representing the accumulation zone
Breakout Trading: Enters when price breaks out of the box with momentum
Volatility-Adjusted Boundaries
Original: Boxes at exact highs/lows → prone to false breakouts
QDB: Boxes set at High - (ATR × Multiplier) and Low + (ATR × Multiplier)
→ Breakouts require meaningful momentum, not just price tags
→ Adapts to different volatility regimes
Signal Logic:
Long: Close above box top, previous close was inside box
Short: Close below box bottom, previous close was inside box
Ideal Settings:
For daily charts, use lookback=13 and mult=2.4.
For intraday (1H-4H), reduce to lookback=8 and mult=1.8. Enable volume filter in trending markets and RSI filter in ranging conditions.
Trade Execution: Enter long on the green triangle below the bar following a close above the red top line; enter short on the red triangle above the bar after a close below the lime bottom line. The background glow provides immediate visual confirmation.
Risk Management: Set stops at the opposite box boundary. The volatility multiplier inherently calculates a risk buffer—larger multipliers create wider, higher-conviction boxes; smaller multipliers produce more frequent, sensitive signals. This system excels in trending markets and provides clear exit/reversal points, transforming Darvas's original speculation into a quantified, repeatable edge.

VWAP Mean Reversion v2 nice indicator based on volume and price action. it pays attention to RSI ema.VWAP. and many more indicators

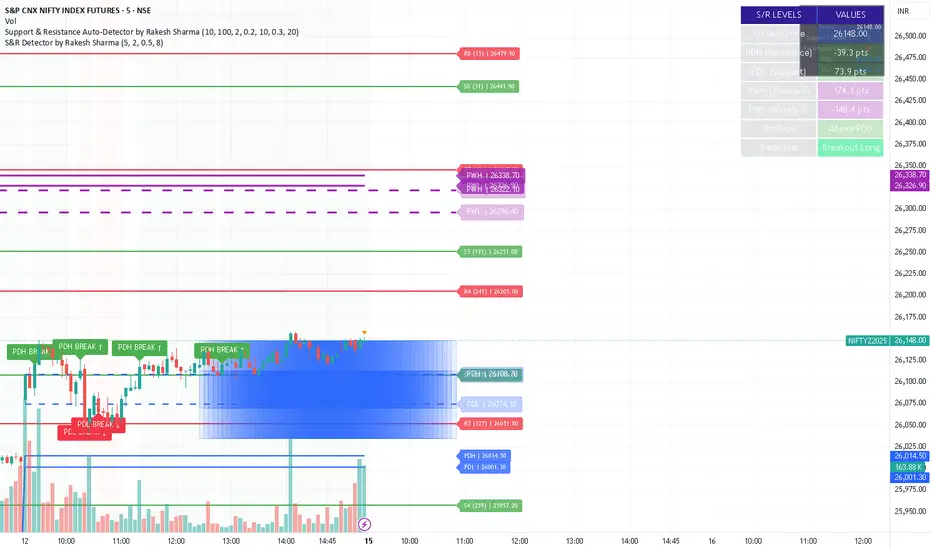
S&R Detector by Rakesh Sharma📊 Support & Resistance Auto-Detector
Automatically identifies key Support and Resistance levels with strength ratings
✨ Key Features:
🎯 Intelligent S/R Detection
Automatically finds Support and Resistance levels based on swing highs/lows
Shows strength rating (Very Strong, Strong, Medium, Weak)
Displays number of touches at each level
📅 Key Time-Based Levels
Previous Day High/Low (PDH/PDL) - Blue lines
Previous Week High/Low (PWH/PWL) - Purple lines
Optional Round Numbers for psychological levels
⚙️ Fully Customizable
Adjust sensitivity (5-20 pivot length)
Filter by minimum touches (1-10)
Control maximum levels displayed (3-20)
Optional S/R zones (shaded areas)
📊 Live Dashboard
Shows nearest Support/Resistance
Distance to key levels
Total S/R levels detected
🔔 Smart Alerts
PDH/PDL breakout signals
Visual markers on chart
Perfect for: Intraday traders, Swing traders, Price action analysis


Take Profit XTake Profit X
Take Profit X solves the #1 problem in trading: knowing when to exit. Instead of guessing or using single indicators, it aggregates 8 technical signals to identify high-probability exit points through multi-confirmation consensus. This eliminates premature exits and emotional decision-making.
The indicator counts confirmations from your chosen technical tools:
Green dot = Multiple signals say "take profit on longs/exit shorts"
Red dot = Multiple signals say "take profit on shorts/exit longs"
Signals appear when you reach the minimum confirmations threshold you set.
Possible Settings:
Conservative (Swing Trading)
pine
Minimum Confirmations: 4
Use: RSI, MACD, CCI, Supertrend, Price Action
Disable: Stochastic, Bollinger Bands, EMA Cross
Look Back Bars: 10
Aggressive (Day Trading)
pine
Minimum Confirmations: 2
Use: All indicators ON
Look Back Bars: 3-5
RSI OB/OS: 75/25
Balanced (Most Markets)
pine
Minimum Confirmations: 3
Use: RSI, MACD, CCI, Supertrend
Price Action: ON
Look Back Bars: 5-7

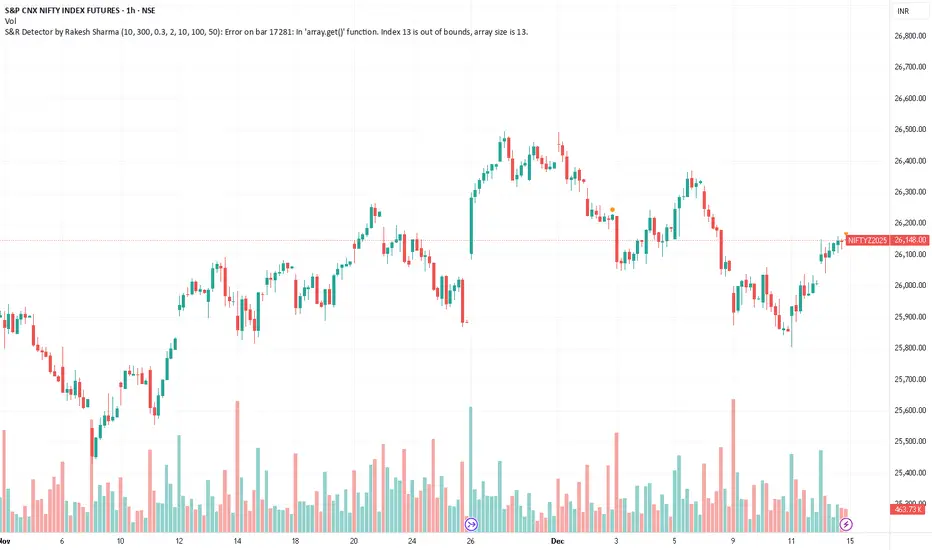
S&R Detector by Rakesh SharmaSupport & Resistance Auto-Detector
Automatically identifies key Support and Resistance levels with strength ratings
✨ Key Features:
🎯 Intelligent S/R Detection
Automatically finds Support and Resistance levels based on swing highs/lows
Shows strength rating (Very Strong, Strong, Medium, Weak)
Displays number of touches at each level
📅 Key Time-Based Levels
Previous Day High/Low (PDH/PDL) - Blue lines
Previous Week High/Low (PWH/PWL) - Purple lines
Optional Round Numbers for psychological levels
⚙️ Fully Customizable
Adjust sensitivity (5-20 pivot length)
Filter by minimum touches (1-10)
Control maximum levels displayed (3-20)
Optional S/R zones (shaded areas)
📊 Live Dashboard
Shows nearest Support/Resistance
Distance to key levels
Total S/R levels detected
🔔 Smart Alerts
PDH/PDL breakout signals
Visual markers on chart
Perfect for: Intraday traders, Swing traders, Price action analysis
S&R Detector by Rakesh Sharma📊 Support & Resistance Auto-Detector
Automatically identifies key Support and Resistance levels with strength ratings
✨ Key Features:
🎯 Intelligent S/R Detection
Automatically finds Support and Resistance levels based on swing highs/lows
Shows strength rating (Very Strong, Strong, Medium, Weak)
Displays number of touches at each level
📅 Key Time-Based Levels
Previous Day High/Low (PDH/PDL) - Blue lines
Previous Week High/Low (PWH/PWL) - Purple lines
Optional Round Numbers for psychological levels
⚙️ Fully Customizable
Adjust sensitivity (5-20 pivot length)
Filter by minimum touches (1-10)
Control maximum levels displayed (3-20)
Optional S/R zones (shaded areas)
📊 Live Dashboard
Shows nearest Support/Resistance
Distance to key levels
Total S/R levels detected
🔔 Smart Alerts
PDH/PDL breakout signals
Visual markers on chart
Perfect for: Intraday traders, Swing traders, Price action analysis

Ultimate Adaptive RSIUltimate Adaptive RSI
RSI That Adapts to Any Market
This isn't your grandpa's RSI. It dynamically adjusts its sensitivity based on market conditions—smoother in trends, responsive in ranges.
Traditional RSI fails in strong trends and changing volatility. UA-RSI fixes both by adapting its sensitivity in real-time, giving you reliable signals whether the market is trending, ranging, or transitioning between regimes.
How It Adapts:
Smart Pre-Smoothing: Uses Efficiency Ratio to detect trend strength and automatically lengthens/shortens its smoothing window.
Dominant Cycle Detection: Matches its internal period to the market's actual rhythm.
Dynamic Bands: RMS-based overbought/oversold levels that expand/contract with volatility.
Smoothing Stack: ALMA pre-smoothing → Ultimate Smoother → Jurik filter creates the cleanest RSI you've ever seen.
Trade Signals:
Buy: RSI crosses above lower band or midline + price confirms
Sell: RSI crosses below upper band or midline + price confirms
Bands expand in high volatility → wait for deeper extremes
Bands contract in low volatility → take earlier signals
Signal line for crossover entries
Adaptive smoothing = fewer false signals in trends
Day trading: Use 1.0 band multiplier
Swing trading: Use 1.2-1.5 multiplier
Ranging markets: Lower multiplier to 0.8
Trending markets: Raise multiplier to 1.5+
Bands widen in volatility = wait for deeper extremes
Bands tighten in calm markets = take earlier signals
Never trade RSI alone - always wait for price confirmation

S&R Detector by Rakesh SharmaSupport & Resistance Auto-Detector
Automatically identifies key Support and Resistance levels with strength ratings
✨ Key Features:
🎯 Intelligent S/R Detection
Automatically finds Support and Resistance levels based on swing highs/lows
Shows strength rating (Very Strong, Strong, Medium, Weak)
Displays number of touches at each level
📅 Key Time-Based Levels
Previous Day High/Low (PDH/PDL) - Blue lines
Previous Week High/Low (PWH/PWL) - Purple lines
Optional Round Numbers for psychological levels
⚙️ Fully Customizable
Adjust sensitivity (5-20 pivot length)
Filter by minimum touches (1-10)
Control maximum levels displayed (3-20)
Optional S/R zones (shaded areas)
📊 Live Dashboard
Shows nearest Support/Resistance
Distance to key levels
Total S/R levels detected
🔔 Smart Alerts
PDH/PDL breakout signals
Visual markers on chart
Perfect for: Intraday traders, Swing traders, Price action analysis

Ultimate Reversion BandsURB – The Smart Reversion Tool
URB Final filters out false breakouts using a real retest mechanism that most indicators miss. Instead of chasing wicks that fail immediately, it waits for price to confirm rejection by retesting the inner band—proving sellers/buyers are truly exhausted.
Eliminates fakeouts – The retest filter catches only genuine reversions
Triple confirmation – Wick + retest + optional volume/RSI filters
Clear visuals – Outer bands show extremes, inner bands show retest zones
Works on any timeframe – From scalping to swing trading
Perfect for traders tired of getting stopped out by false breakouts.
Core Construction:
Smart Dynamic Bands:
Basis = Weighted hybrid EMA of HLC3, SMA, and WMA
Outer Bands = Basis ± (ATR × Multiplier)
Inner Bands = Basis ± (ATR × Multiplier × 0.5) → The "retest zone"
The Unique Filter: The Real Retest
Step 1: Identify an extreme wick touching the outer band
Step 2: Wait 1-3 bars for price to return and touch the inner band
Why it works: Most false breakouts never retest. A genuine reversal shows seller/buyer exhaustion by allowing price to come back to the "halfway" level.
Optional Confirmations:
Volume surge filter (default ON)
RSI extremes filter (optional)
Each can be toggled ON/OFF
How to Use:
Watch for extreme wicks touching the red/lime outer bands
Wait for the retest – price must return to touch the inner band (dotted line) within 3 bars
Enter on confirmation with built-in volume/RSI filters
Set stops beyond the extreme wick

Capitulation Detector StrategyA multi-factor capitulation detector designed to identify exhaustion points in extended trends. It focuses on fading capitulation moves after multi-leg trends with extreme volume and price extension.
━━━━━━━━━━━━━━━━━━━━━━━━━━━━━━━━━━━━━━━━
THE CONCEPT
Capitulation occurs when the last holders give up — panic selling into lows or euphoric buying into highs. These moments create asymmetric opportunities because:
Sentiment becomes maximally skewed
Weak hands are flushed out
Price deviates far from equilibrium
The "fuel" for continuation is exhausted
━━━━━━━━━━━━━━━━━━━━━━━━━━━━━━━━━━━━━━━━
THE 6 FACTORS
Trend Persistence — Price stays on one side of 38 EMA for 12+ bars, confirming a sustained directional move
Acceleration — Price stays on one side of 5 EMA for 3+ bars, showing the move is accelerating into exhaustion
Volume Spike — Current bar volume ≥ 2x the 20-bar average
Body Expansion — Candle body ≥ 1.5x average, showing conviction/panic in the move
Extension — Price is 2+ ATR away from the 38 EMA, indicating overextension from equilibrium
Multi-Leg Structure — At least 3 consecutive lower lows (for longs) or higher highs (for shorts)
━━━━━━━━━━━━━━━━━━━━━━━━━━━━━━━━━━━━━━━━
SIGNAL LOGIC
Bullish Capitulation: 4+ factors align + price below 38 EMA + down candle + volume spike
Bearish Capitulation: 4+ factors align + price above 38 EMA + up candle + volume spike
The strategy enters counter-trend, fading the exhaustion move.
━━━━━━━━━━━━━━━━━━━━━━━━━━━━━━━━━━━━━━━━
EXIT OPTIONS
ATR-based stop loss (default: 2 ATR)
ATR-based take profit (default: 3 ATR)
Optional trailing stop
Time filter for session-specific trading
━━━━━━━━━━━━━━━━━━━━━━━━━━━━━━━━━━━━━━━━
BEST PRACTICES
Works best on liquid instruments with clean trends
More reliable after 3+ legs in the trend
Higher conviction when daily AND intraday timeframes align
"The bigger and more extended, the better"
Consider VWAP as additional confirmation (not coded here)
━━━━━━━━━━━━━━━━━━━━━━━━━━━━━━━━━━━━━━━━
SETTINGS GUIDE
Min Score: Increase for fewer, higher-quality signals
Volume Spike Multiplier: 2x; increase for stricter filter
Extension ATR: Higher values = more overextended setups only
Trend Bars Min: Higher values = longer established trends required
━━━━━━━━━━━━━━━━━━━━━━━━━━━━━━━━━━━━━━━━
ALERTS
Bullish Capitulation (potential long)
Bearish Capitulation (potential short)
━━━━━━━━━━━━━━━━━━━━━━━━━━━━━━━━━━━━━━━━
DISCLAIMER
This is a counter-trend strategy — inherently higher risk than trend-following. Always use proper position sizing and risk management. Backtest thoroughly on your specific instruments and timeframes.

VixTrixVixTrix - Because markets move in both directions.
VixTrix was born from a fundamental limitation in traditional volatility indicators: they only measure downside panic, completely missing the greed-driven extremes that form market tops.
How It Works:
Dual-Component Analysis:
vixBear = Panic selling intensity (distance from recent highs)
vixBull = FOMO buying intensity (distance from recent lows)
Oscillator = vixBear - vixBull = Net fear/greed imbalance
When the oscillator is positive, fear dominates (potential bottom forming). When negative, greed dominates (potential top forming).
Professional-Grade Filtering:
The magic happens with the symmetric RMS (Root Mean Square) bands. Unlike fixed percentage bands or standard deviation, RMS:
Creates mathematically symmetric positive/negative thresholds
Naturally adapts to changing volatility regimes
Provides statistical significance to extremes
VixTrix also adds selectable MA smoothing for the RMS calculation:
WMA (default): Balanced – middle-ground approach
VWMA: Volume-weighted – filters low-volume noise
EMA: Responsive – catches quick reversals
SMA: Stable – for swing trading
HMA: Fast and smooth – ideal for day trading
Signals require triple confirmation:
Statistical Extreme: Oscillator beyond RMS band
Price Action Confirmation: Correct candle color (bullish for bottoms, bearish for tops)
Momentum Continuation: Oscillator still moving toward extreme (exhaustion)
This multi-filter approach reduces premature entries and false signals while maintaining early positioning at potential reversal points.
Why This Matters for Your Trading:
In bull markets, traditional fear indicators sit near zero, giving no warning of impending tops.
VixTrix identifies when greed becomes excessive – when FOMO buying reaches statistical extremes that often precede corrections.
In range-bound markets, VixTrix excels at identifying overreactions in both directions, providing high-probability mean reversion opportunities.
During crashes, it captures the panic selling with the same precision as VixFix, but with better timing through its momentum confirmation.
VixTrix spots continuations through:
"No Signal" = Healthy Trend – Oscillator stays between RMS bands (no exhaustion)
Failed Extremes – Touches band but no triple confirmation = trend likely continues
Hidden Divergence – Price makes higher low while oscillator makes shallower low = uptrend continues
Controlled Emotions – Oscillator negative but not extreme in uptrends (greed present but not excessive)
Key Insight: When VixTrix doesn't give a signal during a pullback, institutions aren't panicking – they're just pausing before resuming the trend.
Green columns = Bullish exhaustion (potential bottoms)
Red columns = Bearish exhaustion (potential tops)
Golden RMS bands = Dynamic thresholds adapting to current volatility
Background highlights = Active signal conditions
The Result: A professional-grade oscillator that works in all market conditions – trending up, trending down, or ranging – by measuring the complete emotional spectrum driving price action.

Slope Failure (Momentum Stall) STRATEGY//======================================================================================
// SLOPE FAILURE (MOMENTUM STALL) STRATEGY
//--------------------------------------------------------------------------------------
// WHAT THIS STRATEGY DOES
// -----------------------
// This strategy trades **momentum failure**, not trend direction.
//
// Instead of predicting where price will go, it detects when **momentum can no longer
// continue in its current direction** and briefly fades that failure.
//
// Core idea:
// - Momentum expands → slope grows
// - Momentum stalls → slope collapses or flips
// - That stall represents **state transition**, not noise
//
// The system exploits these transitions repeatedly at short horizons.
//
//--------------------------------------------------------------------------------------
// HOW MOMENTUM IS MEASURED
// ------------------------
// 1. Source price (optionally smoothed)
// 2. First derivative (slope = price - price )
// 3. Optional smoothing of the slope itself
//
// The slope represents **instantaneous directional force**, not trend bias.
//
//--------------------------------------------------------------------------------------
// ENTRY LOGIC (SLOPE FAILURE)
// ---------------------------
// • Bull Slope Failure (SHORT):
// - Prior slope was sufficiently positive
// - Current slope collapses to zero or below
// → Upward momentum failed → enter SHORT
//
// • Bear Slope Failure (LONG):
// - Prior slope was sufficiently negative
// - Current slope rises to zero or above
// → Downward momentum failed → enter LONG
//
// Optional:
// - Minimum slope band can be enforced to avoid weak/noisy failures
//
//--------------------------------------------------------------------------------------
// EXIT LOGIC
// ----------
// Primary exits are **force-based**, not price-based:
//
// • Longest Slope Local Turn (optional):
// - Detects when the strongest slope in a recent window has occurred
// - Exits when momentum starts decaying from that extreme
//
// • Percent Stop Loss (optional):
// - Fixed % protection relative to entry price
//
// The strategy does NOT rely on profit targets.
// Winners are exited when **momentum decays**, not when price "looks good".
//
//--------------------------------------------------------------------------------------
// POSITION SIZING
// ---------------
// This strategy supports **percent-of-equity sizing**, computed dynamically:
//
// position size = (account equity × % allocation) / price
//
// This allows:
// - P&L to scale smoothly
// - Drawdowns to remain proportional
// - The same logic to work across symbols and account sizes
//
//--------------------------------------------------------------------------------------
// STRATEGY CHARACTERISTICS
// ------------------------
// • High trade count
// • Win rate near ~45–50%
// • Small, fast losers
// • Slightly larger winners
// • Very low drawdown
//
// This profile is intentionally designed for **scalability**, not prediction.
//
//--------------------------------------------------------------------------------------
// IMPORTANT NOTES
// ---------------
// • This is NOT a trend-following strategy
// • This is NOT a mean-reversion guess
// • This is a momentum **state-transition detector**
//
// The edge comes from structure + exits + sizing — not indicators.
//
//======================================================================================
