Pious 3/8 EMA High-Low + 89 EMA Strategybuy signal when 3emah cross above 8emah, 3emal cross above 8emal,high cross above previous 3 high with volume and vice versa
指標和策略

Evergito HH/LL 3 Señales + ATR SLHow to trade with the Evergito HH/LL 3 Signals + ATR SL indicator? Brief and direct explanation: General system logic: The indicator looks for actual breakouts of the high/low of the last 20 bars (HH/LL) and combines them with the position relative to the 200 SMA to filter the underlying trend. You have 3 types of signals that you can activate/deactivate separately: Signal
When it appears
What it means in practice
Entry type
V1
HH breakout + the close crosses above the 200 SMA (or the opposite in a short position)
Very safe entry confirmed. The price has just validated the long/flat trend → safer and with a better ratio
The most reliable (the original)
V2
HH breakout but the price was already above the 200 SMA (or already below in a short position)
Entry in an already established trend. Fewer “surprises”, more continuity
Ideal for strong trends
V3
Only the breakout of the HH or LL, without looking at the 200 SMA
Aggressive entry/scalping on explosive breakouts. More signals, more noise.
For times of high volatility.
How to enter the market (simple rule): Wait for any of the 3 labels (V1, V2, or V3) to appear, depending on which ones you have activated.
Enter at the close of that candle (or at the open of the next one if you are conservative).
Automatic Stop Loss → the blue (long) or yellow (short) line that represents the ATR x2.
Take Profit → you decide, but the indicator already gives you the visual reference for the risk (ATR x2), so 1:2 or 1:3 is usually very convenient.
Practical example: You see a large green label “HH LONG V1” → you go long at the close of that candle. Stop right at the blue line (ATR x2 below the price).
Typical target: 2x or 3x the risk (very common to reach it in a trend).
Recommended use: Most traders leave only V1 activated → fewer signals but very high quality.
Those who trade intraday or crypto usually combine V1 + V2.
V3 only for news events or very volatile openings.
In summary:
Label = immediate entry
Blue/yellow line = automatic stop
And enjoy the move.

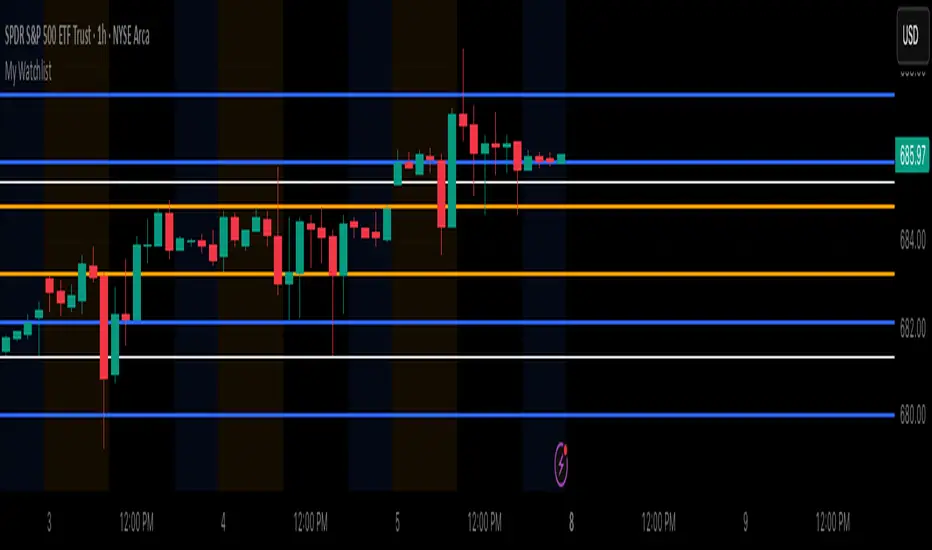
My WatchlistUse Case
Do you belong to a group of traders that post key levels based on their technical analysis to be utilized for trading opportunities? The goal of this indicator is to reduce your daily prep time by allowing you to paste in the actual level values instead of trying to manually create each of the horizontal lines.
How it works
Simply enter the values of the key levels for the tickers that you would like to plot horizontal lines for. If you don't want to plot a level just leave the value as zero and it will be ignored.
Settings
You can enable/disable any of the levels
You can change the colors of the levels
You can add Previous Day High and Previous Day Low levels to the chart
N-Consecutive Candle Marker (SMA Filter & Consolidated Alert)Certainly, here is the English version of the Pine Script description for posting on TradingView.
---
## 📈 N-Consecutive Candle Marker (SMA Filter & Consolidated Alert)
### 📝 Overview
This indicator automatically displays a **signal mark** on the chart when a user-defined number ($N$) of **consecutive bullish or bearish candles** occurs.
It includes an optional **SMA (Simple Moving Average) filter** to restrict signals to conditions favoring a **short-term counter-trend (reversal) trade**. It also consolidates both bullish and bearish signals into a **single alert mechanism** for simplified management.
### ⚙️ Key Features
#### 1. N-Consecutive Candle Detection
* **Consecutive Count (N)**: The indicator detects continuous candles of the same color based on the `Consecutive Candle Count (N)` input setting.
* **Bullish Signal (Red Marker)**: A mark is placed above the high of the closing candle after the bullish sequence is complete.
* **Bearish Signal (Blue Marker)**: A mark is placed below the low of the closing candle after the bearish sequence is complete.
#### 2. SMA Filter (Counter-Trend Logic)
When **`Use SMA Filter`** is enabled, the signal conditions are filtered against the SMA, which focuses on potential **short-term bounces or pullbacks** against the broader trend.
* **Bullish Signal Condition**: The consecutive bullish candles must close **below** the SMA (`close < sma_value`). This typically targets a bounce in a downtrend.
* **Bearish Signal Condition**: The consecutive bearish candles must close **above** the SMA (`close > sma_value`). This typically targets a pullback/dip in an uptrend.
#### 3. Performance & Alert Consolidation
* **Display Limit**: Enabling **`Use Display Limit`** restricts the plotted marks to the **last N bars** defined by `Limit Display to Last N Bars`. This automatically deletes old labels, helping to **maintain chart performance**.
* **Consolidated Alert**: Both bullish and bearish signals trigger the same **single `alert()` function**, simplifying the process of setting up notifications in TradingView.
### 💡 How to Use
1. Add the indicator to your chart.
2. Set the **`Consecutive Candle Count (N)`** to your desired number of consecutive bars (e.g., 3, 4, etc.).
3. If you want to use the reversal filter, switch **`Use SMA Filter (On/Off)`** to **On**. Adjust the `SMA Period` as needed.
4. In the TradingView alert creation menu, select this indicator and choose **"Any function call"** or **"N-Consecutive Candle Marker (SMA Filter & Consolidated Alert)"** to set up your consolidated alert.
> ⚠️ **Disclaimer**: This indicator detects specific candle patterns. Always combine this signal with other forms of technical analysis and context for making trading decisions.
ご要望いただいたTradingViewに投稿する際のインジケーターの説明文として、機能、使い方、フィルターロジックに焦点を当てた文章を作成しました。
この説明文は、Pine Scriptの公開ライブラリの投稿テンプレートに合わせて、**概要、使い方、主要機能**を明確に伝える構造にしています。
---
## 📈 N-Consecutive Candle Marker (SMA Filter & Consolidated Alert)
### 📝 概要 (Overview)
このインジケーターは、設定した本数($N$)の**連続した陽線または陰線**が出現した際に、チャート上に**サイン(マーク)**を自動で表示します。
オプションで**SMA(単純移動平均線)フィルター**を適用することができ、トレンドの状況に応じた**短期的な逆張りサイン**に限定することが可能です。また、陽線サインと陰線サインを**一つのアラート**で統合して通知できるため、管理が容易です。
### ⚙️ 主要機能 (Key Features)
#### 1. N連続ローソク足の検出
* **連続本数の設定 (N)**: `Consecutive Candle Count (N)` の設定値に基づき、連続した同色ローソク足を検出します。
* **陽線サイン (Red Marker)**: 連続陽線が完了した足の高値の上にマークを表示します。
* **陰線サイン (Blue Marker)**: 連続陰線が完了した足の安値の下にマークを表示します。
#### 2. SMAフィルター (逆張りロジック)
`Use SMA Filter` を **オン** にすることで、サインの出現条件にトレンドフィルターを追加します。これは、トレンド方向に対する**一時的な反発・押し目**を狙う、**逆張り的なロジック**を採用しています。
* **陽線サインの出現条件**: 終値がSMAの**下**にある状態で、連続陽線が出現した場合。
* **陰線サインの出現条件**: 終値がSMAの**上**にある状態で、連続陰線が出現した場合。
#### 3. パフォーマンス最適化とアラート統合
* **表示制限**: `Use Display Limit` をオンにすると、描画されるマークの数を**直近のN本**に制限し、古いマークを自動で削除することで、チャート描画の**パフォーマンスを維持**します。
* **統合アラート**: 陽線・陰線どちらのサインが出た場合でも、**単一の `alert()` 関数**でメッセージを出し分けます。これにより、アラート設定をシンプルに保てます。
### 💡 使い方 (How to Use)
1. インジケーターをチャートに追加します。
2. **`Consecutive Candle Count (N)`** を希望する連続本数に設定します(例: 3本連続、4本連続など)。
3. トレンドフィルターを使用したい場合は、**`Use SMA Filter (On/Off)`** をオンに切り替えます。
4. TradingViewのアラート設定画面で、このインジケーターを選択し、**「どんな関数呼び出しでも」**または**「N-Consecutive Candle Marker (SMA Filter & Consolidated Alert)」**を選んでアラートを設定してください。
> ⚠️ **注意点**: このインジケーターは、連続足という特定のパターンのみを検出するものです。トレード判断を行う際は、他のテクニカル分析や環境認識と組み合わせてご利用ください。

Daily Dollar Cost Averaging (DCA) Simulator & Yearly PerformanceThis indicator simulates a "Daily Dollar Cost Averaging" strategy directly on your chart. Unlike standard backtesters that trade based on signals, this script calculates the performance of a portfolio where a fixed dollar amount is invested every single day, regardless of price action.
Key Features:
Daily Accumulation: Simulates buying a specific dollar amount (e.g., $10) at the market close every day.
Yearly Breakdown Table: A detailed dashboard displayed on the chart that breaks down performance by year. It tracks total invested, average entry price, total holdings, current value, and PnL percentage for each individual year.
Global Stats: The bottom row of the table summarizes the total performance of the entire strategy since the start date.
Breakeven Line: Plots a yellow line on the chart representing your "Global Average Price." When the current price is above this line, the total strategy is in profit.
How to Use:
Add to chart (Works best on the Daily (D) timeframe).
Open settings to adjust your Daily Investment Amount and Start Year.
The table will automatically update to show how a daily investment strategy would have performed over time.

Bubbles + Clusters + SweepsIndicator For Bubbles + Clusters + Sweeps
✔ Volume bubbles
✔ Delta coloring (green/red intensity)
✔ Auto supply/demand zones
✔ Volume-profile style blocks inside zones
✔ Liquidity sweep markers
✔ Box drawings extending until filled
✔ Optional bubble filters (min-volume threshold)

Compression / ExpansionI created this Indicator to warn of compression and expansion so I could find the best area to trade I use it In conjunction with VWAP works on any timeframe and any asset where there is Volume
The Indicator produces a Letter C at the Start of Compression and a Letter E at the Start of Expansion you can change the settings to your liking On the chart my Expansion is in Red and compression is is Blue use In Conjunction with your favorite Indicators for Confluence

MACD Zero-Line Dominance (no ta.sum)Description Option 1 (Simple & Clear)
“This indicator compares how many recent bars have the MACD line above the zero line versus below it.
It plots the resulting strength as a green/red histogram showing whether bullish or bearish momentum is dominating.”
“MACD Zero-Line Dominance measures the strength balance between bullish and bearish momentum by counting how many candles in a lookback period have MACD above or below the zero line.
The histogram turns green when bullish pressure dominates and red when bearish momentum takes control.
Useful for trend confirmation, regime detection, and higher-timeframe alignment.”

Liquidity Sweep Indicator (Signal-based SL + BE/TP)I created a more advanced version of my Liquidity Sweep Indicator. Open source, but I dont recommend to create a TV-strategy from the code because you should combine it with price action an chart analysis! Have fun :)

NeuroSwarm ETH — Crowd vs Experts Forecast TrackerEnglish:
NeuroSwarm — Crowd vs Experts Forecast Tracker (ETH)
This indicator visualizes monthly forecast data collected from two independent groups:
Crowd – a large sample of retail participants
Experts – a curated group of analysts and experienced market participants
For each month, the indicator plots the following values as horizontal levels on the price chart:
Median forecast (Crowd)
Average forecast (Crowd)
Median forecast (Experts)
Average forecast (Experts)
Shaded zones highlighting the difference between median and mean
All values are fixed for each month and stay unchanged historically.
This allows traders to analyze sentiment dynamics and compare how expectations from both groups align or diverge from actual price action.
Purpose:
This tool is intended for sentiment visualization and analytical insight — it does not generate trading signals.
Its main goal is to compare collective expectations of retail traders vs experts across time.
Data source:
All forecasts come from monthly surveys conducted within the NeuroSwarm project between the 1st and 5th day of each month.
Interface notice:
The script's UI may contain non-English labels for convenience, but a full English documentation is provided here in compliance with TradingView rules.
Русская версия:
NeuroSwarm — Мудрость Толпы vs Эксперты (ETH)
Индикатор отображает ежемесячные прогнозы двух групп:
Толпа: медиана и средняя прогнозов
Эксперты: медиана и средняя прогнозов
Значения фиксируются для каждого месяца и показываются горизонтальными уровнями.
Заливка отображает диапазон между медианой и средней, что упрощает визуальное сравнение настроений.
Это аналитический инструмент для визуализации настроений — не торговая стратегия.
Все данные берутся из ежемесячных опросов проекта NeuroSwarm.

NeuroSwarm BTC — Crowd vs Experts Forecast TrackerEnglish:
NeuroSwarm — Crowd vs Experts Forecast Tracker (BTC)
This indicator visualizes monthly forecasts collected from two independent groups:
Crowd – a large sample of retail traders
Experts – a smaller, curated group of analysts and experienced market participants
For each month, the following values are displayed as horizontal levels on the chart:
Median forecast of the Crowd
Average forecast of the Crowd
Median forecast of Experts
Average forecast of Experts
Shaded zones showing the range between median and mean
The values remain fixed throughout each month. This allows traders to compare sentiment dynamics between groups and see how expectations evolve relative to actual market movement.
Purpose:
This indicator is designed for sentiment analysis — NOT for generating trading signals.
It helps identify divergences between retail expectations and expert forecasts, which can be informative during trend transitions.
Data source:
All values come from monthly surveys conducted within the NeuroSwarm project (1–5 of every month).
Crowd and Expert groups are collected separately to avoid bias and to preserve independent aggregation.
Interface language note:
The indicator’s interface may contain non-English labels for ease of use, but full English documentation is provided here in compliance with TradingView House Rules.
Русская версия (optional, allowed only AFTER English):
NeuroSwarm — Мудрость Толпы vs Эксперты (BTC)
Индикатор показывает ежемесячные прогнозы двух групп:
Толпа: медиана и средняя прогнозов
Эксперты: медиана и средняя прогнозов
Значения фиксируются на весь месяц и отображаются на графике горизонтальными уровнями.
Заливка показывает диапазон между медианой и средней.
Цель индикатора — визуализировать настроение толпы и экспертов и сравнить его с реальным движением цены.
Это аналитический инструмент, а не торговая стратегия.
Данные берутся из ежемесячных опросов (1–5 числа), проводимых в рамках проекта NeuroSwarm.


Minho Index | SETUP (Safe Filter 90%)//@version=5
indicator("Minho Index | SETUP (Safe Filter 90%)", shorttitle="Minho Index | SETUP+", overlay=false)
//--------------------------------------------------------
// ⚙️ INPUTS
//--------------------------------------------------------
bullColor = input.color(color.new(color.lime, 0), "Bull Color (Minho Green)")
bearColor = input.color(color.new(color.red, 0), "Bear Color (Red)")
neutralColor = input.color(color.new(color.white, 0), "Neutral Color (White)")
lineWidth = input.int(2, "Line Width")
period = input.int(14, "RSI Period")
centerLine = input.float(50.0, "Central Line (Fixed at 50)")
//--------------------------------------------------------
// 🧠 BASE RSI + INTERNAL SMOOTHING
//--------------------------------------------------------
rsiBase = ta.rsi(close, period)
rsiSmooth = ta.sma(rsiBase, 3) // light smoothing
//--------------------------------------------------------
// 🔍 TREND DETECTION AND NEUTRAL ZONE
//--------------------------------------------------------
trendUp = (rsiSmooth > rsiSmooth ) and (rsiSmooth > rsiSmooth )
trendDown = (rsiSmooth < rsiSmooth ) and (rsiSmooth < rsiSmooth )
slopeUp = (rsiSmooth > rsiSmooth )
slopeDown = (rsiSmooth < rsiSmooth )
lineColor = neutralColor
if trendUp
lineColor := bullColor
else if trendDown
lineColor := bearColor
else if slopeUp or slopeDown
lineColor := neutralColor
//--------------------------------------------------------
// 📈 MAIN INDEX LINE
//--------------------------------------------------------
plot(rsiSmooth, title="Dynamic RSI Line (Safe Filter)", color=lineColor, linewidth=lineWidth)
//--------------------------------------------------------
// ⚪ FIXED CENTRAL LINE
//--------------------------------------------------------
plot(centerLine, title="Central Line (Highlight)", color=neutralColor, linewidth=1)
//--------------------------------------------------------
// 📊 NORMALIZED MOVING AVERAGES (SMA20 and EMA20)
//--------------------------------------------------------
SMA20 = ta.sma(close, 20)
EMA20 = ta.ema(close, 20)
// Normalization 0–100
minPrice = ta.lowest(low, 100)
maxPrice = ta.highest(high, 100)
rangeCalc = maxPrice - minPrice
rangeCalc := rangeCalc == 0 ? 1 : rangeCalc
normSMA = ((SMA20 - minPrice) / rangeCalc) * 100
normEMA = ((EMA20 - minPrice) / rangeCalc) * 100
//--------------------------------------------------------
// 🩶 MOVING AVERAGES PLOTS (GHOST-GREY STYLE)
//--------------------------------------------------------
ghostColor = color.new(color.rgb(200,200,200), 65)
plot(normSMA, title="SMA 20 (Ghost Grey)", color=ghostColor, linewidth=2)
plot(normEMA, title="EMA 20 (Ghost Grey)", color=ghostColor, linewidth=2)
//--------------------------------------------------------
// 🌈 FILL BETWEEN MOVING AVERAGES
//--------------------------------------------------------
bullCond = normSMA < normEMA
bearCond = normSMA > normEMA
fill(
plot(normSMA, display=display.none),
plot(normEMA, display=display.none),
color = bearCond ? color.new(color.red, 55) :
bullCond ? color.new(color.lime, 55) : na
)
//--------------------------------------------------------
// ✅ END OF INDICATOR
//--------------------------------------------------------

Minho Index | SETUP+@TraderMinho//@version=5
// By: Trader Minho — Analista Gráfico desde 2022
indicator("Minho Index | SETUP+@TraderMinho", shorttitle="Minho Index (Classic)", overlay=false)
//--------------------------------------------------------
// PARAMETERS
//--------------------------------------------------------
shortPeriod = input.int(3, "Short Period")
mediumPeriod = input.int(8, "Medium Period")
longPeriod = input.int(20, "Long Period")
intensityFactor = input.float(3.0, "Intensity Factor", step = 0.1)
shortSmoothing = input.int(2, "Short Smoothing (EMA)")
mediumSmoothing = input.int(5, "Medium Smoothing (EMA)")
shortColor = input.color(color.new(#00CED1, 0), "Short Line Color (Aqua Blue)")
mediumColor = input.color(color.new(#FFD700, 0), "Medium Line Color (Yellow)")
zeroColor = input.color(color.new(color.white, 0), "Zero Line Color")
lineWidth = input.int(1, "Line Thickness")
//--------------------------------------------------------
// MOVING AVERAGE CALCULATIONS
//--------------------------------------------------------
smaShort = ta.sma(close, shortPeriod)
smaMedium = ta.sma(close, mediumPeriod)
smaLong = ta.sma(close, longPeriod)
//--------------------------------------------------------
// CLASSIC DIDI NORMALIZATION
//--------------------------------------------------------
priceBase = ta.sma(close, longPeriod)
didiShort = ((smaShort - smaLong) / priceBase) * intensityFactor
didiMedium = ((smaMedium - smaLong) / priceBase) * intensityFactor
//--------------------------------------------------------
// FINAL SMOOTHING (CLASSIC NEEDLE EFFECT)
//--------------------------------------------------------
aquaSmooth = ta.ema(didiShort, shortSmoothing)
yellowSmooth = ta.ema(didiMedium, mediumSmoothing)
//--------------------------------------------------------
// PLOTS
//--------------------------------------------------------
hline(0, "Zero Line", color = zeroColor, linewidth = 1)
plot(aquaSmooth, "Short (Aqua)", color = shortColor, linewidth = lineWidth)
plot(yellowSmooth, "Medium (Yellow)", color = mediumColor, linewidth = lineWidth)

WolfgateThe Wolfpack Framework is my core intraday execution overlay for SPY and index futures.
This script plots:
9 EMA (white) – short-term momentum and micro pullback engine
21 EMA (yellow, dotted) – intraday trend backbone and bias filter
200 SMA (purple, dotted) – primary higher-timeframe trend reference
400 SMA (red, dotted) – macro trend and extreme mean-reversion anchor
VWAP (bright blue, thick) – institutional fair value for the current session
No auto-drawn ORB, no auto levels – traders mark those manually using their own playbook to keep the chart clean and intentional.
Pair this with a separate “Volume” indicator (standard volume columns) in the lower pane for full context.
Built for 0DTE / intraday options traders who want a fast, uncluttered framework they can execute from without thinking.

Buy-Call Arrows – SuperTrend Entries OnlyRecommended Rules
Signal from Script Your Action (Calls Only)
Green BUY arrow → Enter calls (ATM or slightly OTM, 45 DTE)
Red SELL arrow → Immediately exit the call (market order or tight stop) — do NOT wait
No position between signals Stay in cash — no calls open during red SuperTrend phases

VWAP + EMA9/21/50 + Ichimoku + RSI (M5) - Strict + TPSL//@version=5
indicator("VWAP + EMA9/21/50 + Ichimoku + RSI (M5) - Strict + TPSL", overlay=true, shorttitle="VWAP_EMA_ICH_RSI_TPSL")
// === Inputs ===
emaFastLen = input.int(9, "EMA Fast (9)")
emaMidLen = input.int(21, "EMA Mid (21)")
emaSlowLen = input.int(50, "EMA Slow (50)")
// Ichimoku inputs
tenkanLen = input.int(9, "Tenkan Sen Length")
kijunLen = input.int(26, "Kijun Sen Length")
senkouBLen = input.int(52, "Senkou B Length")
displacement = input.int(26, "Displacement")
// RSI
rsiLen = input.int(14, "RSI Length")
rsiThreshold = input.int(50, "RSI Threshold")
// VWAP option
useSessionVWAP = input.bool(true, "Use Session VWAP (true) / Daily VWAP (false)")
// Volume filter
useVolumeFilter = input.bool(true, "Enable Volume Filter")
volAvgLen = input.int(20, "Volume Avg Length")
volMultiplier = input.float(1.2, "Min Volume > avg *", step=0.1)
// Higher timeframe trend check
useHTF = input.bool(true, "Enable Higher-Timeframe Trend Check")
htfTF = input.string("60", "HTF timeframe (e.g. 60, 240, D)")
// Alerts / webhook
alertOn = input.bool(true, "Enable Alerts")
useWebhook = input.bool(true, "Send webhook on alerts")
webhookURL = input.string("", "Webhook URL (leave blank to set in alert)")
// TP/SL & Trailing inputs
useTP = input.bool(true, "Enable Take Profit (TP)")
tpTypeRR = input.bool(true, "TP as Risk-Reward ratio (true) / Fixed points (false)")
tpRR = input.float(1.5, "TP RR (e.g. 1.5)", step=0.1)
fixedTPpts = input.float(40.0, "Fixed TP (ticks/pips) if not RR")
useSL = input.bool(true, "Enable Stop Loss (SL)")
slTypeATR = input.bool(true, "SL as ATR-based (true) / Fixed points (false)")
atrLen = input.int(14, "ATR Length")
atrMult = input.float(1.5, "ATR Multiplier for SL", step=0.1)
fixedSLpts = input.float(20.0, "Fixed SL (ticks/pips) if not ATR")
useTrailing = input.bool(true, "Enable Trailing Stop")
trailType = input.string("ATR", "Trailing type: ATR or EMA", options= ) // "ATR" or "EMA"
trailATRmult = input.float(1.0, "Trailing ATR Multiplier", step=0.1)
trailEMAlen = input.int(9, "Trailing EMA Length (if EMA chosen)")
trailLockInPts = input.float(5.0, "Trail lock-in (min profit before trail active, pts)")
// Other
showArrows = input.bool(true, "Show Entry Arrows")
// === Calculations ===
ema9 = ta.ema(close, emaFastLen)
ema21 = ta.ema(close, emaMidLen)
ema50 = ta.ema(close, emaSlowLen)
// VWAP
vwapVal = ta.vwap
// Ichimoku
highestHighTenkan = ta.highest(high, tenkanLen)
lowestLowTenkan = ta.lowest(low, tenkanLen)
tenkan = (highestHighTenkan + lowestLowTenkan) / 2
highestHighKijun = ta.highest(high, kijunLen)
lowestLowKijun = ta.lowest(low, kijunLen)
kijun = (highestHighKijun + lowestLowKijun) / 2
highestHighSenkouB = ta.highest(high, senkouBLen)
lowestLowSenkouB = ta.lowest(low, senkouBLen)
senkouB = (highestHighSenkouB + lowestLowSenkouB) / 2
senkouA = (tenkan + kijun) / 2
// RSI
rsi = ta.rsi(close, rsiLen)
// Volume
volAvg = ta.sma(volume, volAvgLen)
volOk = not useVolumeFilter or (volume > volAvg * volMultiplier)
// Higher timeframe trend values
htf_close = request.security(syminfo.tickerid, htfTF, close)
htf_ema50 = request.security(syminfo.tickerid, htfTF, ta.ema(close, emaSlowLen))
htf_rsi = request.security(syminfo.tickerid, htfTF, ta.rsi(close, rsiLen))
htf_bull = htf_close > htf_ema50
htf_bear = htf_close < htf_ema50
htf_ok = not useHTF or (htf_bull and close > ema50) or (htf_bear and close < ema50)
// Trend filters (on current timeframe)
priceAboveVWAP = close > vwapVal
priceAboveEMA50 = close > ema50
priceAboveCloud = close > senkouA and close > senkouB
bullTrend = priceAboveVWAP and priceAboveEMA50 and priceAboveCloud
bearTrend = not priceAboveVWAP and not priceAboveEMA50 and not priceAboveCloud
// Pullback detection (price near EMA21 within tolerance)
tolPerc = input.float(0.35, "Pullback tolerance (%)", step=0.05) / 100.0
nearEMA21 = math.abs(close - ema21) <= ema21 * tolPerc
// Entry conditions
emaCrossUp = ta.crossover(ema9, ema21)
emaCrossDown = ta.crossunder(ema9, ema21)
longConditionBasic = bullTrend and (nearEMA21 or close >= vwapVal) and emaCrossUp and rsi > rsiThreshold
shortConditionBasic = bearTrend and (nearEMA21 or close <= vwapVal) and emaCrossDown and rsi < rsiThreshold
longCondition = longConditionBasic and volOk and htf_ok and (not useHTF or htf_bull) and (rsi > rsiThreshold)
shortCondition = shortConditionBasic and volOk and htf_ok and (not useHTF or htf_bear) and (rsi < rsiThreshold)
// More strict: require Tenkan > Kijun for bull and Tenkan < Kijun for bear
ichimokuAlign = (tenkan > kijun) ? 1 : (tenkan < kijun ? -1 : 0)
longCondition := longCondition and (ichimokuAlign == 1)
shortCondition := shortCondition and (ichimokuAlign == -1)
// ATR for SL / trailing
atr = ta.atr(atrLen)
// --- Trade management state variables ---
var float activeLongEntry = na
var float activeShortEntry = na
var float activeLongSL = na
var float activeShortSL = na
var float activeLongTP = na
var float activeShortTP = na
var float activeLongTrail = na
var float activeShortTrail = na
// Function to convert fixed points to price (assumes chart in points as price units)
fixedToPriceLong(p) => p
fixedToPriceShort(p) => p
// On signal, set entry, SL and TP
if longCondition
activeLongEntry := close
// SL
if useSL
if slTypeATR
activeLongSL := close - atr * atrMult
else
activeLongSL := close - fixedToPriceLong(fixedSLpts)
else
activeLongSL := na
// TP
if useTP
if tpTypeRR and useSL and not na(activeLongSL)
risk = activeLongEntry - activeLongSL
activeLongTP := activeLongEntry + risk * tpRR
else
activeLongTP := activeLongEntry + fixedToPriceLong(fixedTPpts)
else
activeLongTP := na
// reset short
activeShortEntry := na
activeShortSL := na
activeShortTP := na
// init trailing
activeLongTrail := activeLongSL
if shortCondition
activeShortEntry := close
if useSL
if slTypeATR
activeShortSL := close + atr * atrMult
else
activeShortSL := close + fixedToPriceShort(fixedSLpts)
else
activeShortSL := na
if useTP
if tpTypeRR and useSL and not na(activeShortSL)
riskS = activeShortSL - activeShortEntry
activeShortTP := activeShortEntry - riskS * tpRR
else
activeShortTP := activeShortEntry - fixedToPriceShort(fixedTPpts)
else
activeShortTP := na
// reset long
activeLongEntry := na
activeLongSL := na
activeLongTP := na
// init trailing
activeShortTrail := activeShortSL
// Trailing logic (update only when in profit beyond 'lock-in')
if not na(activeLongEntry) and useTrailing
// current unrealized profit in points
currProfitPts = close - activeLongEntry
if currProfitPts >= trailLockInPts
// declare candidate before use to avoid undeclared identifier errors
float candidate = na
if trailType == "ATR"
candidate := close - atr * trailATRmult
else
candidate := close - ta.ema(close, trailEMAlen)
// move trail stop up but never below initial SL
activeLongTrail := math.max(nz(activeLongTrail, activeLongSL), candidate)
// ensure trail never goes below initial SL if SL exists
if useSL and not na(activeLongSL)
activeLongTrail := math.max(activeLongTrail, activeLongSL)
// update SL to trailing
activeLongSL := activeLongTrail
if not na(activeShortEntry) and useTrailing
currProfitPtsS = activeShortEntry - close
if currProfitPtsS >= trailLockInPts
// declare candidateS before use
float candidateS = na
if trailType == "ATR"
candidateS := close + atr * trailATRmult
else
candidateS := close + ta.ema(close, trailEMAlen)
activeShortTrail := math.min(nz(activeShortTrail, activeShortSL), candidateS)
if useSL and not na(activeShortSL)
activeShortTrail := math.min(activeShortTrail, activeShortSL)
activeShortSL := activeShortTrail
// Detect TP/SL hits (for plotting & alerts)
longTPHit = not na(activeLongTP) and close >= activeLongTP
longSLHit = not na(activeLongSL) and close <= activeLongSL
shortTPHit = not na(activeShortTP) and close <= activeShortTP
shortSLHit = not na(activeShortSL) and close >= activeShortSL
if longTPHit or longSLHit
// reset long state after hit
activeLongEntry := na
activeLongSL := na
activeLongTP := na
activeLongTrail := na
if shortTPHit or shortSLHit
activeShortEntry := na
activeShortSL := na
activeShortTP := na
activeShortTrail := na
// Plot EMAs
p_ema9 = plot(ema9, title="EMA9", linewidth=1)
plot(ema21, title="EMA21", linewidth=1)
plot(ema50, title="EMA50", linewidth=2)
// Plot VWAP
plot(vwapVal, title="VWAP", linewidth=2, style=plot.style_line)
// Plot Ichimoku lines (Tenkan & Kijun)
plot(tenkan, title="Tenkan", linewidth=1)
plot(kijun, title="Kijun", linewidth=1)
// Plot cloud (senkouA & senkouB shifted forward)
plot(senkouA, title="Senkou A", offset=displacement, transp=60)
plot(senkouB, title="Senkou B", offset=displacement, transp=60)
fill(plot(senkouA, offset=displacement), plot(senkouB, offset=displacement), color = senkouA > senkouB ? color.new(color.green, 80) : color.new(color.red, 80))
// Plot active trade lines
plotshape(not na(activeLongEntry), title="Active Long", location=location.belowbar, color=color.new(color.green, 0), style=shape.circle, size=size.tiny)
plotshape(not na(activeShortEntry), title="Active Short", location=location.abovebar, color=color.new(color.red, 0), style=shape.circle, size=size.tiny)
plot(activeLongSL, title="Long SL", color=color.red, linewidth=2)
plot(activeLongTP, title="Long TP", color=color.green, linewidth=2)
plot(activeShortSL, title="Short SL", color=color.red, linewidth=2)
plot(activeShortTP, title="Short TP", color=color.green, linewidth=2)
// Arrows / labels
if showArrows
if longCondition
label.new(bar_index, low, "BUY", style=label.style_label_up, color=color.green, textcolor=color.white, size=size.small)
if shortCondition
label.new(bar_index, high, "SELL", style=label.style_label_down, color=color.red, textcolor=color.white, size=size.small)
// Alerts
// alertcondition must be declared in global scope so TradingView can create alerts from them
alertcondition(longCondition, "VWAP+EMA+Ichimoku+RSI — BUY (STRICT)", "BUY signal from VWAP+EMA+Ichimoku+RSI (STRICT)")
alertcondition(shortCondition, "VWAP+EMA+Ichimoku+RSI — SELL (STRICT)", "SELL signal from VWAP+EMA+Ichimoku+RSI (STRICT)")
// Runtime alerts (still use alert() to trigger immediate alerts; webhook is added in TradingView Alert dialog)
if alertOn
if longCondition
alert("VWAP+EMA+Ichimoku+RSI — BUY (STRICT)", alert.freq_once_per_bar_close)
if shortCondition
alert("VWAP+EMA+Ichimoku+RSI — SELL (STRICT)", alert.freq_once_per_bar_close)
// Alerts for TP/SL hits
if longTPHit
alert("LONG TP HIT", alert.freq_once_per_bar_close)
if longSLHit
alert("LONG SL HIT", alert.freq_once_per_bar_close)
if shortTPHit
alert("SHORT TP HIT", alert.freq_once_per_bar_close)
if shortSLHit
alert("SHORT SL HIT", alert.freq_once_per_bar_close)
// Info table
var table info = table.new(position.top_right, 1, 8)
if barstate.islast
table.cell(info, 0, 0, text = 'Trend: ' + (bullTrend ? 'Bull' : bearTrend ? 'Bear' : 'Neutral'))
table.cell(info, 0, 1, text = 'EMA9/21/50: ' + str.tostring(ema9, format.mintick) + ' / ' + str.tostring(ema21, format.mintick) + ' / ' + str.tostring(ema50, format.mintick))
table.cell(info, 0, 2, text = 'VWAP: ' + str.tostring(vwapVal, format.mintick))
table.cell(info, 0, 3, text = 'RSI: ' + str.tostring(rsi, format.mintick))
table.cell(info, 0, 4, text = 'Vol OK: ' + (volOk ? 'Yes' : 'No'))
table.cell(info, 0, 5, text = 'HTF: ' + htfTF + ' ' + (htf_bull ? 'Bull' : htf_bear ? 'Bear' : 'Neutral'))
table.cell(info, 0, 6, text = 'ActiveLong: ' + (not na(activeLongEntry) ? 'Yes' : 'No'))
table.cell(info, 0, 7, text = 'ActiveShort: ' + (not na(activeShortEntry) ? 'Yes' : 'No'))
// End of script

Grok/Claude AI Neural Fusion Pro V2AI Neural Fusion Pro V2 - New Features
Overview
Version 2 of AI Neural Fusion Pro introduces two complementary protection systems designed to preserve capital during market extremes. The first prevents over-buying during violent crashes. The second prevents over-selling during powerful rallies. Together, they transform a reactive trading system into one that adapts intelligently to market conditions.
Feature 1: Cascade Protection
Purpose
Cascade Protection prevents capital destruction during violent market crashes by implementing two independent safeguards that must both pass before any buy signal can fire.
The Problem It Solves
During market crashes, several dangerous conditions occur simultaneously. Volatility spikes to extreme levels, indicators scream "oversold," and each dip looks like the bottom. Traditional systems fire buy after buy, depleting capital reserves while price continues falling. By the time the actual bottom forms, there's no capital left to capture it.
How It Works
Layer 1: BBWP Freeze
Bollinger Band Width Percentile measures current volatility relative to historical volatility. When BBWP exceeds 92%, it indicates the market is experiencing abnormal volatility—typically during liquidation cascades or panic selling. During these periods, all buy signals are frozen regardless of how oversold conditions appear. This is an absolute freeze with no exceptions.
Layer 2: Consecutive Buy Counter
This layer limits the maximum number of buy orders that can execute without an intervening sell. The default limit is 3 consecutive buys. Once reached, additional buy signals are blocked until a sell signal fires and resets the counter. This prevents the common scenario where a bot keeps averaging down position after position during an extended decline.
Configuration
SettingDefaultDescriptionEnable Cascade ProtectionONMaster toggle for entire featureBBWP Length7Period for Bollinger Band calculationBBWP Lookback100Historical period for percentile rankingBBWP Freeze Level92%Threshold above which buys freezeMax Consecutive Buys3Maximum buys before forced pause
Panel Display
The info panel shows real-time protection status with color-coded feedback:
BBWP row: Shows current percentage and status (OK in green, FROZEN in red)
Buy Counter row: Shows current count versus maximum (green when available, orange approaching limit, red when blocked)
Key Behavior
Sell signals are never affected by cascade protection
The buy counter resets to zero after any sell signal fires
BBWP freeze is absolute—even extreme oversold conditions cannot bypass it
Feature 2: Dynamic Cooldown
Purpose
Dynamic Cooldown prevents over-selling during powerful rallies by automatically extending the minimum time between signals when the market enters a strong trend.
The Problem It Solves
During strong rallies, traditional indicators repeatedly hit overbought conditions, triggering sell after sell as price climbs. A trader might execute 10-15 sells during a sustained move from $86K to $93K, selling away their position piece by piece instead of letting profits run. Each sell captures a small gain while missing the larger move.
How It Works
The system monitors ADX (Average Directional Index) to detect trend strength. When ADX exceeds 50 and is rising, the market has entered a powerful trending phase. During these conditions, the cooldown period between signals automatically increases from 5 bars to 10 bars.
This means signals fire less frequently during strong trends, allowing positions more time to develop before the next potential exit. The extended cooldown applies equally to both buy and sell signals, though the primary benefit is reducing premature sells during rallies.
Normal Market (ADX < 50 or falling):
Cooldown = 5 bars (25 minutes on 5-minute chart)
Standard signal frequency
Strong Trend (ADX > 50 and rising):
Cooldown = 10 bars (50 minutes on 5-minute chart)
Reduced signal frequency to let trends develop
Configuration
SettingDefaultDescriptionEnable Dynamic CooldownONMaster toggle for featureSignal Cooldown5 barsStandard cooldown between signalsStrong Trend ADX Threshold50ADX level that triggers extended cooldownStrong Trend Cooldown10 barsExtended cooldown during strong trends
Panel Display
The info panel provides visual indication of current cooldown state:
ADX row: Shows value with arrow indicator (ADX ↑) when in strong trend mode, blue background when above threshold
Cooldown row: Shows active cooldown period with arrow indicator (Cooldown ↑) when extended, blue background during strong trends
Key Behavior
Cooldown applies to both buy and sell signals equally
Transition between modes is automatic based on ADX conditions
ADX must be both above threshold AND rising to trigger extended cooldown
When ADX stops rising or drops below threshold, cooldown returns to normal immediately
Combined Effect
These two features work together to create a more intelligent trading system:
During Crashes:
BBWP spikes above 92% → Buys frozen
System waits for volatility to normalize
When BBWP drops, limited buys (3 max) capture the actual bottom
Capital preserved for recovery
During Rallies:
ADX rises above 50 → Cooldown extends to 10 bars
Fewer sell signals fire during the move
Positions held longer, capturing more of the trend
Profits allowed to run
During Normal Markets:
Standard 5-bar cooldown
No BBWP restrictions
Full signal frequency for active trading
Summary
Version 2 transforms AI Neural Fusion Pro from a purely reactive indicator into an adaptive system that recognizes market extremes and adjusts its behavior accordingly. Cascade Protection guards against buying into crashes. Dynamic Cooldown guards against selling out of rallies. Together, they help preserve capital during adverse conditions while allowing full participation when markets behave normally.

Obsidian Flux Matrix# Obsidian Flux Matrix | JackOfAllTrades
Made with my Senior Level AI Pine Script v6 coding bot for the community!
Narrative Overview
Obsidian Flux Matrix (OFM) is an open-source Pine Script v6 study that fuses social sentiment, higher timeframe trend bias, fair-value-gap detection, liquidity raids, VWAP gravitation, session profiling, and a diagnostic HUD. The layout keeps the obsidian palette so critical overlays stay readable without overwhelming a price chart.
Purpose & Scope
OFM focuses on actionable structure rather than marketing claims. It documents every driver that powers its confluence engine so reviewers understand what triggers each visual.
Core Analytical Pillars
1. Social Pulse Engine
Sentiment Webhook Feed: Accepts normalized scores (-1 to +1). Signals only arm when the EMA-smoothed value exceeds the `sentimentMin` input (0.35 by default).
Volume Confirmation: Requires local volume > 30-bar average × `volSpikeMult` (default 2.0) before sentiment flags.
EMA Cross Validation: Fast EMA 8 crossing above/below slow EMA 21 keeps momentum aligned with flow.
Momentum Alignment: Multi-timeframe momentum composite must agree (positive for longs, negative for shorts).
2. Peer Momentum Heatmap
Multi-Timeframe Blend: RSI + Stoch RSI fetched via request.security() on 1H/4H/1D by default.
Composite Scoring: Each timeframe votes +1/-1/0; totals are clamped between -3 and +3.
Intraday Readability: Configurable band thickness (1-5) so scalpers see context without losing space.
Dynamic Opacity: Stronger agreement boosts column opacity for quick bias checks.
3. Trend & Displacement Framework
Dual EMA Ribbon: Cyan/magenta ribbon highlights immediate posture.
HTF Bias: A higher-timeframe EMA (default 55 on 4H) sets macro direction.
Displacement Score: Body-to-ATR ratio (>1.4 default) detects impulses that seed FVGs or VWAP raids.
ATR Normalization: All thresholds float with volatility so the study adapts to assets and regimes.
4. Intelligent Fair Value Gap (FVG) System
Gap Detection: Three-candle logic (bullish: low > high ; bearish: high < low ) with ATR-sized minimums (0.15 × ATR default).
Overlap Prevention: Price-range checks stop redundant boxes.
Spacing Control: `fvgMinSpacing` (default 5) avoids stacking from the same impulse.
Storage Caps: Max three FVGs per side unless the user widens the limit.
Session Awareness: Kill zone filters keep taps focused on London/NY if desired.
Auto Cleanup: Boxes delete when price closes beyond their invalidation level.
5. VWAP Magnet + Liquidity Raid Engine
Session or Rolling VWAP: Toggle resets to match intraday or rolling preferences.
Equal High/Low Scanner: Looks back 20 bars by default for liquidity pools.
Displacement Filter: ATR multiplier ensures raids represent genuine liquidity sweeps.
Mean Reversion Focus: Signals fire when price displaces back toward VWAP following a raid.
6. Session Range Breakout System
Initial Balance Tracking: First N bars (15 default) define the session box.
Breakout Logic: Requires simultaneous liquidity spikes, nearby FVG activity, and supportive momentum.
Z-Score Volume Filter: >1.5σ by default to filter noisy moves.
7. Lifestyle Liquidity Scanner
Volume Z-Scores: 50-bar baseline highlights statistically significant spikes.
Smart Money Footprints: Bottom-of-chart squares color-code buy vs sell participation.
Panel Memory: HUD logs the last five raid timestamps, direction, and normalized size.
8. Risk Matrix & Diagnostic HUD
HUD Structure: Table in the top-right summarizes HTF bias, sentiment, momentum, range state, liquidity memory, and current risk references.
Signal Tags: Aggregates SPS, FVG, VWAP, Range, and Liquidity states into a compact string.
Risk Metrics: Swing-based stops (5-bar lookback) + ATR targets (1.5× default) keep risk transparent.
Signal Families & Alerts
Social Pulse (SPS): Volume-confirmed sentiment alignment; triangle markers with “SPS”.
Kill-Zone FVG: Session + HTF alignment + FVG tap; arrow markers plus SL/TP labels.
Local FVG: Captures local reversals when HTF bias has not flipped yet.
VWAP Raid: Equal-high/low raids that snap toward VWAP; “VWAP” label markers.
Range Breakout: Initial balance violations with liquidity and imbalance confirmation; circle markers.
Liquidity Spike: Z-score spikes ≥ threshold; square markers along the baseline.
Visual Design & Customization
Theme Palette: Primary background RGB (12,6,24). Accent shading RGB (26,10,48). Long accents RGB (88,174,255). Short accents RGB (219,109,255).
Stylized Candles: Optional overlay using theme colors.
Signal Toggles: Independently enable markers, heatmap, and diagnostics.
Label Spacing: Auto-spacing enforces ≥4-bar gaps to prevent text overlap.
Customization & Workflow Notes
Adjust ATR/FVG thresholds when volatility shifts.
Re-anchor sentiment to your webhook cadence; EMA smoothing (default 5) dampens noise.
Reposition the HUD by editing the `table.new` coordinates.
Use multiples of the chart timeframe for HTF requests to minimize load.
Session inputs accept exchange-local time; align them to your market.
Performance & Compliance
Pure Pine v6: Single-line statements, no `lookahead_on`.
Resource Safe: Arrays trimmed, boxes limited, `request.security` cached.
Repaint Awareness: Signals confirm on close; alerts mirror on-chart logic.
Runtime Safety: Arrays/loops guard against `na`.
Use Cases
Measure when social sentiment aligns with structure.
Plan ICT-style intraday rebalances around session-specific FVG taps.
Fade VWAP raids when displacement shows exhaustion.
Watch initial balance breaks backed by statistical volume.
Keep risk/target references anchored in ATR logic.
Signal Logic Snapshot
Social Pulse Long/Short: `sentimentEMA` gated by `sentimentMin`, `volSpike`, EMA 8/21 cross, and `momoComposite` sign agreement. Keeps hype tied to structural follow-through.
Kill-Zone FVG Long/Short: Requires session filter, HTF EMA bias alignment, and an active FVG tap (`bullFvgTap` / `bearFvgTap`). Labels include swing stops + ATR targets pulled from `swingLookback` and `liqTargetMultiple`.
Local FVG Long/Short: Uses `localBullish` / `localBearish` heuristics (EMA slope, displacement, sequential closes) to surface intraday reversals even when HTF bias has not flipped.
VWAP Raids: Detect equal-high/equal-low sweeps (`raidHigh`, `raidLow`) that revert toward `sessionVwap` or rolling VWAP when displacement exceeds `vwapAlertDisplace`.
Range Breakouts: Combine `rangeComplete`, breakout confirmation, liquidity spikes, and nearby FVG activity for statistically backed initial balance breaks.
Liquidity Spikes: Volume Z-score > `zScoreThreshold` logs direction, size, and timestamp for the HUD and optional review workflows.
Session Logic & VWAP Handling
Kill zone + NY session inputs use TradingView’s session strings; `f_inSession()` drives both visual shading and whether FVG taps are tradeable when `killZoneOnly` is true.
Session VWAP resets using cumulative price × volume sums that restart when the daily timestamp changes; rolling VWAP falls back to `ta.vwap(hlc3)` for instruments where daily resets are less relevant.
Initial balance box (`rangeBars` input) locks once complete, extends forward, and stays on chart to contextualize later liquidity raids or breakouts.
Parameter Reference
Trend: `emaFastLen`, `emaSlowLen`, `htfResolution`, `htfEmaLen`, `showEmaRibbon`, `showHtfBiasLine`.
Momentum: `tf1`, `tf2`, `tf3`, `rsiLen`, `stochLen`, `stochSmooth`, `heatmapHeight`.
Volume/Liquidity: `volLookback`, `volSpikeMult`, `zScoreLen`, `zScoreThreshold`, `equalLookback`.
VWAP & Sessions: `vwapMode`, `showVwapLine`, `vwapAlertDisplace`, `killSession`, `nySession`, `showSessionShade`, `rangeBars`.
FVG/Risk: `fvgMinTicks`, `fvgLookback`, `fvgMinSpacing`, `killZoneOnly`, `liqTargetMultiple`, `swingLookback`.
Visualization Toggles: `showSignalMarkers`, `showHeatmapBand`, `showInfoPanel`, `showStylizedCandles`.
Workflow Recipes
Kill-Zone Continuation: During the defined kill session, look for `killFvgLong` or `killFvgShort` arrows that line up with `sentimentValid` and positive `momoComposite`. Use the HUD’s risk readout to confirm SL/TP distances before entering.
VWAP Raid Fade: Outside kill zone, track `raidToVwapLong/Short`. Confirm the candle body exceeds the displacement multiplier, and price crosses back toward VWAP before considering reversions.
Range Break Monitor: After the initial balance locks, mark `rangeBreakLong/Short` circles only when the momentum band is >0 or <0 respectively and a fresh FVG box sits near price.
Liquidity Spike Review: When the HUD shows “Liquidity” timestamps, hover the plotted squares at chart bottom to see whether spikes were buy/sell oriented and if local FVGs formed immediately after.
Metadata
Author: officialjackofalltrades
Platform: TradingView (Pine Script v6)
Category: Sentiment + Liquidity Intelligence
Hope you Enjoy!

Momentum Permission + Pivot Entry + Exit (v1.4 FULL)//@version=5
indicator("Momentum Permission + Pivot Entry + Exit (v1.4 FULL)", overlay=true)
// ──────────────────────────────────────────────
// Inputs
// ──────────────────────────────────────────────
smaLength = input.int(50, "SMA Length")
relVolThresh = input.float(1.3, "Relative Volume Threshold")
pivotLookback = input.int(3, "Pivot Lookback Bars")
// ──────────────────────────────────────────────
// Core Calculations
// ──────────────────────────────────────────────
sma50 = ta.sma(close, smaLength)
vwap = ta.vwap(close)
relVol = volume / ta.sma(volume, 10)
aboveSMA = close > sma50
aboveVWAP = close > vwap
relStrong = relVol > relVolThresh
greenCandle = close > open
crossUp = ta.crossover(close, sma50)
// ──────────────────────────────────────────────
// One-Time Daily Permission
// ──────────────────────────────────────────────
var bool permission = false
if ta.change(time("D"))
permission := false
permitSignal = crossUp and aboveVWAP and relStrong and not permission
if permitSignal
permission := true
// ──────────────────────────────────────────────
// Entry: Pivot Break Continuation
// ──────────────────────────────────────────────
pivotHighBreak = close > ta.highest(high , pivotLookback)
entrySignal = (
permission and
aboveSMA and
aboveVWAP and
relStrong and
greenCandle and
pivotHighBreak
)
// ──────────────────────────────────────────────
// Exit: Trend Exhaustion / VWAP Breakdown
// ──────────────────────────────────────────────
smaChange = sma50 - sma50
exitSignal = (
permission and
close < vwap and
close < open and
relStrong and
smaChange < 0
)
// ──────────────────────────────────────────────
// VISUAL PLOTS (same as before)
// ──────────────────────────────────────────────
plot(sma50, title="SMA50", color=color.orange, linewidth=2)
plot(vwap, title="VWAP", color=color.new(color.blue, 0), linewidth=2)
plotshape(
permitSignal,
title="Trend Permission",
style=shape.triangleup,
location=location.belowbar,
color=color.new(color.green, 0),
size=size.large,
text="PERMIT"
)
plotshape(
entrySignal,
title="Entry Trigger",
style=shape.triangleup,
location=location.abovebar,
color=color.new(color.aqua, 0),
size=size.normal,
text="ENTRY"
)
plotshape(
exitSignal,
title="Exit Signal",
style=shape.triangledown,
location=location.abovebar,
color=color.new(color.red, 0),
size=size.large,
text="EXIT"
)
// ──────────────────────────────────────────────
// SCREENER OUTPUT (persistent 0/1 for the day)
// ──────────────────────────────────────────────
var bool permitToday = false
var bool entryToday = false
var bool exitToday = false
if ta.change(time("D"))
permitToday := false
entryToday := false
exitToday := false
if permitSignal
permitToday := true
if entrySignal
entryToday := true
if exitSignal
exitToday := true
// Hidden plots for screener columns
plot(permitToday ? 1 : 0, title="PERMIT", display=display.none)
plot(entryToday ? 1 : 0, title="ENTRY", display=display.none)
plot(exitToday ? 1 : 0, title="EXIT", display=display.none)
// Alerts
alertcondition(permitSignal, title="PERMIT", message="Momentum PERMISSION fired")
alertcondition(entrySignal, title="ENTRY", message="Momentum ENTRY fired")
alertcondition(exitSignal, title="EXIT", message="Momentum EXIT fired")

Momentum Permission + Pivot Entry + Exit (v1.4)//@version=5
indicator("Momentum Permission + Pivot Entry + Exit (v1.4)", overlay=true)
// ──────────────────────────────────────────────
// Inputs
// ──────────────────────────────────────────────
smaLength = input.int(50, "SMA Length")
relVolThresh = input.float(1.3, "Relative Volume Threshold")
pivotLookback = input.int(3, "Pivot Break Lookback")
// ──────────────────────────────────────────────
// Core Calculations
// ──────────────────────────────────────────────
sma50 = ta.sma(close, smaLength)
vwap = ta.vwap(close)
relVol = volume / ta.sma(volume, 10)
crossUp = ta.crossover(close, sma50)
aboveSMA = close > sma50
aboveVWAP = close > vwap
relStrong = relVol > relVolThresh
greenCandle = close > open
// ──────────────────────────────────────────────
// One-Time Daily Trend Permission
// ──────────────────────────────────────────────
var bool permission = false
if ta.change(time("D"))
permission := false
trendStart = crossUp and aboveVWAP and relStrong and not permission
if trendStart
permission := true
// ──────────────────────────────────────────────
// Pullback Pivot Breakout Entry (Continuation Long)
// ──────────────────────────────────────────────
pivotHighBreak = close > ta.highest(high , pivotLookback)
entryTrigger = (
permission and
aboveSMA and
aboveVWAP and
relStrong and
greenCandle and
pivotHighBreak
)
// ──────────────────────────────────────────────
// EXIT Signal (Trend Exhaustion)
// ──────────────────────────────────────────────
smaChange = sma50 - sma50
exitSignal = (
permission and // only after trend started
close < vwap and // VWAP breakdown
close < open and // red candle body
relVol > relVolThresh and // volume spike on selling
smaChange < 0 // SMA turning down / flattening
)
// ──────────────────────────────────────────────
// Plots
// ──────────────────────────────────────────────
plot(sma50, title="SMA50", color=color.orange, linewidth=2)
plot(vwap, title="VWAP", color=color.new(color.blue, 0), linewidth=2)
// Permission marker (1 per day)
plotshape(
trendStart,
title="Trend Permission",
style=shape.triangleup,
location=location.belowbar,
color=color.new(color.green, 0),
size=size.large,
text="PERMIT"
)
// Entry trigger markers
plotshape(
entryTrigger,
title="Entry Trigger",
style=shape.triangleup,
location=location.abovebar,
color=color.new(color.aqua, 0),
size=size.normal,
text="ENTRY"
)
// EXIT marker (trend exhaustion)
plotshape(
exitSignal,
title="Exit Signal",
style=shape.triangledown,
location=location.abovebar,
color=color.new(color.red, 0),
size=size.large,
text="EXIT"
)

