Supply-Demand Dominance & Energy RibbonOverview:
This indicator is specifically fine-tuned for the Nasdaq (NAS100) market. It combines volume-based Delta analysis (Supply-Demand) with price kinetic energy (Slope) to identify high-probability reversal points and trend strength.
Key Features & Usage:
Supply-Demand Dominance (Top-Right Label):
Analyzes volume spikes over a 50-period lookback to determine market control.
Displays "매수 우위" (Bullish Dominance) or "매도 우위" (Bearish Dominance) in real-time.
Energy Ribbon (Bottom Visualization):
Calculates the slope of the TCI oscillator to visualize momentum intensity.
Solid Green/Red: Strong momentum.
Faded Green/Red: Weakening momentum or minor trend.
Momentum Combo Signals (Circle Shapes):
Triggered when WaveTrend and TCI oscillators cross in extreme zones (Overbought 70 / Oversold 30).
Smart Filter: Signals are only shown when they align with the current Supply-Demand dominance, reducing "market noise."
Volume Spikes (Arrow Symbols):
Indicates abnormal volume activity (1.5x average delta). These arrows (↑/↓) help identify potential breakout points or the climax of a move even when a full combo signal isn't present.
指標和策略

Intraday Sessions Ranges with Time SegmentationSession Ranges indicator overlays customizable range boxes on major trading sessions (e.g. London, Premarket, NY AM and NY PM) using New York time.
Toggle visibility, add evenly spaced vertical segment lines, and highlight key time zones. Perfect for traders marking price action and levels across multiple historical days.

Day-Week-Month-Hour Separator [TickDaddy]As the title shows.
Separator lines for Hours/Days/Weeks/Months. customize as you please :)

Session Breakout TrackerThis indicator identifies breakout opportunities when price breaks previous session ranges, tracking 4 distinct breakout chains:
Asia → London (Primary Asia breakout during London session)
London → NY (London breakout during NY session)
NY → Asia (NY breakout during next Asia session)
Asia → NY* (Fallback Asia breakout during NY if Chain 1 had no breakout)
For each breakout, it measures the maximum distance price travels before hitting your defined stop-loss, providing exact pip/point calculations.
Features :
Automatic session detection (Asia: 18:00-03:00, London: 03:00-12:00, NY: 12:00-18:00 NYT)
Complete session range tracking - high/low for each session
Session level plotting with adjustable transparency
User Inputs :
Adjustable pip multiplier (0.0001 for Forex, 0.01 for JPY pairs)
Customizable stop-loss distance in pips
Toggle labels/table/session levels independently
Adjustable session duration for optimizing strategies and back testing

EMA & Stochastic SignalsEma 200 and ema 500 + stochastic crossover. Buys when price is above emas and sells when price is below emas.

EMA 21/50/200 Trend Support & EntryIndicator plots EMA 21, EMA 50, and EMA 200 to define trend structure and dynamic support/resistance.
EMA 200: overall trend bias
EMA 21 and EMA 50: pullback support for high probability trend entries.
EMA 21/50 crosses highlight momentum shifts but are not intended as standalone entry signals.

Cantillon Risk Calculator [Free]Overview Stop guessing your position size. The Cantillon Risk Calculator is a lightweight utility that instantly tells you exactly how many units (Contracts/Coins) to buy based on your account size and risk percentage.
How to Use
Open Settings.
Enter your Account Size (e.g., $10,000) and Risk % (e.g., 1%).
Type in your Stop Loss price.
The table instantly shows your Position Size.
Looking for High Probability Setups? Risk management is only half the battle. To find where to enter using Institutional Order Blocks and Sigma Bands, you need the Cantillon Terminal .

Michael Mor - ATRMichael Mor -ATR is a clean, lightweight chart watermark that gives you key stock context at a glance — without cluttering your chart or covering price action.
It’s designed for traders who want essential fundamentals + recent performance visible directly on the chart, in a subtle, professional style.
What it shows
You can toggle each line on or off:
Company name (optional market cap: M / B / T)
Symbol & timeframe
Sector & industry
ATR (14) with percentage of price and a quick volatility indicator
🟢 low volatility
🟡 medium volatility
🔴 high volatility

PrimeFib_constants_v1Library "PrimeFib_constants_v1"
PrimeFib / GoldenWhirl constants (Pine Library). Versioning is handled via TradingView publish versions.
GOLDEN_RATIO()
GOLDEN_RATIO_INV()
PI()
INV_PI()
PHI_SPIRAL()
PHI7()
PHI7_INV()
PSI_PF()
PSI_PF_INV()
LAMBDA_PF()
RHO_PF_THEO()
RHO_BTC_EMP()
RHO_CME_EMP()
RHO_PF_EMP()
RHOT()


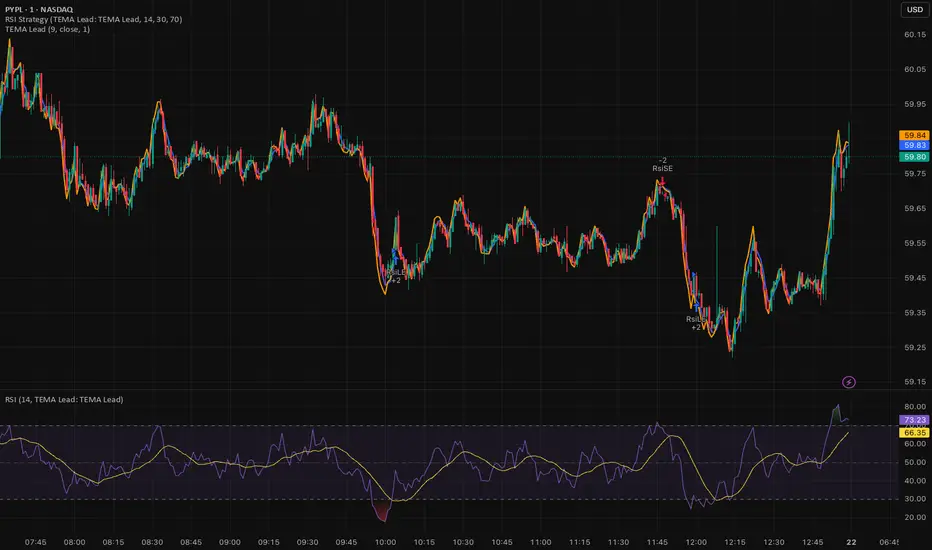
Triple EMA (TEMA) + Slope LeadThis indicator plots a standard Triple EMA (TEMA) and an optional slope-lead version. TEMA is a low-lag moving average built from three EMAs, allowing it to track price more closely than a single EMA. The Lead Strength (k) adds a small forward “push” based on the recent TEMA slope:
TEMA_lead = TEMA + k × (TEMA − TEMA ). Higher k values make the line react earlier but increase sensitivity in chop.
Used as a source for other indicators (RSI, MACD, stochastic, regime filters, etc.), TEMA or TEMA-Lead may improve signal quality by reducing noise, aligning momentum readings with trend direction, and producing earlier, cleaner transitions at turns, often without the excessive lag introduced by heavier smoothing.
Least Squares Moving Average Zero Lag LeadLSMA Zero‑Lag + Lead Indicator
This indicator is a modified Least Squares Moving Average (LSMA) designed to reduce lag and optionally introduce a controlled forward‑leaning (lead) component. It is intended to be used either directly on price or as a smoother, more responsive input source for other indicators such as RSI, MACD, or regime filters.
1. What LSMA Is Doing
LSMA (Least Squares Moving Average) fits a straight‑line regression to the last N bars and evaluates that line at the current bar. Unlike simple or exponential averages, LSMA implicitly models trend direction and slope, which makes it more responsive during directional moves.
2. Zero‑Lag Adjustment
The zero‑lag version applies a simple error‑correction technique:
ZL = 2 × LSMA − LSMA(previous)
This cancels part of the inherent regression delay, producing a smoother line that reacts faster to turns while remaining stable in trends.
3. Lead Component (Optional)
On top of the zero‑lag LSMA, a slope‑based lead is added:
Lead = ZL + k × (ZL − ZL(previous))
Here, the recent slope is projected forward by a user‑controlled factor (k). This does not predict price, but it shifts the average slightly in the direction of current momentum, improving responsiveness for signal generation.
4. Why This Helps RSI and Similar Indicators
RSI and many oscillators operate on raw price changes, which can be noisy and lag‑prone. Feeding RSI with LSMA ZL or LSMA ZL + Lead instead of raw close price:
• Reduces noise without excessive smoothing
• Aligns RSI swings with underlying trend direction
• Improves timing of overbought/oversold transitions
• Reduces late signals after sharp reversals
In practice, this produces an RSI that reacts faster in trends but stays calmer in chop.
5. Practical Usage Tips
• Use LSMA ZL as a clean, low‑lag replacement for price in oscillators
• Add small lead values (0.5–1.0) only if earlier signals are needed
• Avoid high lead values in choppy markets
• Combine with regime or volatility filters for best results
This indicator is best thought of as a signal‑conditioning layer rather than a standalone trading system.

Butterworth LPF Flip + AutoTune (PF)Butterworth LPF Flip + AutoTune (PF)
This strategy trades price trend flips using two Butterworth low-pass filters (a FAST filter and a SLOW filter). A trade is taken when the FAST filter crosses the SLOW filter. Optionally, the script can auto-tune the filter lengths by simulating many Fast/Slow combinations and selecting the pair with the best Profit Factor (PF).
What the Script Does
- Computes two 2‑pole Butterworth low‑pass filters on price.
- Enters LONG when FAST crosses above SLOW.
- Enters SHORT when FAST crosses below SLOW.
- Optionally simulates many Fast/Slow length combinations internally.
- Chooses the Fast/Slow pair with the highest Profit Factor.
- Trades only the selected best pair.
Manual Mode (Default)
1. Leave Auto‑Tune OFF.
2. Set:
- FAST cutoff period (bars)
- SLOW cutoff period (bars)
3. The strategy will trade using only these values.
Use this mode for normal trading or live deployment.
Auto‑Tune Mode
1. Enable Auto‑Tune.
2. Define Fast and Slow ranges:
- FAST min / max / step
- SLOW min / max / step
3. The script simulates ALL Fast × Slow combinations bar‑by‑bar.
4. Each combination tracks:
- Gross Profit
- Gross Loss
- Closed trades
- Profit Factor (PF = GP / GL)
5. At the end of the chart, the best PF pair is selected and used for trading.
Interpreting the End Box
The status label at the end of the chart reports:
- Whether Auto‑Tune is enabled
- Number of candidate pairs tested
- Best FAST period
- Best SLOW period
- Profit Factor of the best pair
- Win Rate (wins ÷ closed trades)
If PF is near 1.0 or trades are very low, expand the range or length of the test.
Best Practices
- Use Auto‑Tune ONLY for research and optimization.
- After finding good parameters, disable Auto‑Tune and trade manually.
- Keep Fast < Slow (logical separation).
- Longer charts produce more reliable PF results.
- Avoid very small step sizes (performance + noise).
Known Limitations
- Pine Script runs bar‑by‑bar; tuning is approximate, not vectorized.
- Large grids increase execution time.
- Results are historical and NOT predictive.
- Not suitable for live auto‑optimization.
Summary
This script is best viewed as a *research tool first, strategy second*. Use it to discover stable Fast/Slow regimes, then lock them in for simple, repeatable trading.

SMC Post-Analysis Lab [PhenLabs]📊 SMC Post-Analysis Lab
Version: PineScript™ v6
📌 Description
The SMC Post-Analysis Lab is a dedicated hindsight analysis tool built for traders who want to understand what really happened during any historical trading period. Unlike forward-looking indicators, this tool lets you scroll back through time and instantly receive algorithmic classification of market states using Smart Money Concepts methodology.
Whether you’re reviewing a losing trade, studying a successful session, or building your pattern recognition skills, this indicator provides immediate context. The expansion-aware algorithm processes price action within your selected window and outputs clear, actionable classifications ranging from Parabolic Expansion to Consolidation Inducements.
Stop relying on subjective post-trade analysis. Let the algorithm objectively tell you whether institutional players were accumulating, distributing, or running inducements during your trades.
🚀 Points of Innovation
First indicator specifically designed for SMC-based post-trade review rather than live signal generation
Dual-mode analysis system allowing both dynamic scrollback and precise date selection
Expansion-aware classification algorithm that weighs range position against net displacement
Real-time efficiency metrics calculating directional quality of price movement
Integrated visual FVG detection within the analysis window only
Interactive table with clickable date range adjustment via chart interface
🔧 Core Components
Pivot Detection Engine: Uses configurable pivot length to identify significant swing highs and lows for structure break detection
Window Calculator: Determines active analysis zone based on either bar offset or timestamp boundaries
Data Aggregator: Tracks window open, high, low, close and counts bullish/bearish structure break events
State Classification Algorithm: Applies hierarchical logic to determine market state from six possible classifications
Visual Renderer: Draws structure breaks, FVG boxes, and window highlighting within the active zone
🔥 Key Features
Sliding Window Mode: Use the Scroll Back slider to dynamically move your analysis zone backwards through history bar-by-bar
Date Range Mode: Select specific start and end timestamps for precise session or trade review
Six Market State Classifications: Parabolic Expansion (Bull/Bear), Bullish/Bearish Order Flow, Accumulation/Distribution Reversal, and Consolidation/Inducement
Range Position Percentile: See exactly where price closed relative to the window’s high-low range as a percentage
Bull/Bear Event Counter: Quantified count of structure breaks in each direction during the analysis period
Efficiency Calculation: Net move divided by total range reveals trending quality versus chop
🎨 Visualization
Blue Window Highlight: Active analysis zone is clearly marked with blue background shading on the chart
Structure Break Lines: Dashed lines appear at each bullish or bearish structure break within the window
FVG Boxes: Fair Value Gaps automatically render as semi-transparent boxes in bullish or bearish colors
Dashboard Table: Top-right positioned table displays State, Analysis description, and Metrics in real-time
Color-Coded States: Each classification uses distinct coloring for immediate visual recognition
Interactive Tip Row: Optional help text guides users on clicking the table to adjust date range
📖 Usage Guidelines
General Configuration
Analysis Mode: Default is Sliding Window. Choose Date Range for specific timestamp analysis.
Sliding Window Settings
Scroll Back (Bars): Default 0. Increase to move window backwards into history.
Window Width (Bars): Default 100. Range 20-50 for scalping, 100+ for swing analysis.
Date Range Settings
Start Date: Select the beginning timestamp for your analysis period.
End Date: Select the ending timestamp for your analysis period.
Visual Settings
Show Help Tip: Default true. Toggle to hide instructional row in dashboard.
Bullish Color: Default teal. Customize for bullish elements.
Bearish Color: Default red. Customize for bearish elements.
SMC Parameters
Pivot Length: Default 5. Lower values (3-5) catch minor breaks. Higher values (10+) focus on major swings.
✅ Best Use Cases
Post-trade review to understand why entries succeeded or failed
Session analysis to identify institutional activity patterns
Trade journaling with objective algorithmic classifications
Pattern recognition training through historical scrollback
Identifying whether stop hunts were inducements or legitimate breaks
Comparing your real-time read versus what the algorithm detected
⚠️ Limitations
Designed for historical analysis only, not live trade signals
Classification accuracy depends on appropriate pivot length for the timeframe
FVG detection uses simple gap logic without mitigation tracking
State classification is based on window data only, not broader context
Requires manual scrolling or date input to review different periods
💡 What Makes This Unique
Purpose-Built for Review: Unlike most indicators focused on live signals, this is designed specifically for post-trade analysis
Expansion-Aware Logic: Algorithm weighs both position in range AND directional efficiency for accurate state detection
Interactive Date Control: Click the dashboard table to reveal draggable anchors for window adjustment directly on chart
🔬 How It Works
1. Window Definition:
User selects either Sliding Window or Date Range mode
System calculates which bars fall within the active analysis zone
Active zone receives blue background highlighting
2. Data Collection:
Algorithm captures window open, running high, running low, and current close
Structure breaks are detected when price crosses above last pivot high or below last pivot low
Bullish and bearish events are counted separately
3. State Classification:
Range Position calculates where close sits as percentage of high-low range
Efficiency calculates net move divided by total range
Hierarchical logic applies priority rules from Parabolic states down to Consolidation
4. Output Rendering:
Dashboard table updates with State title, Analysis description, and Metrics
Visual elements render within window only to keep chart clean
Colors reflect bullish, bearish, or neutral classification
💡 Note:
This indicator is intended for educational and review purposes. Use it to develop your understanding of Smart Money Concepts by analyzing what institutional order flow looked like during historical periods. Combine insights with your own analysis methodology for best results.

MACD-v Bullish/Bearish DivergenceMACD-v Bullish/Bearish Divergence
Overview This indicator is a specialized divergence detector based on the MACD-v (Volatility Normalized Momentum) concept. Unlike standard MACD which uses absolute price differences, MACD-v normalizes values against volatility (ATR), allowing for fixed, universal Overbought/Oversold thresholds across all assets and timeframes.
Recommendation: This script is highly effective when paired with the original MACD-v by Alex Spiroglou. While this indicator focuses on identifying and visualizing divergence entries, using the original oscillator alongside it provides the best visual context for the overall momentum structure.
How It Works
This tool uses a dual-signal mechanism (Raw Line + Signal Smooth) to identify specific divergence setups:
Setup (Yellow/Blue Dots): Identifies when price momentum has extended significantly into extreme zones (Overbought/Oversold).
Trigger (Red/Green Dots): Fires when price fails to make a new momentum extreme despite price action (classic divergence/failure swing).
Active State (Background Color): Once a trigger fires, the background highlights (Red for Bearish, Green for Bullish) to indicate an active divergence play.
Reset (Exit): The signal state clears when momentum returns to the neutral "safe zone."
Important Note: Momentum Washout
The colored background persists as long as the divergence trade remains valid. Traders should note the concept of "Momentum Washout":
Signal End: The background color turns off when the MACD returns to the neutral range, indicating the primary high-velocity impulse is over.
Performance Continuation: Significant positive or negative price performance can often continue even after the background signal ends. This period allows the remaining momentum to "wash out" or drift before the next major impulse.
Strategy Tip: The indicator is designed to capture the high-volatility portion of the reversal. Do not assume the end of the signal is the absolute top or bottom of the trend; it simply marks the normalization of momentum.
Strategy Recommendation: Multi-Timeframe Analysis
Divergence signals are most powerful when confirmed across timeframes. It is highly recommended to look for alignment before taking a trade:
Trend Confirmation: If you see a signal on a lower timeframe (e.g., 5m or 15m), check a higher timeframe (e.g., 1H or 4H). A bullish divergence on the 5m is significantly more reliable if the 1H momentum is already bullish or oversold.
Signal Stacking: Valid signals often appear sequentially—first on the 1m, then the 5m, and finally the 15m. Waiting for this "cascade" can filter out false reversals.
Visual Guide
🔵 Blue Dot: Bullish Divergence Setup (Watch for entry).
🟢 Green Dot: Bullish Divergence Trigger (Long Entry).
🟡 Yellow Dot: Bearish Divergence Setup (Watch for entry).
🔴 Red Dot: Bearish Divergence Trigger (Short Entry).
Background Color: Indicates an active trade (Red = Bearish / Green = Bullish).
Settings
Auto-Detect: Automatically switches between Scalping settings (tighter thresholds) for low timeframes and Swing settings for high timeframes.
Strict Invalidation: If enabled, cancels a setup if momentum pushes too far in the opposite direction before triggering.
Active Signal Multiplier: Dynamically smooths the signal line only when a trade is active to prevent premature exits during choppy corrections.
Disclaimer: This tool is for educational purposes and trend analysis only. Always manage your risk appropriately.

Elite Net Cash by Mashrab🚀 Elite Net Cash Dashboard code by Mashrab
Stop switching tabs. Get the full fundamental picture instantly.
This dual-panel dashboard puts institutional-grade data right on your chart. It splits the "heavy math" from the "market context," giving you a clean, professional view of a company's true value and trading personality.
🔥 Why You’ll Love It
Two Smart Tables:
Financials: See the health check immediately—Net Cash, Cash Backed %, Free Cash Flow, and Revenue Growth.
Profile: Know who you are trading—Market Cap (with auto-class like "Mega" or "Small"), Volatility (ADR), and Sector.
Auto-ETF Mapping: It automatically tags the sector with its matching ETF (e.g., Technology (XLK)). Perfect for quickly checking relative strength!
Volatility Alerts: The ADR (Average Daily Range) turns Yellow if the stock moves more than 5% a day. Know the risk before you size your position.
Minimalist Mode: Want a clean chart? Uncheck the "Borders" box in settings for a sleek, text-only floating display.
🎯 How to Trade It
Check the Green: Look at the Financials table. Green numbers mean the company is cash-rich and growing.
Check the Moves: Look at the Profile table. High ADR means expect wild swings; Mega Cap means steady stability.
Check the Sector: Use the ETF tag to see if the whole industry is moving or just this stock.
⚙️ Make It Yours
Split the View: Put Financials top-right and Profile bottom-right (or anywhere else).
Style It: Toggle borders on/off and pick your colors.

Advanced Multi-Level S/R ZonesAdvanced Multi-Level S/R Zones: The Comprehensive Guide
1. Introduction: The Evolution of Support & Resistance:
Support and Resistance (S/R) is the backbone of technical analysis. However, traditional methods of drawing these levels are often plagued by subjectivity. Two traders looking at the same chart will often draw two different lines. Furthermore, standard indicators often treat every price point equally, ignoring the critical context of Volume and Time.
The Advanced Multi-Level S/R Zones script represents a paradigm shift. It moves away from subjective line drawing and toward Quantitative Zoning. By utilizing statistical measures of variability (Standard Deviation, MAD, IQR) combined with Volume-Weighting and Time-Decay algorithms, this tool identifies where price is mathematically most likely to react. It treats S/R not as thin lines, but as dynamic zones of probability.
2. Core Logic and Mathematical Foundation:
To understand how to use this tool optimally, one must understand the "engine" under the hood. The script operates on four distinct pillars of logic:
A. Session-Based Data Collection:
The script does not look at every single tick. Instead, it aggregates data into "Sessions" (daily bars by default logic). It extracts the High, Low, and Total Volume for every session within the user-defined lookback period. This filters out intraday noise and focuses on the macro structure of the market.
B. Adaptive Statistical Variability:
Most Bollinger Band-style indicators use Standard Deviation (StdDev) to measure width. However, StdDev is heavily influenced by outliers (extreme wicks). This script offers a sophisticated Adaptive Method-Skewness Detection: The script calculates the skewness of the price distribution. Adaptive Selection: If the data is highly skewed (lots of outliers, typical in Crypto), it switches to MAD (Median Absolute Deviation). MAD is robust and ignores outliers. If the data is moderately skewed, it uses IQR (Interquartile Range). If the data is normal (Gaussian), it uses StdDev.
Benefit: This ensures the zone widths are accurate regardless of whether you are trading a stable Forex pair or a volatile Altcoin.
C. The Weighting Engine (Volume + Time)
Not all price history is equal. This script assigns a "Weight Score" to every session based on two factors:
Volume Weighting: Sessions with massive volume (institutional activity) are given higher importance. A high formed on low volume is less significant than a high formed on peak volume.
Time Decay: Recent price action is more relevant than price action from 50 bars ago. The script applies a decay factor (default 0.85). This means a session from yesterday has 100% impact, while a session from 10 days ago has significantly less influence on the zone calculation.
D. Clustering Algorithm
Once the data is weighted, the script runs a clustering algorithm. It looks for price levels where multiple session Highs (for Resistance) or Lows (for Support) congregate.
It requires a minimum number of points to form a zone (User Input: minPoints).
It merges nearby levels based on the Cluster Separation Factor.
This results in "Primary," "Secondary," and "Tertiary" zones based on the strength and quantity of data points in that cluster.
3. Detailed Features and Inputs Breakdown:
Group 1: Main Settings
Lookback Sessions (Default: 10): Defines how far back the script looks for pivots. A higher number (e.g., 50) creates long-term structural zones. A lower number (e.g., 5) creates short-term scalping zones.
Variability Method (Adaptive): As described above, leave this on "Adaptive" for the best results across different assets.
Zone Width Multiplier (Default: 0.75): Controls the vertical thickness of the zones. Increase this to 1.0 or 1.5 for highly volatile assets to ensure you catch the wicks.
Minimum Points per Zone: The strictness filter. If set to 3, a price level must be hit 3 times within the lookback to generate a zone. Higher numbers = fewer, but stronger zones.
Group 2: Weighting
Volume-Weighted Zones: Crucial for identifying "Smart Money" levels. Keep this TRUE.
Time Decay: Ensures the zones update dynamically. If price moves away from a level for a long time, the zone will fade in significance.
ATR-Normalized Zone Width: This is a dynamic volatility filter. If TRUE, the zone width expands and contracts based on the Average True Range. This is vital for maintaining accuracy during market breakouts or crashes.
Group 3: Zone Strength & Scoring
The script calculates a "Score" (0-100%) for every zone based on:
-Point Count: More hits = higher score.
-Touches: How many times price wicked into the zone recently.
-Intact Status: Has the zone been broken?
-Weight: Volume/Time weight of the constituent points.
-Track Zone Touches: Looks back n bars to see how often price respected this level.
-Touch Threshold: The sensitivity for counting a "touch."
Group 4: Visuals & Display
Extend Bars: How far to the right the boxes are drawn.
Show Labels: Displays the Score, Tier (Primary/Secondary), and Status (Retesting).
Detect Pivot Zones (Overlap): This is a killer feature. It detects where a Support Zone overlaps with a Resistance Zone.
Significance: These are "Flip Zones" (Old Resistance becomes New Support). They are colored differently (Orange by default) and represent high-probability entry areas.
Group 5: Signals & Alerts
Entry Signals: Plots Buy/Sell labels when price rejects a zone.
Detect Break & Retest: specifically looks for the "Break -> Pullback -> Bounce" pattern, labeled as "RETEST BUY/SELL".
Proximity Alert: Triggers when price gets within x% of a zone.
4. Understanding the Visuals (Interpreting the Chart)
When you load the script, you will see several visual elements. Here is how to read them:
The Boxes (Zones)
Red Shades: Resistance Zones.
Dark Red (Solid Border): Primary Resistance. The strongest wall.
Lighter Red (Dashed Border): Secondary/Tertiary. Weaker, but still relevant.
Green Shades: Support Zones.
Dark Green (Solid Border): Primary Support. The strongest floor.
Orange Boxes: Pivot Zones. These are areas where price has historically reacted as both support and resistance. These are the "Line in the Sand" for trend direction.
The Labels & Emojis
The script assigns emojis to zone strength:
🔥 (Fire): Score > 80%. A massive level. Expect a strong reaction.
⭐ (Star): Score > 60%. A solid structural level.
✓ (Check): Score > 40%. A standard level.
"⟳ RETESTING": Appears when a zone was broken, and price is currently pulling back to test it from the other side.
The Dashboard (Top Right)
A statistics table provides a "Head-Up Display" for the asset:
High/Low σ (Sigma): The variability of the highs and lows. If High σ is much larger than Low σ, it implies the tops are erratic (wicks) while bottoms are clean (flat).
Method: Shows which statistical method the Adaptive engine selected (e.g., "MAD (auto)").
ATR: Current volatility value used for normalization.
5. Strategies for Optimum Output
To get the most out of this script, you should not just blindly follow the lines. Use these specific strategies:
Strategy A: The "Zone Fade" (Range Trading)
This works best in sideways markets.
Identify a Primary Support (Green) and Primary Resistance (Red).
Wait for price to enter the zone.
Look for the "SUPPORT BOUNCE" or "RESISTANCE REJECTION" signal label.
Entry: Enter against the zone (Buy at support, Sell at resistance).
Stop Loss: Place just outside the zone width. Because the zones are calculated using volatility stats, a break of the zone usually means the trade is invalid.
Strategy B: The "Pivot Flip" (Trend Following)
This is the highest probability setup in trending markets.
Look for an Orange Pivot Zone.
Wait for price to break through a Resistance Zone cleanly.
Wait for the price to return to that zone (which may now turn Orange or act as Support).
Look for the "RETEST BUY" label.
Logic: Old resistance becoming new support is a classic sign of trend continuation. The script automates the detection of this exact geometric phenomenon.
Strategy C: The Volatility Squeeze
Look at the Dashboard. Compare High σ and Low σ.
If the values are dropping rapidly or becoming very small, the zones will contract (become narrow).
Narrow zones indicate a "Squeeze" or compression in price.
Prepare for a violent breakout. Do not fade (trade against) narrow zones; look to trade the breakout.
6. Optimization & Customization Guide
Different markets require different settings. Here is how to tune the script:
For Crypto & Volatile Stocks (Tesla, Nvidia)
Method: Set to Adaptive (Mandatory, as these assets have "Fat Tails").
Multiplier: Increase to 1.0 - 1.25. Crypto wicks are deep; you need wider zones to avoid getting stopped out prematurely.
Lookback: 20-30 sessions. Crypto has a long memory; short lookbacks generate too much noise.
For Forex (EURUSD, GBPJPY)
Method: You can force StdDev or IQR. Forex is more mean-reverting and Gaussian.
Multiplier: Decrease to 0.5 - 0.75. Forex levels are often very precise to the pip.
Volume Weighting: You may turn this OFF for Forex if your broker's volume data is unreliable (since Forex has no centralized volume), though tick volume often works fine.
For Scalping (1m - 15m Timeframes)
Lookback: Decrease to 5-10. You only care about the immediate session history.
Decay Factor: Decrease to 0.5. You want the script to forget about yesterday's price action very quickly.
Touch Lookback: Decrease to 20 bars.
For Swing Trading (4H - Daily Timeframes)
Lookback: Increase to 50.
Decay Factor: Increase to 0.95. Structural levels from weeks ago are still highly relevant.
Min Points: Increase to 3 or 4. Only show levels that have been tested multiple times.
7. Advantages Over Standard Tools:
Feature Standard S/R Indicator, Advanced Multi-Level S/R Calculation, Uses simple Pivots or Fractals, Uses Statistical Distributions (MAD/IQR). Zone Width Arbitrary or Fixed Adaptive based on Volatility & ATR.
Context Ignores Volume Volume Weighted (Smart Money tracking).
Time Relevance Old levels = New levels Time Decay (Recency bias applied).
Overlaps Usually ignores overlaps Detects Pivot Zones (Res/Sup Flip).
Scoring None 0-100% Strength Score per zone.
8. Conclusion:
The Advanced Multi-Level S/R Zones script is not just a drawing tool; it is a statistical analysis engine. By accounting for the skewness of data, the volume behind the moves, and the decay of time, it provides a strictly objective roadmap of the market structure.
For the optimum output, combine the Pivot Zone identification with the Retest Signals. This aligns you with the underlying flow of order blocks and prevents trading against the statistical probabilities of the market.

Impulsive Trend Detector [dtAlgo]This advanced Pine Script indicator identifies and tracks impulsive price movements based on Break of Structure (BOS) and Change of Character (CHoCH) concepts from Smart Money trading methodology.
The indicator automatically detects pivot highs and lows, then monitors when price breaks these key levels to signal potential impulsive moves. BOS indicates continuation in the current trend direction, while CHoCH signals potential trend reversals. Each detected move is measured from the break point to the next opposing pivot, providing accurate percentage calculations that match TradingView's measuring tool.
Impulsive moves are categorized into four levels based on magnitude (Level 1: 5-10%, Level 2: 10-15%, Level 3: 15-20%, Level 4: 20%+), with color-coded visual labels and connecting lines displayed directly on the chart.
Comprehensive Session Analysis:
Track moves across 11 distinct trading sessions in Eastern Time: Pre-London/NY, London/NY overlap, NY (with Power Hour and End subdivisions), Sydney, Asia, Sake Time, Asia/London overlap, London, Weekend, and No Session periods.
Three Dynamic Tables provide:
Real-time statistics (bullish/bearish, BOS/CHoCH, levels)
Session breakdown with move counts and average percentages
Event log showing last 10 moves with date, day, session, direction, type, level, percentage, duration, and bar count
Perfect for Smart Money traders seeking data-driven insights into market structure behavior across global trading sessions.

3IC//@version=5
indicator("3IC", overlay=true)
// 3 Inside Candle logic
inside_2 = high < high and low > low
inside_3 = high < high and low > low
three_inside = inside_2 and inside_3
plotshape(three_inside, title="3 Inside Candles", style=shape.triangleup, location=location.belowbar, color=color.yellow, size=size.small)

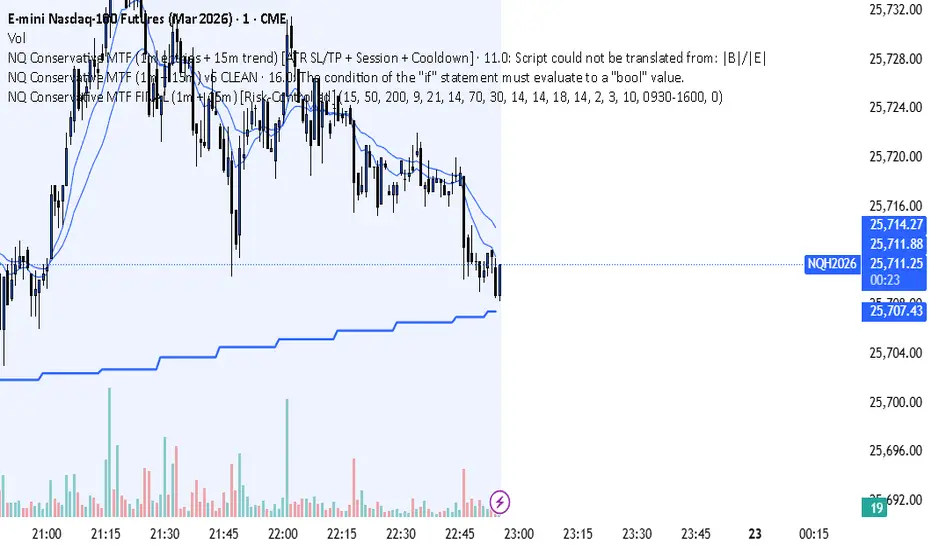
NQ Conservative MTF FINAL (1m + 15m) [Risk-Controlled]Strategy Description
This is a conservative multi-timeframe futures strategy designed for the NASDAQ-100 (NQ). Trades are taken on the 1-minute chart only in the direction of the confirmed 15-minute trend, defined by moving averages and momentum strength. Entries occur after short-term pullbacks, using EMA alignment and RSI confirmation to avoid chasing price. Risk is managed with an ATR-based stop loss and take-profit, limiting per-trade risk while allowing larger trend winners to run. The strategy emphasizes capital preservation, controlled drawdowns, and consistency over high trade frequency.
Sector Rotation ULTIMATE: 7 Narrativas IndependientesSector Rotation ULTIMATE: Crypto Narrative Rotation (7 Independent Sectors)
Advanced indicator displaying the relative strength of major crypto sectors through 7 independently normalized lines (0-100):
• Layer1 (ETH, SOL, BNB, TON, etc.) - Pink
• Enterprise (XRP, HBAR, XLM, QNT, VET) - Yellow
• DeFi (UNI, AAVE, MKR, LDO, CRV, etc.) - Cyan
• Memecoins (SHIB, DOGE, PEPE, WIF, FLOKI, BONK) - Green
• AI (TAO, FET, ICP, GRT, etc.) - Orange
• L2 / Scalability (ARB, OP, MATIC, STRK) - Purple
• RWA + Infra (ONDO, LINK) - Brown
Each sector sums the dominance of its top coins (40 total) and is normalized independently so the lines cross constantly, revealing real capital rotations.
- Colored fills to visually highlight the leading sector
- Works perfectly on any timeframe (clean daily data, no intraday noise)
- Ideal for spotting altseason, sector rotations, and entry timing
Use on CRYPTOCAP:TOTAL. The definitive narrative oscillator for 2026!
#Crypto #Altcoins #SectorRotation #DeFi #Memecoins #AI #RWA

Volume-Weighted Fibonacci PivotThis indicator automatically plots dynamic Fibonacci retracement and extension levels based on a volume-weighted pivot point within a user-defined lookback period or date range. It intelligently calculates a central "pivot" price biased toward high-volume bars, then draws symmetric levels both upward (extensions) and downward (retracements) for balanced confluence analysis.
How It Works (Technical Methodology)
Lookback Period Determination
Multiple filter modes control the data range used for calculations:
"Last X Bars": Fixed number of recent bars (default 400, max 4999).
"Manual Date": User-specified start date.
"Interactive (Chart)": Confirmed start date via input.
"None": Full available history (falls back to max bars).
Optionally, when using "Last X Bars", calculations can pull data from a higher/lower user-selected timeframe via request.security() for multi-timeframe alignment.
A dotted vertical line marks the start point in date-based modes.
Range and Pivot Calculation
Within the selected period:
Highest high and lowest low define the full price range.
Average volume is computed across the period.
Volume-Weighted Pivot: Average close price only from bars where volume > average volume (fallback to simple midpoint if no high-volume bars).
This creates a "smart" central pivot that leans toward areas of greater participation, often aligning with institutional activity.
Fibonacci Level Generation
User-configurable ratios (default: 0.236, 0.382, 0.5, 0.618, 0.786, 1.0, 1.272, 1.414, 1.618).
Levels are calculated symmetrically around the volume-weighted pivot:
Upward: Pivot + (Range × Ratio × Correction Factor) – teal/cyan shades.
Downward: Pivot - (Range × Ratio × Correction Factor) – red shades.
Correction Factor (default 0.5): Scales level spacing for tighter/wider grids without altering ratios.
Only the user-defined number of active lines (default 9) are drawn.
Visual Construction
Central Pivot Line: Thick yellow horizontal line with label showing exact price.
Up/Down Levels: Dashed lines extended into the future, labeled with ratio direction ("Up" or "Dn").
All objects redraw only on the last bar for performance, clearing previous drawings.
Multi-Timeframe Option
When enabled with "Last X Bars":
Pulls high/low/volume data from specified timeframe.
Aligns the pivot and levels to higher-timeframe structure while displaying on current chart – ideal for intraday traders seeking HTF confluence.
How to Use
This tool provides clean, volume-aware Fibonacci grids for identifying potential support/resistance, reversal zones, and targets.
Volume-Weighted Pivot: Often acts as a strong mean reversion level or fair value area.
Upward Levels (Teal): Potential resistance/extensions in bullish moves; watch for reactions on retests.
Downward Levels (Red): Potential support/retracements in bearish moves.
Confluence: High probability when price reacts at levels aligning with other tools (order blocks, pivots, volume profile).
Correction Factor: Lower values (<0.5) for tighter grids in ranging markets; higher (>0.5) for trending markets.
Multi-Timeframe Mode: Use on lower charts (e.g., 15m) with HTF input (e.g., 4H or Daily) to project major structure levels.
Common Setups:
Pullbacks to 0.618–0.786 zones for continuation entries.
Breaks beyond 1.0–1.618 for extension targets.
Reactions near pivot line for mean reversion trades.
Adjust ratios and active line count to match your preferred Fibonacci style (classic retracement vs. extensions).
Disclaimer
This indicator is a technical analysis tool and should be used in conjunction with other forms of analysis. Past performance does not guarantee future results. Always use proper risk management.
