Trendlines 2x ver. 5 plus GMMA modifiedthis is a copy of "Trendlines 2x +" Script by Lij_MC (but converted to Version 5 of Pine script), which draws trendlines from the pivot points in the price chart and also add some arrows from "Guppy Multiple Moving Averages" Indicator by optictropic for trend confirmation.
I Change this code from Pine script 4 to 5 to add some functionalities to it.
Some adjustments of parameters have been made by me to easy recognition of Trendline breaks.
These parameters are in the original code, but I make them default for nicer look of the indicator and easier recognition of Trendline breaks.
for example, breaking the primary trendlines are shown by color change of the candles and in the same time by a Break symbol as a label.
breaking the secondary trendlines are shown only by candle color. Extension of the secondary trendlines are set to 50 candles to better recognize the past trendlines .
color candles are set to default to easily see the trend direction of the chart.
I have also added some arrows by the help of "Guppy Multiple Moving Averages" indicator by optictropic, that can be used for confirmation of trend direction.
I think this can represent good looking trend direction and trendline breaks can help traders for a better trade decision.
for better trading with this indicator, buy when you have green or lime color for candles, and GMMA gives UP long arrow signals, check higher time frames, and at last, this is only a help but not a final decision making indicator. you must have your own price action analysis.
best wishes
在腳本中搜尋"trend"
Trend Following based on Trend ConfidenceThis is a Trend Following strategy based on the Trend Confidence indicator.
The goal of this strategy is to be a simple Trend Following strategy, but also to be as precise as possible when it comes to the question 'how confident are we that a linear trend is ongoing?'. For this we calculate the 'confidence' of a linear trend in the past number of closing prices. The idea of this strategy is that past a certain confidence, the ongoing linear trend is more likely to continue than not.
Trend Confidence:
The Trend Confidence shows us how strong of a linear trend the price has made in the past number (given by Length parameter) of closing prices. The steepness of the price change makes the Trend Confidence more extreme (more positive for an uptrend or more negative for a downtrend), and the deviation from a straight line makes the Trend Confidence less extreme (brings the confidence closer to 0). This way we can filter out signals by wild/sudden price moves that don't follow a clear linear trend.
Math behind the Trend Confidence:
A linear fit is made on the past number of closing prices, using Ordinary Linear Regression. We have the steepness of the linear fit: b in y=a+bx . And we have the standard deviation of the distances from the closing prices to the linear fit: sd . The Trend Confidence is the ratio b/sd .
Entries and Exits:
For entry and exit points we look at how extreme the Trend Confidence is. The strategy is based on the assumption that past a certain confidence level, the ongoing linear trend is more likely to continue than not.
So when the Trend Confidence passes above the 'Long entry" threshold, we go Long. After that when the Trend Confidence passes under the 'Long exit' threshold, we exit. The Long entry should be a positive value so that we go Long once a linear uptrend with enough confidence has been detected.
When the Trend Confidence passes below the 'Short entry' threshold, we go Short. After that when the Trend Confidence passes above the 'Short exit' threshold, we exit. The Short entry should be a negative value so that we go Short once a linear downtrend with enough confidence has been detected.
Default Parameters:
The strategy is intended for BTC-USD market, 4 hour timeframe. The strategy also works on ETH-USD with similar parameters.
The Length is arbitrarily set at 30, this means we look at the past 30 closing prices to determine a linear trend. Note that changing the length will change the range of Trend Confidence values encountered.
The default entry and exit thresholds for Longs and Shorts do not mirror each other. This is because the BTC-USD market goes up more heavily and more often than it goes down. So the ideal parameters for Longs and Shorts are not the same.
The positive results of the strategy remain when the parameters are slightly changed (robustness check).
The strategy uses 100% equity per trade, but has a 10% stop loss so that a maximum of 10% is risked per trade.
Commission is set at 0.1% as is the highest commission for most crypto exchanges.
Slippage is set at 5 ticks, source for this is theblock.co.

Multi MA Trend Following Strategy TemplateTrend following is one of the better known technical trading strategies. But, which trend should you follow? Today I am sharing with the community a trend following template script that includes a selection of over 20 different trends / regressions. Some of these are in the Pine library, and some have been custom coded and contributed over time by the beloved Pine Coder community.
How it works:
This template will plot any of the 20+ trends that you can select in the settings. The strategy component will buy if the trend line is moving up, and will sell if it moves down. If the line is green that indicates that the trend is higher than the prior bar. If the line is red that indicates that the trend is lower than the prior bar. This script is different from many moving average scripts in that it follows the trend itself and doesn't look for a cross of multiple trends.
How to use it:
When wanting to trend follow an instrument, you can use this template to help identify what approach you might want to take and/or which indicator you might want to use. You can also modify the strategy as you see fit and make use of the 20+ incorporated indicators. Incorporate your trade and risk management strategy, or use it as an indicator.
Disclaimer: Open source scripts I publish in the community are largely meant to spark ideas that can be used as building blocks for part of a more robust trade management strategy. Even though this example script might beat buy and hold over the back-test time-frame, I wouldn't advise using it as a stand-alone strategy without significant additions/modifications to the strategy and risk management functions.

Trend Type Indicator by BobRivera990Usage:
The purpose of this indicator is to programmatically determine the type of price trend using technical analysis tools.
You can do a quick check on the asset’s higher and lower time frames. For example, if you are trading on an H1 chart, you can check the m5 chart to ensure that the trend is in the same direction and similarly check the H4 chart to ensure that the higher time frame price is also moving in the same direction.
If multiple time frame charts confirm a similar trend, then it is considered a very strong trend and ideal for Trend trading.
Remarks:
By default, the last status is related to 8 periods before the latest closing price.
Related definitions:
The three basic types of trends are up, down, and sideways.
1. Uptrend
An uptrend describes the price movement of a financial asset when the overall direction is upward. The uptrend is composed of higher swing lows and higher swing highs.
Some market participants ("long" trend traders) only choose to trade during uptrends.
2. Downtrend
A downtrend refers to the price action of a security that moves lower in price as it fluctuates over time.
The downtrend is composed of lower swing lows and lower swing highs.
3. Sideways
A sideways trend is the horizontal price movement that occurs when the forces of supply and demand are nearly equal. This typically occurs during a period of consolidation before the price continues a prior trend or reverses into a new trend.
How it works:
Step 1: Sideways Trend Detection
In this step we want to distinguish the sideways trend from uptrend and downtrend. For this purpose, we use two common technical analysis tools: ATR and ADX
1. Average True Range (ATR)
The average true range (ATR) is a technical analysis indicator that measures market volatility.
We also use a 20-period moving average of the ATR.
When the ATR is below the average of its last 20-periods, it means that the rate of price volatility has decreased and we conclude that the current trend is sideways
2. Average Directional Index (ADX)
The average directional index (ADX) is a technical analysis indicator used by some traders to determine the strength of a trend.
The trend has strength when ADX is above 25.
So when the ADX is less than or equal to 25, there is no strong trend, and we conclude that the current type of trend is sideways.
Step 2: Detect uptrend from downtrend
If it turns out that the current price trend is not sideways, then it is either uptrend or downtrend.
For this purpose, we use plus and minus directional Indicators (+ DI & -DI).
A general interpretation would be that during a strong trend, when +DI is higher than -DI, it is an uptrend. When -DI is higher than +DI, it is a downtrend.
Parameters:
"Use ATR …" ________________________// Use Average True Range (ATR) to detect Sideways Movements
"ATR Length"_______________________ // length of the Average True Range (ATR) used to detect Sideways Movements
"ATR Moving Average Type" ___________// Type of the moving average of the ATR used to detect Sideways Movements
"ATR MA Length" ____________________// length of the moving average of the ATR used to detect Sideways Movements
"Use ADX ..."_______________________ // Use Average Directional Index (ADX) to detect Sideways Movements
"ADX Smoothing”____________________// length of the Average Directional Index (ADX) used to detect Sideways Movements
"DI Length"_________________________// length of the Plus and Minus Directional Indicators (+DI & -DI) used to determine the direction of the trend
"ADX Limit" ________________________// A level of ADX used as the boundary between Trend Market and Sideways Market
"Smoothing Factor"__________________// Factor used for smoothing the oscillator
"Lag"______________________________// lag used to match indicator and chart
Resources:
www.investopedia.com

Trendy Bar Trend Color LiteLite version of the original Trendy Bar Trend Color
This will only color the candlestick body of your chart
Can be used with solid, hollow, renko, or any other chart type
Custom coloring for Highs, Lows, and consolidation is removed

Trends & RangesTrends & Ranges uses EMA ATR bands as a SuperTrend indicator.
How to use:
This indicator can be used to give you a direction bias, with the added function to create ranges which often lead to reversals or flat trading periods. Trade the break-out or wait for pull backs in the direction of the trend.
I'm not great at explaining stuff and will probably make things only more complicated, so I won't bother for now,
but if you have a question on how the script works I will gladly give it a try.
The option "Flexible Trends" will disable the min/max function (trailing or non trailing).
Flexible Trends enabled:
Flexible Trends disabled:
Settings are not optimized for any asset or time frame, you will have to do that for yourself. Feel free to share them in the comments.
Thanks for showing interest, enjoy and good luck! :)

Trend spider glueThis script works on all market types.
This script will show you when to long, short, exit (stop loss) and Take profit.
Signals take into account various elements such as momentum, volume , moving averages and long term trend analysis. Stop loss function is included to show you when a signal is invalidated.
Use this strategy strictly, patiently and with discipline to prevent unneeded losses, this will result in long term consistent profits.
This script has been set to work best on the intraday time frames, however it also works on the longer timeframes. Use the settings tab to dilute the indicators to ur own market.
Lastly, this indicator will not give signals if the market is not trending.
PM me here to get a free trial for the indicator !
HAPPY TRADING <3
Version 2 will be coming soon which will integerate more elements to allow for more accurate signals and faster stop losses !
disclaimer: although this indicator is taking many elements into account and is highly accurate the market is never certain, we are not responsible for any losses the script may result in as we are not financial advisors.

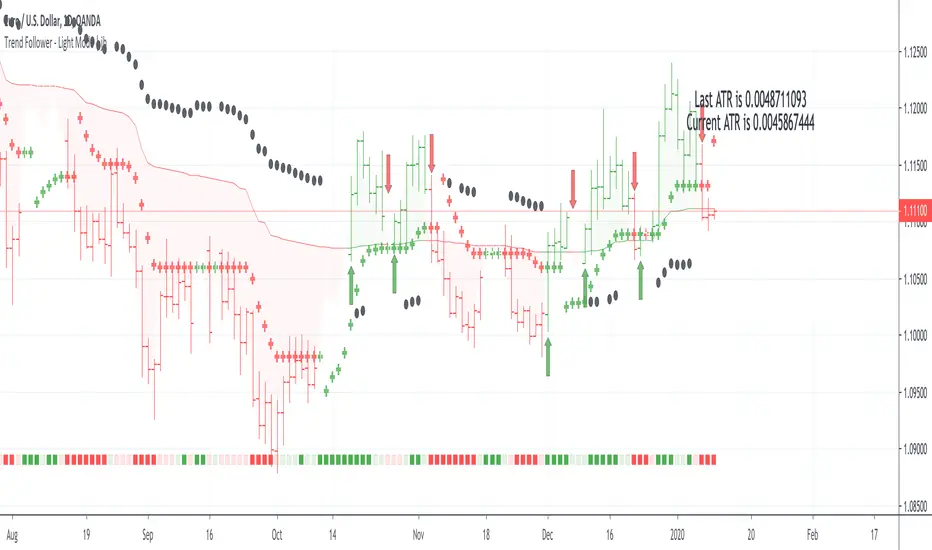
Trend Follower - Light Mode | jhFollow up script for my Trend Follower script.
I'm used to dark mode, so I coded a few key plots in white, so those are changed into black on the script.
Notably:
- > 1 ATR in black dots along the baseline
- Current and previous ATR text labels to the right of the price
- A text label spacing input that allows you to adjust the spacing for text label from price.
This is a trend following system that combines 3 indicators which provide different functionalities, also a concept conceived by VP's No Nonsense FX / NNFX method.
1. Baseline
The main baseline filter is an indicator called Modular Filter created by Alex Grover
- www.tradingview.com
- Alex Grover - Modular Filter
-------
That's the moving average like baseline following price, filtering long and short trends and providing entry signals when the price crosses the baseline.
Entry signal indicated with arrows.
2. Volume/Volatility, I will called it Trend Strength
The next indicator is commonly known as ASH, Absolute Strength Histogram.
This indicator was shared by VP as a two line cross trend confirmation indicator, however I discovered an interesting property when I modified the calculation of the histogram.
- Alex Grover Absolute Strength
-------
My modification and other info here
- Absolute Strength Histogram v2
-------
I simplified the display of the trend strength by plotting squares at the bottom of the chart.
- Lighted Squares shows strength
- Dimmed Squares shows weakness
3. Second Confirmation / Exits / Trailing Stop
Finally the last indicator is my usage of QQE (Qualitative Quantitative Estimation), demonstrated in my QQE Trailing Line Indicator
- QQE Trailing Line for Trailing Stop
-------
Three usages of this amazing indicator, serving as :
- Second trend confirmation
- Exit signal when price crosses the trailing line
- Trailing stop when you scaled out the second trade
This indicator is plotted with crosses.
Additional plots and information
Bar Color
- Green for longs, Red for shorts, White when the baseline direction conflicts with the QQE trailing line direction
- When it's white, it's usually ranging and not trending, ASH will also keep you off ranging periods.
-------
ATR Filter
- White circles along the baseline, they will show up if the price has moved more than one ATR from the baseline
- The default allowance is 1 ATR.
-------
The previous and current ATR value
- Label on the right side of the chart showing the previous and current value of ATR
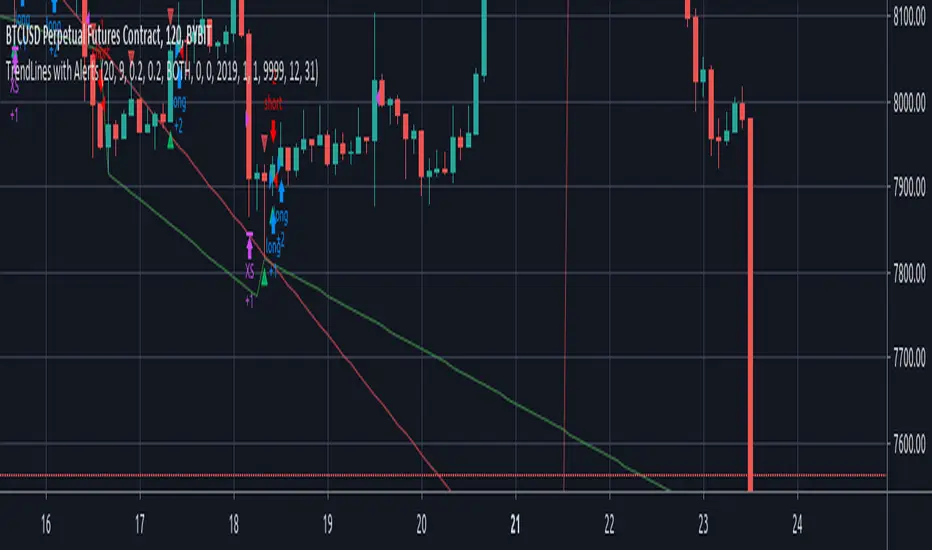
TrendLines with AlertsThis isn't my own work, hence giving it in Open Source library for others to benefit from it too.
I have tried to refin the output of trendlines in this Strategy
The original Code is available at
The script needs some modifications, so I'll be making further updates in future, but for now I'm publishing this because most people don't know how to track trandlines, moreover, some use Line.New() by tradingview Pinescript, which again is a bit difficult to deal with.
This script is a basic version of trendlines on a certain angle (anglecheck was provided by the original author in his script).
Nothing fancy in this script.
Also Converted the original Script to Pinescript v4.
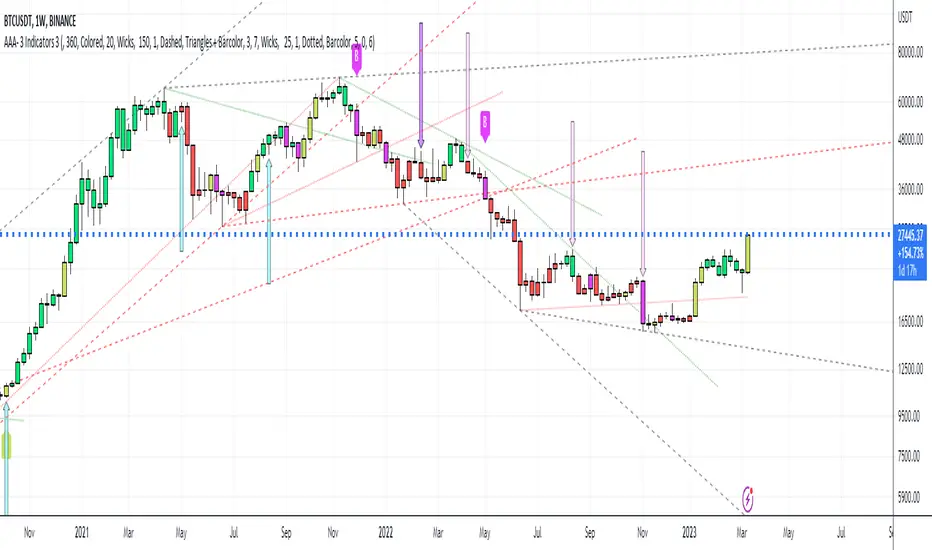
Trendlines 2x +Copy of "Trendlines - JD" script by Duyck, which draws Trendlines from the pivot points in the price chart.
I have simply Doubled the amount of Trendlines, so now there are;
A Primary set of Trendlines at a higher lookback length and Thicker Line Width
and
A Secondary set of Trendlines at a Lower lookback length and Thinner Line Width
The default values work well when comparing multiple time frames at 3x time difference, play around with these values for other x time variations
I have also simplyfied the Trendline Extension Function to make it more user friendly
Please use the Alerts with caution as the Trendline Break function still needs to be optimised
Also included are Trend Candles to color the bars according to momentum, Trencandles script is a copy of UCS_Trend by ucsgears

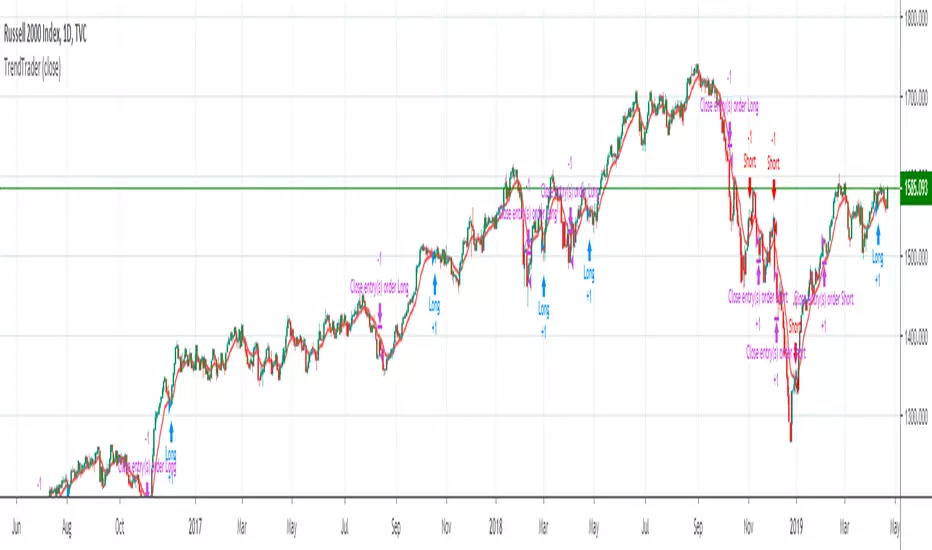
Trend Trader (by JamieSteele)This strategy uses a multi-time-frame approach to trading.
A longer-term set of moving averages represents the Weekly (long-term) Trend.
The current trend represents the intermediate-term trend.
A 10 period exponential moving average represents the short-term trend.
The system trades in the direction of the long-term and intermediate term trend,
and enters trades on pullbacks counter to these trends.
The daily bars are colored based upon their intermediate term trend.
Red=Down Trend, Green=Up Trend.
For short-side trades, we look to capture small, consistent profits. This is necessary
given the extreme manipulation by governments' central banks in an effort to prop-up their
stock markets to give an appearance of an economy that is better than actually exists.
These governments look to limit all downside moves, so we capture small profits and then
re-short after the market resets.
For long-side trades the system stays in the trade until the trend is proven to be over.
Given the extreme valuations present in world markets today, extreme caution should be taken
on all trades, especially long-side trades. Use of derivatives are preferred (e.g. options,
which can be used to limit downside risk.) Naked put selling should be avoided, since huge
losses are possible selling naked puts in a market that is very overdue for a crash/large
price decline.)
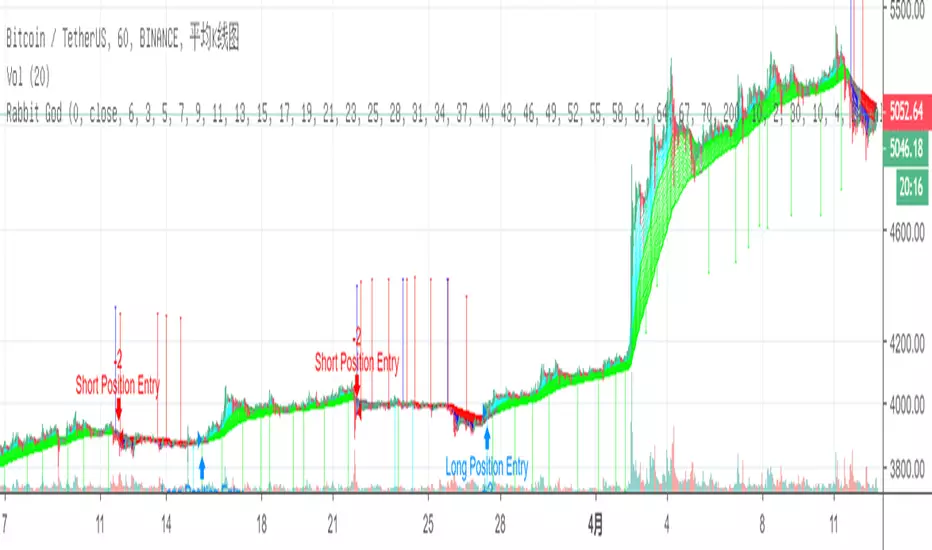
Trend tracking strategy of proprietary traders-RabbitThis is my latest strategy integration. It is a combination of trend tracking strategy and visualization trend. I believe it will bring you a clear trend discrimination and relatively reliable trading signal hints.
(Note: This strategy parameter has special parameter debugging and Optimization for BTC1h/BIANACE Heikin-ashi chart. It works best here. Other trade pairs or parameter versions of investment targets will be published specially if necessary.)
Statement of strategy concept:
The concept of strategy is trend tracking. The formation and continuation of trend is the product of speculation market for thousands of years. There are various strategies including CTA trend strategy, shock regression strategy, grid strategy, Martin strategy, Alpha strategy and so on. These strategies have their own merits just like different schools of Chinese knight-errant. Choose one, a master is not able to do hundreds of tricks, but to practice one trick thousands of times.
Every strategy has its own right and wrong. Trading is not violence, but a process of advancing, retreating, and making profits steadily. Therefore, the use of trend tracking strategy must overcome greed in human nature, profit and loss homology, dare to bear the shock of withdrawal in order to make a big profit when the real trend arrives. (Of course, this strategy has largely avoided filtering shocks, which will be explained later.)
Policy-building instructions:
Any trend tracking strategy can produce good results when there is a trend, so judging whether a trend strategy is good or bad depends on its withdrawal performance when it is shaking. This CTA trend tracking strategy uses Kauffman adaptive algorithm, fractal adaptive dimension, self-research algorithm and other tools, and has largely avoided filtering the signal in the shock without delay to follow the trend.
Additional notes for the new version:
The latest integrated version has increased the visualization of trends. It can clearly distinguish the trend of ups and downs or consolidation shocks based on chart color. However, trading signals are not calculated according to color changes, but the visualization helps you identify trends and signals help you to refer to sales.
This is only a simple trading signal strategy, and the other warehouse management and risk control need manual completion operation.
(Note: This strategy parameter has special parameter debugging and Optimization for BTC1h/BIANACE Heikin-ashi chart. It works best here. Other trade pairs or parameter versions of investment targets will be published specially if necessary.)
Good luck to all of you and a smooth deal.~
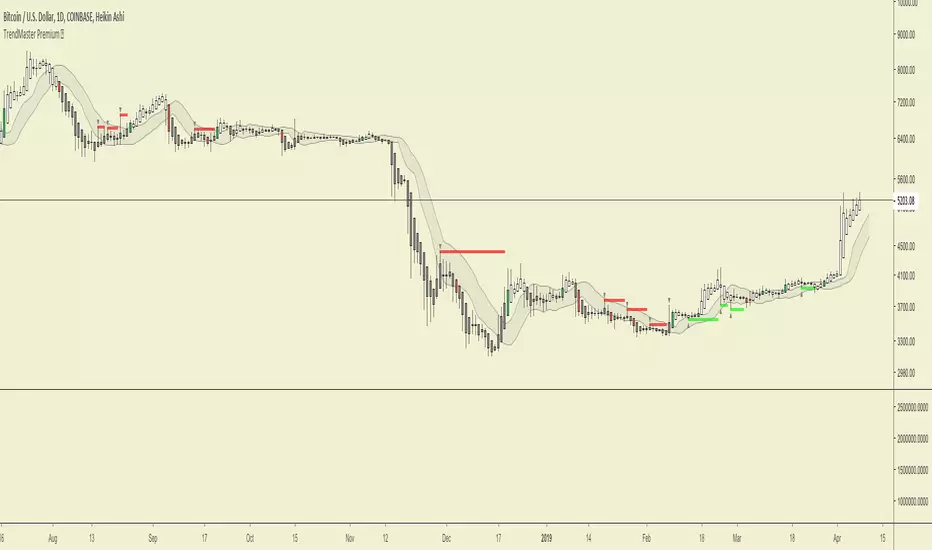
TrendMaster Premium ©Trendmaster Premium©
We are proud to release the final version of Trendmaster Premium©. This indicator is the result of months of development between @TrendmasterTM and @Crypto_C00kie.
Trendmaster Premium© is a Trend following system that provide entries, exits and stop loss placement. It is extremely simple to follow and we have experienced outstanding results.
When purchasing Trendmaster Premium© you will receive access to the indicator suite and access to our private members discord group.
Discord: The discord channel is a place where traders can discuss ideas and share content.
It includes
Bots – The discord channel currently has two bots that constantly scan Binance for signals. They will alert you by notification of any BTC pair that has printed a signal candle. Currently the bots report D1 and H4 signals as these are the time frames the indicator is designed for. These are designed to alert you to possible trades and should NOT be blindly traded from.
Chat – Several chat servers offering educational resources, guidance on how to use the indicator and chart/idea sharing.
The mandatory Legal bit:
@IchimokuScholar and @Crypto_C00kie wish you the best of luck in achieving your trading goals. Please apply appropriate risk management.
Any form of trading has large potential rewards but also large potential risks. The Purchaser must be aware of those risks and be willing to accept them. Don't trade with money that you, the Purchaser cannot afford to lose. No representation is being made that you are guaranteed positive results. The past performance of any trading methodology is not necessarily indicative of future results. Trading involves high risks. Neither @TrendmasterTM or @Crypto_C00kie are responsible for any trades that you, the Purchaser take. All trades taken are entirely at the Purchasers own risk. Refunds are neither offered nor implied.
Trend BarsThis trading tool identifies when price is in a range and when the trend is established from.
Exclusive for our members.
io-trend-follow (1.0)Trend Follow script to be used across all market instruments and timeframes.
Now you can display long only, short only or both signals.

Trend Prediction Meter [PointAlgo]The Trend Prediction Meter & Levels is a composite market-bias and volatility visualization tool designed to summarize trend strength, momentum, price positioning, and volatility into a single normalized score.
It provides a structured framework to interpret directional bias and probable price expansion zones during active market conditions.
Concept Overview
Markets often reflect multiple conditions simultaneously—trend direction, momentum strength, price location within a range, and volatility.
This indicator combines these elements into a unified Bullish Score (0–100), displayed as a meter and supported by projected ATR-based levels.
Rather than focusing on a single signal, the script aims to present context about current market conditions.
Bullish Score Composition (0–100)
The meter represents a weighted blend of multiple market factors:
1. Trend Strength (EMA Structure)
Uses a fast and slow EMA to assess directional bias.
The distance between EMAs is normalized into a trend strength score.
Strong separation indicates directional conviction; compression suggests balance.
2. Momentum Strength (RSI Blend)
Combines a short-term and mid-term RSI.
Helps capture both immediate momentum and broader directional stability.
Higher readings indicate sustained bullish pressure, lower readings indicate bearish pressure.
3. Position Within Recent Range
Measures where price is trading relative to its recent high–low range.
Values near the top of the range reflect strength; values near the bottom reflect weakness.
Mid-range positioning indicates equilibrium.
4. Volume Participation
Compares current volume against its recent average.
Acts as a minor confidence modifier rather than a primary driver.
Each component is normalized and combined using fixed weights to produce a final Bullish Score between 0 and 100.
Bias Classification
The Bullish Score is translated into descriptive market states:
Extreme Bullish
Very Bullish
Bullish
Neutral
Bearish
Very Bearish
These labels describe current bias, not future certainty.
Meter Visualization
The meter plot dynamically changes color based on the score range.
A dashed midline at 50 represents balance.
Background shading highlights strong bullish or bearish dominance zones.
Crossovers of the 50-level indicate shifts in directional control.
ATR-Based Projection Levels:
To provide volatility context, the indicator calculates ATR-based upside and downside reference levels:
Two potential expansion levels (TP1 and TP2) are projected above and below price.
The distance of these levels adapts based on current bias strength.
These levels are contextual reference zones, not fixed targets.
Prediction Dashboard
An optional side table summarizes key readings at the most recent bar:
Symbol
Current bias label
Bullish Score
Current price
ATR value
Upside and downside projection levels
Directional comment (Upside favoured / Downside favoured / Balanced)
This dashboard is designed to provide a quick structural overview without requiring manual calculation.
Signals & Alerts
Built-in alerts are available for:
Bullish bias conditions
Bearish bias conditions
Bullish Score crossing above 50
Bullish Score crossing below 50
Alerts are informational and reflect internal state changes only.
Customization:
Users can adjust:
RSI lengths
EMA lengths
Range lookback period
ATR parameters
Display options for the meter and dashboard
This allows adaptation across different instruments and timeframes.
Usage Notes
Best suited for analytical interpretation rather than standalone decision-making.
Designed to complement price action, structure, or other indicators.
Works across multiple markets where volume and volatility data are available.
Disclaimer :
This indicator is intended for educational and analytical purposes only.
It does not provide investment, trading, or financial advice.
All signals and levels should be validated with independent analysis and appropriate risk management.

Trend Fusion Indicator🎯 Trend Fusion Indicator🎯
Professional trading indicator combining EMA momentum with Supertrend volatility for high-probability signals.
📊KEY FEATURES:
• 9 EMA & Supertrend (10,3) crossover signals
• Visual trend direction with colored fills
• Buy/Sell arrows at crossover points
• Real-time trend tracking
• Clean, professional interface
⚡SIGNAL LOGIC:
✅ BUY: When EMA crosses ABOVE Supertrend
✅ SELL: When EMA crosses BELOW Supertrend
🎨VISUAL INDICATORS:
• Green Zone/Fill: Bullish trend (EMA > Supertrend)
• Red Zone/Fill: Bearish trend (EMA < Supertrend)
• Triangle Arrows: Entry signals
• Background Colors: Trend confirmation
⚙️CUSTOMIZABLE SETTINGS:
• EMA Length (Default: 9)
• Supertrend ATR Length (Default: 10)
• Supertrend Factor (Default: 3.0)
🔔ALERTS INCLUDED:
• Buy Alert: EMA crosses above Supertrend
• Sell Alert: EMA crosses below Supertrend
📈 BEST FOR:
• Swing Trading
• Day Trading
• Trend Following
• Market Reversals
⚠️ DISCLAIMER: This indicator is for educational purposes only.
Trading involves risk. Not financial advice. Use at your own risk.

Trend Following $ZEC - Multi-Timeframe Structure Filter + Revers# Trend Following CRYPTOCAP:ZEC - Strategy Guide
## 📊 Strategy Overview
Trend Following CRYPTOCAP:ZEC is an enhanced Turtle Trading system designed for cryptocurrency spot trading, combining Donchian Channel breakouts, multi-timeframe structure filtering, and ATR-based dynamic risk management for both long and short positions.
---
## 🎯 Core Features
1. Multi-Timeframe Structure Filtering
- Uses Swing High/Low to identify market structure
- Customizable structure timeframe (default: 1 minute)
- Only enters trades in the direction of the trend, avoiding counter-trend positions
2. Reverse Signal Exit
- No fixed stop-loss or fixed-period exits
- Exits only when a reverse entry signal triggers
- Maximizes trend profits, reduces premature exits
3. ATR Dynamic Pyramiding
- Adds positions when price moves 0.5 ATR in favorable direction
- Supports up to 2 units maximum (adjustable)
- Pyramid scaling to enhance profitability
4. Complete Risk Management
- Fixed position size (5000 USD per unit)
- Commission fee 0.06% (Binance spot rate)
- Initial capital 10,000 USD
---
## 📈 Trading Logic
Entry Conditions
✅ Long Entry:
- Close price breaks above 20-period high
- Structure trend is bullish (price breaks above Swing High)
✅ Short Entry:
- Close price breaks below 20-period low
- Structure trend is bearish (price breaks below Swing Low)
Add Position Conditions
- Long: Price rises ≥ 0.5 ATR
- Short: Price falls ≥ 0.5 ATR
- Maximum 2 units including initial entry
Exit Conditions
- Long Exit: When short entry signal triggers (price breaks 20-period low + structure turns bearish)
- Short Exit: When long entry signal triggers (price breaks 20-period high + structure turns bullish)
---
## ⚙️ Parameter Settings
Channel Settings
- Entry Channel Period: 20 (Donchian Channel breakout period)
- Exit Channel Period: 10 (reserved parameter, actually uses reverse signal exit)
ATR Settings
- ATR Period: 20
- Stop Loss ATR Multiplier: 2.0 (reserved parameter)
- Add Position ATR Multiplier: 0.5
Structure Filter
- Swing Length: 160 (Swing High/Low calculation period)
- Structure Timeframe: 1 minute (can change to 5/15/60, etc.)
Position Management
- Maximum Units: 2 (including initial entry)
- Capital Per Unit: 5000 USD
---
## 🎨 Visualization Features
Background Colors
- Light Green: Bullish structure
- Light Red: Bearish structure
- Dark Green: Long entry
- Dark Red: Short entry
Optional Display (Default: OFF)
- Entry/exit channel lines
- Structure high/low lines
- ATR stop-loss line
- Next add position indicator
- Entry/exit labels
---
## 📱 Alert Message Format
Strategy sends notifications on entry/exit with the following format:
- Entry: `1m Long EP:428.26`
- Add Position: `15m Add Long 2/2 EP:429.50`
- Exit: `1m Close Long Reverse Signal`
Where:
- `1m`/`15m` = Current chart timeframe
- `EP` = Entry Price
---
## 💰 Backtest Settings
Capital Allocation
- Initial Capital: 10,000 USD
- Per Entry: 5,000 USD (split into 2 entries)
- Leverage: 0x (spot trading)
Trading Costs
- Commission: 0.06% (Binance spot VIP0)
- Slippage: 0
---
## 🎯 Use Cases
✅ Best Scenarios
- Trending markets
- Moderate volatility assets
- 1-minute to 4-hour timeframes
⚠️ Not Suitable For
- Highly volatile choppy markets
- Low liquidity small-cap coins
- Extreme market conditions (black swan events)
---
## 📊 Usage Recommendations
Timeframe Suggestions
| Timeframe | Trading Style | Suggested Parameter Adjustment |
|-----------|--------------|-------------------------------|
| 1-5 min | Scalping | Swing Length 100-160 |
| 15-30 min | Short-term | Swing Length 50-100 |
| 1-4 hour | Swing Trading | Swing Length 20-50 |
Optimization Tips
1. Adjust swing length based on backtest results
2. Different coins may require different parameters
3. Recommend backtesting on 1-minute chart first before live trading
4. Enable labels to observe entry/exit points
---
## ⚠️ Risk Disclaimer
1. Past Performance Does Not Guarantee Future Results
- Backtest data is for reference only
- Live trading may be affected by slippage, delays, etc.
2. Market Condition Changes
- Strategy performs better in trending markets
- May experience frequent stops in ranging markets
3. Capital Management
- Do not invest more than you can afford to lose
- Recommend setting total capital stop-loss threshold
4. Commission Impact
- Frequent trading accumulates commission fees
- Recommend using exchange discounts (BNB fee reduction, etc.)
---
## 🔧 Troubleshooting
Q: No entry signals?
A: Check if structure filter is too strict, adjust swing length or timeframe
Q: Too many labels displayed?
A: Turn off "Show Labels" option in settings
Q: Poor backtest performance?
A:
1. Check if the coin is suitable for trend-following strategies
2. Adjust parameters (swing length, channel period)
3. Try different timeframes
Q: How to set alerts?
A:
1. Click "Alert" in top-right corner of chart
2. Condition: Select "Strategy - Trend Following CRYPTOCAP:ZEC "
3. Choose "Order filled"
4. Set notification method (Webhook/Email/App)
---
## 📞 Contact Information
Strategy Name: Trend Following CRYPTOCAP:ZEC
Version: v1.0
Pine Script Version: v6
Last Updated: December 2025
---
## 📄 Copyright Notice
This strategy is for educational and research purposes only.
All risks of using this strategy for live trading are borne by the user.
Commercial use without authorization is prohibited.
---
## 🎓 Learning Resources
To understand the strategy principles in depth, recommended reading:
- "The Complete TurtleTrader" - Curtis Faith
- "Trend Following" - Michael Covel
- TradingView Pine Script Official Documentation
---
Happy Trading! Remember to manage your risk 📈

Trend Gazer: Unified ICT Trading System with Signals# Trend Gazer User Guide (English)
## 📖 Table of Contents
1. (#about-this-indicator)
2. (#quick-start-guide-3-steps)
3. (#detailed-usage)
4. (#settings-customization)
5. (#why-combine-multiple-features)
6. (#faq)
---
## About This Indicator
**Trend Gazer** is an integrated trading system designed to read institutional order flow like professional traders.
### 🎯 3 Problems This Indicator Solves
#### ❌ Problem 1: Too Many Indicators = Information Overload
```
Normal: RSI + MACD + Moving Average + Bollinger Bands... → Cluttered chart
Solution: All integrated into ONE indicator → Clean & Clear
```
#### ❌ Problem 2: Single Indicators Give False Signals
```
Normal: Enter based on RSI alone → Frequent stop-outs
Solution: Structure × Zone × Momentum multi-angle confirmation → Higher win rate
```
#### ❌ Problem 3: Unclear Entry Timing
```
Normal: Know the trend but don't know WHERE to enter
Solution: LS Bounce Signal shows EXACT entry points
```
---
## Quick Start Guide (3 Steps)
### 🚀 STEP 1: Confirm Trend Direction
**Look for CHoCH (Change of Character)**
```
📍 (1.CHoCH) label = Uptrend starting
📍 (a.CHoCH) label = Downtrend starting
```
**Important**: Wait for CHoCH! No direction without it.
---
### 🎯 STEP 2: Find Entry Points
**Wait for LS Bounce Signal (green/red labels)**
```
🟢 "Long@ HL only" label → LONG (buy) candidate
🔴 "Short@ LH only" label → SHORT (sell) candidate
```
**Label text color meaning**:
- **White text**: Clean trend (high confidence)
- **Yellow text**: Trend transition (moderate caution)
---
### 🛡️ STEP 3: Final Confirmation with Bar Color
**Bar color shows market state**
```
🔴 Red bar: BUY zone (buying is favored)
🟢 Green bar: SELL zone (selling is favored)
⚪ White bar: Neutral (wait and see)
```
---
## Detailed Usage
### 📊 Understanding the Chart
#### 1. Labels (Market Structure Changes)
```
(1.CHoCH) / (a.CHoCH) : Trend reversal
(2.SiMS) / (b.SiMS) : Momentum confirmation
(3.BoMS) / (c.BoMS) : Trend continuation
```
#### 2. Boxes (Institutional Order Zones)
```
📦 Blue boxes: Bullish OB (buy orders accumulated)
📦 Red boxes: Bearish OB (sell orders accumulated)
📦 Black transparent boxes: Liquidity Sweep
```
**How to use Order Blocks**:
- Function as support/resistance
- Signals within OB have higher reliability
- Use for stop-loss placement
#### 3. Lines (Trends and Support/Resistance)
```
━━━ Red lines: EMA20, EMA50, EMA100 (short to mid-term trends)
━━━ Blue lines: 60min NPR/BB bands (support/resistance)
```
#### 4. Bar Colors (Filter 6)
```
Bar color = Real-time market state
🔴 Red: Buying is favored
🟢 Green: Selling is favored
⚪ White: Neutral
```
---
### 🎯 Practical Trading Flow
#### 📍 Preparation Phase
```
1. Open chart (recommended: 5min or 15min)
2. Add Trend Gazer to chart
3. Start in observation mode (don't enter yet)
```
#### 📍 Entry Decision
```
✅ CHoCH confirms direction → Uptrend starting
✅ LS Bounce Signal "Long@ HL only" appears
→ Entry point candidate
✅ Bar turns red → Market supports buying
→ Entry decision 🎯
✅ Place stop below nearest Order Block (blue box)
```
#### 📍 Exit Decision
```
🔴 Opposite LS Bounce Signal "Short@ LH only" appears
→ Consider taking profit
🔴 Bar turns green
→ Potential trend reversal, review position
🔴 Stop loss hit
→ Exit with loss
```
---
### 💡 Tips for Higher Win Rate
#### ✅ DO's
```
1. Enter AFTER CHoCH appears
2. Prioritize white-text LS Bounce Signals
3. Check higher timeframe (1H or Daily) trend
4. Emphasize signals within Order Blocks
5. Use bar color as final confirmation
```
#### ❌ DON'Ts
```
1. Enter before CHoCH → No clear direction
2. Enter only on yellow text → Unstable transition period
3. Ignore bar color → Trading against market state
4. Don't check Order Blocks → Unclear support/resistance
5. Enter same direction consecutively → Overtrading
```
---
## Settings Customization
### 🔧 How to Open Settings
```
1. Right-click on indicator name on chart
2. Select "Settings..."
3. Settings panel opens
```
---
### 📋 Recommended Setting Profiles
#### 🔰 Beginner Settings (Simple)
**Goal**: Reduce noise, show only important signals
```
【FILTERS】
✅ Bonus Filter: ON
✅ Filter 6 (OB/BB/NPR Zone Filter): ON
❌ Direction Filter: OFF
❌ Liquidation Reversal Filter: OFF
❌ ICT Market Structure Filter: OFF
❌ EMA Trend Filter: OFF
❌ OB/FVG Filter 1: OFF
❌ OB/FVG Filter 2: OFF
【SIGNALS】
✅ Signal 0 (Bonus): ON
✅ Signal 1 (VWC Change): ON
✅ Signal 2 (Liq Rev): ON
❌ Signal 3 (LS): OFF (complex alone)
❌ Signal 4 (LS Break): OFF
❌ Signal 5 (OB+LS NPR): OFF
❌ Signal 6 (OB+LS EMA): OFF
【LS BOUNCE SIGNAL】
✅ Exclude EMA50 from touch detection: OFF
❌ Only show when EMA fills are mixed: OFF
```
**What happens with this setup**:
- Only Bonus (black background) signals display
- LS Bounce Signals clearly visible
- Noisy signals filtered out
---
#### 💪 Intermediate Settings (Balanced)
**Goal**: Enable key filters for better accuracy
```
【FILTERS】
✅ Bonus Filter: ON
✅ Filter 6 (OB/BB/NPR Zone Filter): ON
✅ ICT Market Structure Filter: ON
❌ Direction Filter: OFF
❌ Liquidation Reversal Filter: OFF
❌ EMA Trend Filter: OFF
❌ OB/FVG Filter 1: OFF
❌ OB/FVG Filter 2: OFF
【SIGNALS】
✅ Signal 0 (Bonus): ON
✅ Signal 1 (VWC Change): ON
✅ Signal 2 (Liq Rev): ON
✅ Signal 3 (LS): ON
❌ Signal 4 (LS Break): OFF
❌ Signal 5 (OB+LS NPR): OFF
❌ Signal 6 (OB+LS EMA): OFF
【LS BOUNCE SIGNAL】
✅ Exclude EMA50 from touch detection: OFF
❌ Only show when EMA fills are mixed: OFF
```
**What happens with this setup**:
- Signals only after CHoCH (trend confirmed)
- Filter 6 changes bar colors
- Liquidity Sweeps also displayed
---
#### 🚀 Advanced Settings (Full Utilization)
**Goal**: Master all features
```
【FILTERS】
✅ Bonus Filter: ON
✅ Filter 6 (OB/BB/NPR Zone Filter): ON
✅ ICT Market Structure Filter: ON
✅ Direction Filter: ON
✅ EMA Trend Filter: ON
❌ Liquidation Reversal Filter: OFF (optional)
✅ OB/FVG Filter 1: ON
✅ OB/FVG Filter 2: ON
【SIGNALS】
✅ All ON
【LS BOUNCE SIGNAL】
✅ Exclude EMA50 from touch detection: ON (reduce EMA50 noise)
✅ Only show when EMA fills are mixed: ON (show only transition zones)
```
**What happens with this setup**:
- Fewer signals (precision-focused)
- Multiple confirmations greatly reduce false signals
- Only signals confirmed by trend, momentum, and zones
---
### 🎨 Display Customization
#### Change Label Size
```
【BUY/SELL SIGNAL APPEARANCE】
→ "BUY/SELL Label Size"
→ Choose from: tiny / small / normal / large / huge
Recommended: small (default)
```
#### Order Block Display Settings
```
【ORDER BLOCK (OB) SETTINGS】
✅ Show Current TF OB: Current timeframe OB
✅ Show 1min OB: 1-minute OB
✅ Show 5min OB: 5-minute OB
✅ Show 15min OB: 15-minute OB
Recommended: Only 15min OB ON (simple)
```
#### Liquidity Sweep Display
```
【LIQUIDITY SWEEPS SETTINGS】
→ "Sweep Length": Sensitivity (small=frequent, large=selective)
→ "Sweep Option": Standard / Maximum
Recommended: Length=40, Option=Standard
```
#### NPR/BB Bands Display
```
【NPR (NON-REPAINT STDEV) SETTINGS】
✅ Display 60min NPR Bands: 60-minute support/resistance
❌ Display Current TF NPR Bands: Current timeframe (optional)
Recommended: Only 60min ON
```
---
### ⚙️ Advanced Settings
#### Fine-tune Filter 6
```
【FINAL FILTERS】
→ "Enable Filter 6 (OB/BB/NPR Zone Filter)"
When ON:
- Bars color-coded red/green/white
- Behavior at OB, NPR/BB touches controlled
```
#### LS Bounce Signal Adjustments
```
【LS BOUNCE SIGNAL】
→ "Exclude EMA50 from touch detection"
OFF: Detect NPR/BB/EMA50 (all 3)
ON: Detect NPR/BB only (exclude EMA50)
→ "Only show when EMA fills are mixed"
OFF: Show all LS Bounce Signals
ON: Show only transition zone signals (yellow text)
```
#### MTF (Multi-Timeframe) Control
```
【ORDER BLOCK (OB) SETTINGS】
→ "Disable MTF on 1hr+ Charts"
ON: Disable MTF on 1H+ (save memory)
OFF: MTF enabled on all timeframes
Recommended: ON (unnecessary on larger timeframes)
```
---
### 🎯 Purpose-Based Configuration Guide
#### 🔍 Goal 1: Reduce Signal Count
```
✅ Bonus Filter: ON
✅ ICT Market Structure Filter: ON
✅ Filter 6: ON
✅ All Signals OFF, only Signal 0 ON
```
#### 🔍 Goal 2: Get More Signals
```
❌ All Filters OFF
✅ All Signals ON
```
#### 🔍 Goal 3: Trend Following Only
```
✅ ICT Market Structure Filter: ON
✅ Direction Filter: ON
✅ EMA Trend Filter: ON
```
#### 🔍 Goal 4: Counter-Trend Trading
```
✅ LS Bounce Signal: ON
✅ Filter 6: ON
❌ ICT Market Structure Filter: OFF
```
#### 🔍 Goal 5: Day Trading (5-15min charts)
```
✅ Show 15min OB: ON
✅ Display 60min NPR Bands: ON
✅ LS Bounce Signal: ON
❌ Show 1min/5min OB: OFF
```
#### 🔍 Goal 6: Scalping (1-5min charts)
```
✅ Show 5min OB: ON
✅ Show 15min OB: ON
✅ Display 60min NPR Bands: ON
✅ All Signals: ON
```
---
### 💾 Saving and Loading Settings
#### Save Settings
```
1. Click "..." in top-right of Settings screen
2. Select "Save as default"
→ Same settings auto-applied next time
```
#### Reset Settings
```
1. Click "..." in top-right of Settings screen
2. Select "Reset settings"
→ Return to default settings
```
---
## Why Combine Multiple Features?
### 🎯 Problem: Single Indicator Limitations
Common trader problems:
```
❌ RSI alone → Trade against trend, lose
❌ Moving Average alone → Late entry timing
❌ Support/Resistance alone → Caught by false breakouts
```
**Markets are complex**. One angle isn't enough.
---
### 💡 Solution: Multi-Angle Integrated Approach
#### 1️⃣ Structure × Zone × Momentum
```
📐 Structure (ICT CHoCH)
→ "Which direction is likely?"
📦 Zone (OB/NPR/BB)
→ "Where will price react?"
💨 Momentum (EMA/VWC)
→ "Is there momentum now?"
```
**When all 3 align = Highest win-rate timing**
---
#### 2️⃣ Multi-Timeframe Analysis
```
Big picture: Confirm Daily direction
Medium-term: Check 1H Order Blocks
Short-term: Time entry on 5min
```
**Short-term entries aligned with higher timeframes = Better win rate**
---
#### 3️⃣ Understanding Liquidity
```
🎣 Institutional strategy:
1. Intentionally move price opposite to stop out retail
2. Then, move in real direction
💡 Liquidity Sweep = Visualize this "trap"
→ Read institutional order flow
```
---
### 🧠 Integration Examples
#### Case 1: RSI Alone vs Integrated System
**Scenario**: RSI at 30 (oversold)
```
❌ RSI-only decision:
→ "Buy!"
→ But downtrend continues, loss 😢
✅ Trend Gazer:
CHoCH check → Still downtrend ❌
Order Block → In Bearish OB ❌
LS Bounce → SHORT signal only ❌
→ Skip or SHORT
→ Avoid loss ✅
```
**Result**: Multiple filters block wrong entry
---
#### Case 2: LS Bounce Signal 2-Stage Logic
**Scenario**: Price touches 60min NPR lower band
```
🔍 Traditional method:
Touched → Buy!
→ But price continues down 😢
✅ Trend Gazer:
Stage 1: NPR touch + red bar → Flag ON
Stage 2: EMA20 crosses above EMA50 → Confirm bounce
→ Now "Long@ HL only" displays
→ Entry → Success ✅
```
**Result**: Not just "touch" but "touch + bounce confirmation" improves accuracy
---
### 🎓 Progressive Learning Design
This indicator is designed for **beginners to advanced**:
```
📖 Beginner (Month 1):
Use only CHoCH + LS Bounce Signal
→ Learn trend and entry points
📖 Intermediate (Months 2-3):
Add Order Block + Bar Color
→ Learn support/resistance and filtering
📖 Advanced (Month 6+):
Master all features
→ Read institutional order flow
```
**Ultimate goal**: Indicator becomes confirmation tool. Your market sense becomes primary.
---
### 🔬 Technical Advantages
#### 1. Non-Repaint STDEV (NPR)
```
Normal Bollinger Bands:
→ Past data changes (repaints)
→ Inaccurate backtesting
NPR:
→ Past data doesn't change (non-repaint)
→ Reliable verification possible
```
#### 2. 2-Stage Signal Logic
```
Traditional: Condition met → Immediate signal
→ Many false signals
Trend Gazer: Condition1 → Flag ON → Condition2 → Signal
→ Confirmation step improves accuracy
```
#### 3. Alternating Filter
```
Problem: Same-direction signals spam
→ Overtrading
Solution: LONG → SHORT → LONG alternating only
→ Prevent unnecessary entries
```
---
### 💎 Conclusion: Why Integration?
```
Single indicator = "Partial truth"
Integrated system = "3D market perspective"
```
**Markets are multifaceted**. One angle isn't enough.
Trend Gazer **integrates multiple screens pros watch simultaneously into ONE**,
allowing beginners to read charts with institutional perspective.
---
## FAQ
### ❓ Q1: Which timeframe is best?
**A**: Depends on trading style
```
Scalping: 1min ~ 5min
Day Trading: 5min ~ 15min
Swing: 1H ~ 4H
```
**Important**: LS Bounce Signal only works on 30min and below.
---
### ❓ Q2: Too many signals, confused
**A**: Enable filters
```
【Recommended Settings】
✅ Bonus Filter: ON
✅ Filter 6: ON
✅ ICT Market Structure Filter: ON
→ Show only Signal 0
```
This significantly reduces signal count.
---
### ❓ Q3: No CHoCH appearing, what to do?
**A**: Wait or check higher timeframe
```
Method 1: Wait for CHoCH (recommended)
Method 2: Check higher timeframe (e.g., Daily) for trend
Method 3: Disable ICT Filter (not recommended)
```
**When trend is unclear, sitting out is also strategy**.
---
### ❓ Q4: LS Bounce Signal not appearing
**A**: Checkpoints
```
1. Are you on 30min or below chart?
→ Doesn't show on 1H+
2. Are NPR/BB bands displayed?
→ Check Settings "Display 60min NPR Bands"
3. Is EMA50 excluded?
→ If "Exclude EMA50" is ON, EMA50 signals won't show
```
---
### ❓ Q5: Bar color not changing?
**A**: Check Filter 6
```
Settings → FINAL FILTERS
→ Confirm "Enable Filter 6 (OB/BB/NPR Zone Filter)" is ON
If ON but still not changing:
→ Current price may be outside OB/NPR/BB zones
```
---
### ❓ Q6: Too many Order Blocks, hard to see
**A**: Narrow down displayed OBs
```
Settings → ORDER BLOCK (OB) SETTINGS
Recommended:
❌ Show Current TF OB: OFF
❌ Show 1min OB: OFF
❌ Show 5min OB: OFF
✅ Show 15min OB: ON (only this)
```
---
### ❓ Q7: How to improve win rate?
**A**: Thorough multiple confirmations
```
Checklist:
✅ CHoCH appeared
✅ LS Bounce Signal (white text)
✅ Bar color matches (red bar=LONG, green bar=SHORT)
✅ Signal within Order Block
✅ Aligns with higher timeframe trend
Enter ONLY when all align
```
---
### ❓ Q8: Want to practice on demo
**A**: Recommended practice method
```
Week 1: Observation only
→ Watch signals and chart movement
→ Resist entering
Weeks 2-3: Keep records
→ Screenshot when signal appears
→ Record subsequent movement
Week 4+: Start demo trading
→ Start with small amounts
→ Continue keeping records
```
---
### ❓ Q9: Are there alert features?
**A**: Yes, multiple alerts available
```
Setup method:
1. Right-click indicator on chart
2. Select "Add Alert..."
3. Choose from:
- ANY ALERT: BUY/SELL Signals
- BUY ONLY ALERT
- SELL ONLY ALERT
- MS UP / MS DOWN
- BAR COLOR: RED / LIME
- LS BOUNCE: LONG / SHORT Signal
```
---
### ❓ Q10: Works on other markets?
**A**: Yes, works on all markets
```
✅ Cryptocurrency (BTC, ETH, etc.)
✅ Forex (EUR/USD, USD/JPY, etc.)
✅ Stocks (individual stocks, indices)
✅ Futures (oil, gold, etc.)
```
Works on any market with price and volume data.
---
## 📋 Disclaimer
### ⚠️ Important Notice
This indicator is for **educational and informational purposes only**.
```
❌ NOT investment advice
❌ Does NOT guarantee profits
❌ Past results do NOT guarantee future performance
```
### Risk Warning
```
⚠️ Trading involves substantial risk
⚠️ Only trade with funds you can afford to lose
⚠️ Practice extensively on demo account before live trading
⚠️ Make your own informed decisions and act at your own risk
```
---
## 📞 Support
### Feedback & Questions
Feel free to ask questions in TradingView comments section.
### Bug Reports
Please report with specific details (timeframe, symbol, screenshots).
---
**Author**: rasukaru666
**License**: Mozilla Public License 2.0
**Last Updated**: December 2025
**Version**: Latest
---
**Thank you for using Trend Gazer!**
**Happy Trading! 📈**
---------------

Trend Step Channel [BigBeluga]🔵 OVERVIEW
Trend Step Channel identifies directional bias by forming a dynamic volatility-based step channel. It detects trend shifts when candle lows close above the upper band (bullish) or when candle highs drop below the lower band (bearish). A step-style midline tracks the trend evolution, while an integrated dashboard shows price positioning percentages across multiple timeframes.
🔵 CONCEPTS
ATR-Based Channel — The indicator constructs upper and lower channel boundaries using ATR distance around a single adaptive trend line, providing automatic scaling with volatility.
Trend Direction Logic —
• Low above upper band → uptrend confirmation.
• High below lower band → downtrend confirmation.
Step Trend Line — A reactive midline that locks onto price swings, stepping upward or downward as new trend confirmations occur.
Channel Width — Defines the total volatility range around the midline; a wider channel smooths market noise, while a narrower one reacts faster.
Price Position Ratio — Calculates the relative position of the close within the channel, from 0% (bottom) to 100% (top).
🔵 FEATURES
Volatility-Adaptive Channel — Expands and contracts dynamically to match market volatility, maintaining consistent distance scaling.
Configurable MA Source — Choose from SMA, EMA, SMMA, WMA, or VWMA as the base smoothing method.
Color-Coded Step Line —
• Green indicates an uptrend.
• Orange indicates a downtrend.
Channel Fill Visualization — Semi-transparent fills highlight active volatility zones for clear trend identification.
Price Position Label — Displays a “<” marker and percentage at the channel edge showing how far the current close is from the lower or upper band.
Multi-Timeframe Dashboard —
• Displays alignment across 1H–5H charts.
• Each cell shows an arrow (↑ / ↓) with price % positioning.
• Cell background color reflects bullish or bearish bias.
Real-Time Updating — The channel, midline, and dashboard refresh dynamically every bar for continuous feedback.
🔵 HOW TO USE
Trend Confirmation —
• Bullish trend forms when candle low closes above the upper band.
• Bearish trend forms when candle high closes below the lower band.
Trend Continuation — Maintain bias while the step line color remains consistent.
Volatility Breakouts — Sudden candle breaks outside the band suggest new directional strength.
Dashboard Alignment — Confirm trend consistency across multiple timeframes before entering trades.
Entry Planning — In uptrends, consider entries near the lower band; in downtrends, focus on upper-band rejections.
Price Position Insight — Use the % label to judge whether price is extended (near 100%) or compressed (near 0%) within the channel.
🔵 CONCLUSION
Trend Step Channel delivers a precise, volatility-driven view of trend structure using ATR-based boundaries and a step-line framework. The integrated dashboard, color-coded channel, and live positioning metrics give traders a complete picture of market direction, trend strength, and price location within evolving conditions.

Trend Pullback S-MSNRThis Indicator Identify two Major Time Frames for Trend Selection and Pullback.
NY time 10:00 AM to 10:15 AM zone will decide for trend.
NY time 10:30 AM to 11:30 AM zone will Pullback and Follow the Previous Trend.
Use S-MSNR Strategy for these two time Zone.

Trend Following Volatility Trail*Script was previously removed by Moderators at 1.8k boosts* - This was out of my control. This script was very popular and seemed to help a lot of traders. I am re uploading to help the community!
Trend Following Volatility Trail
The Trend Following Volatility Trail is a dynamic trend-following tool that adapts its stop, bias, and zones to real-time volatility and trend strength. Instead of using static ATR multiples like a normal Supertrend or Chandelier Stop, it continuously adjusts itself based on how stretched the market is and how persistent the trend has been. This indicator is based on volatility weighted EMAC
This makes the system far more reactive during momentum phases and more conservative during consolidation, helping avoid fake flips and late entries.
How It Works
The indicator builds an adaptive trail around a smoothed price basis:
– It starts with a short EMA as the “core trend line.”
– It measures volatility expansion versus normal volatility.
– It measures trend persistence by reading whether price has been rising or falling consistently.
– These two components combine to adjust the ATR multiplier dynamically.
As volatility expands or the trend becomes more persistent, the bands widen.
When volatility compresses or the trend weakens, the bands tighten.
These adaptive bands form the foundation of the trailing system.
Bull & Bear State Logic
The tool constantly tracks whether price is above or below the adaptive trail:
Price above the upper trail → Bullish regime
Price below the lower trail → Bearish regime
But instead of flipping immediately, it waits for confirmation bars to avoid noise.
This greatly reduces whipsaws and keeps the focus on sustained moves.
Once a new regime is confirmed:
– A coloured cloud appears (bull or bear)
– A label marks the flip point
– Alerts can be triggered automatically
Best Uses
Identifying regime shifts early
Riding sustained trends with confidence
Avoiding choppy markets by requiring confirmation
Using the adaptive cloud as a directional bias layer

