Adaptive Trend (Expo)Adaptive Trend (Expo)
DESCRIPTION
This Adaptive Trend (Expo) indicator is used to detect trends as well as to adapt to the trend characteristic in order to filter-out trend noise. Having an indicator like this enables professional traders to stay longer in trends. The indicator is also equipped with upper- and lower boundaries as well as a mid-line.
Positive trend
If the two trendlines (positive & negative trendline) emerges into one single line, it’s regarded as a positive trend. If a green cloud is painted in the indicator it’s a sign that the indicator is categorizing that price move as noise, and thus the professional trader should keep their long position, or enter Long.
Negative trend
If the two trendlines (positive & negative trendline) separates and become two lines as well as a red cloud is painted in the indicator, this is regarded as a negative trend.
As a general rule, if the ‘positive & negative trendline’ is above the midline there is a positive trend. If the ‘positive & negative trendline’ is below the midline there is a negative trend.
You have the possibility to change the ‘trendvalue’, a shorter length is more sensitive than a longer length.
HOW TO USE
1. Use the indicator to identify trends.
2. Use the indicator as a trend following strategy.
INDICATOR IN ACTION
EURUSD
EURUSD
EURUSD
BTCUSD
The indicator works with RENKO, HEIKIN ASHI and with KAGI charts as well.
I hope you find this indicator useful, and please comment or contact me if you like the script or have any questions/suggestions for future improvements. Thanks!
I will continue to work on this indicator, so please share your experience and feedback with me so that I can continuously improve it. Thanks to everyone that have contacted me regarding my scripts. Your feedback is valuable for future developments!
ACCESS THE INDICATOR
• Contact me on TradingView or use the links below
-----------------
Disclaimer
Copyright by Zeiierman.
The information contained in my scripts/indicators/ideas does not constitute financial advice or a solicitation to buy or sell any securities of any type. I will not accept liability for any loss or damage, including without limitation any loss of profit, which may arise directly or indirectly from use of or reliance on such information.
All investments involve risk, and the past performance of a security, industry, sector, market, financial product, trading strategy, or individual’s trading does not guarantee future results or returns. Investors are fully responsible for any investment decisions they make. Such decisions should be based solely on an evaluation of their financial circumstances, investment objectives, risk tolerance, and liquidity needs.
My scripts/indicators/ideas are only for educational purposes!
在腳本中搜尋"trend"

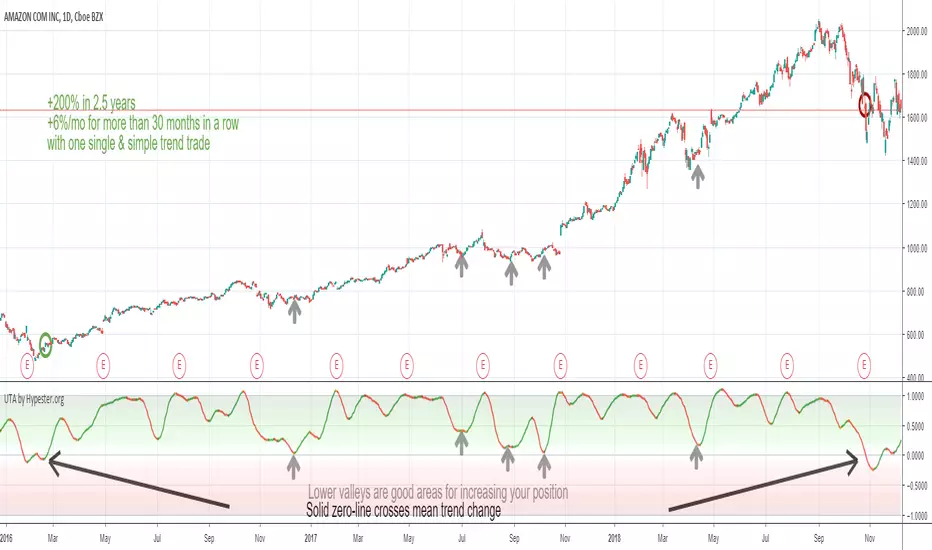
Ultimate Trend Analyzer by HypesterTrading is not all about scalping/day trading. To have a healthy and diversified portfolio, you should always have some trending long term assets to mitigate risks and keep your wallet always on the green side.
That's why Hypester once again innovates with the Ultimate Trend Analyzer. With the UTA you can check the trend's health with one glance.
Do not fool yourself, the Ultimate Trend Analyzer offers different trading profiles, so it doesn't matter what kind of trading you are doing, from long positions to intraday scalping - UTA can quickly adapt with one click. UTA offers Swing/Longterm, Day Trading and Scalping profile.
It also has two correlation methods, volume, and price. So you can decide what you want to prioritize most.
Not only that, there are two smoothing methods, linear regression and symmetrical averaging so you can remove noises from your indicator line.
The UTA offers you insight about the trend's health, just by looking at the background color, the stronger the color, stronger the trend. So higher up it is, stronger the uptrend is. The lower it is, stronger the downtrend.
Nevertheless, the UTA also gives you insight within trend corrections and peaks and bottoms with the indicator line color. So if you have a bullish trend and you see an orange line color, it means that direction is changing and you will observe a line color change, which means the course is now bearish even though the overall trend is going up. This feature is great for swing/scalp trading looking at the big picture.
Free Master Trend Navigator/ 趋势大师导航仪(免费版) by Mrlazycat趋势大师导航仪简单上手版使用说明
(这是一个简单版的趋势大师导航仪;如果需要趋势大师导航仪Pro版,可联系作者懒猫先生进行授权使用【推特联系:Jeffmo0769】)
(This is a simplified version of the Trend Master Navigator. For the Pro version, please contact Mr. Lazy Cat for authorization )
⚠ 非常重要,使用指标前请认真阅读这个使用说明
这是一个简单版的趋势大师导航仪
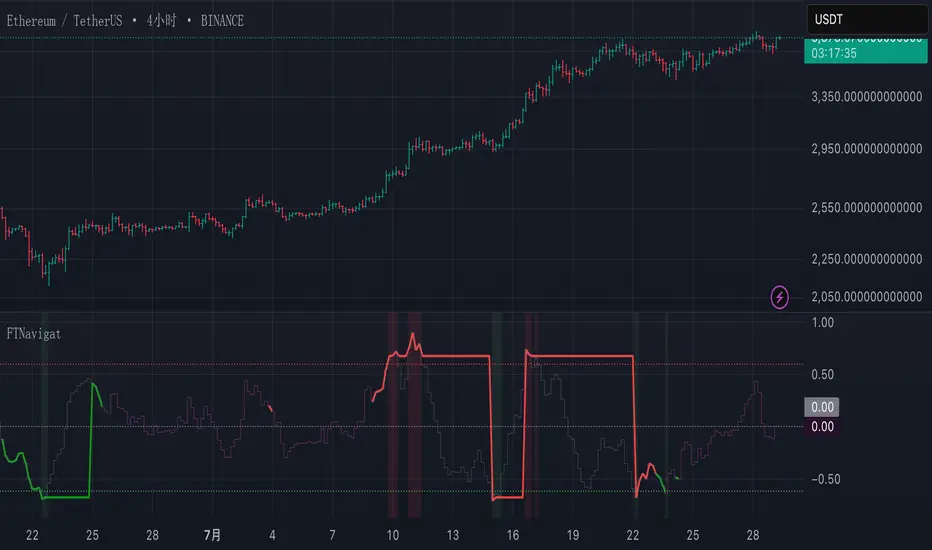
指标核心功能 本指标通过分析比特币的成交量、动能指标(MACD)、相对强弱指数(RSI)、趋势强度和成交量比率,生成在-1到1之间波动的趋势大师导航仪,帮助判断买卖时机。指标最佳适用场为4小时(4H)图表,适合1-2周的中短期交易。该趋势大师导航仪适用于BTC,ETH, DOGE等现货成交量大的虚拟货币
趋势曲线解读指南
① 市场状态(曲线颜色)
暗紫色:区间震荡市场
红色曲线:多头趋势
绿色曲线:空头趋势
② 关键信号区域
红色区域(超买):趋势曲线 ≥ 0.6 时,可能出现回调风险
绿色区域(超卖):趋势曲线 ≤ -0.615 时,可能出现反弹机会
③ 锁定机制
对部分强多头趋势(红色)和强空头趋势(绿色)进行锁定:
如果趋势曲线突破红色区域(超买)且市场趋势强度保持在强趋势或较强的弱趋势,趋势曲线会锁定在0.7附近(原始曲线以灰色继续)。
如果趋势曲线跌破绿色区域(超卖)且市场趋势强度保持在强趋势或较强的弱趋势,趋势曲线会锁定在-0.7附近(原始曲线以灰色继续)。 这表示趋势可能继续发展,建议等待锁定期结束后再进行操作。
✅ 极端多头趋势的特殊案例:(如ETH在2025年7月10日到20日,趋势曲线一直维持红色,意味着多头趋势不变。但这段时间ETH的趋势曲线曾跌到超卖区,因此曲线曾在底部锁定3个K线的时间,这意味着是多头右侧追多的机会。)
交易信号
超买超卖信号+趋势判断
红色区域(超买):趋势曲线 ≥ 0.6 时,可能出现回调风险,注意趋势变化
绿色区域(超卖):趋势曲线 ≤ -0.615 时,可能出现反弹机会,注意趋势变化
使用注意事项
① 交易所推荐:同时使用币安(Binance)和OKX的BTC/USDT现货数据(不同交易所的量能差异可能影响信号准确性)。
② 特殊行情优化:已针对2024-2025年比特币ETF上市后的低波动行情调整参数,未来将持续根据市场变化优化。
③ 强趋势操作提示:当趋势曲线锁定在超买或超卖区,应减少逆势操作。
④ 首次使用建议:观察历史行情以验证信号特征,震荡市捕捉反转点,趋势市识别延续信号。
Trend Master Navigator (Simplified Version) User Guide
⚠ Important: Please read this guide carefully before using the indicator
This is a simplified version of the Trend Master Navigator.
Core Functionality This indicator analyzes Bitcoin's trading volume, MACD, RSI, trend strength, and volume ratio to generate the Trend Master Navigator, which oscillates between -1 and 1 to assist in buy/sell decisions. The indicator is best suited for 4-hour (4H) charts and is ideal for 1-2 week swing trading. The Trend Master Navigator is suitable for cryptocurrencies with high spot trading volumes, such as BTC, ETH, and DOGE.
Interpreting the Trend Curve
① Market States (Curve Colors) Dark Purple: Range-bound market Red Curve: Bullish trend Green Curve: Bearish trend
② Key Signal Zones Red Zone (Overbought): Trend curve ≥ 0.6 → Potential pullback risk Green Zone (Oversold): Trend curve ≤ -0.615 → Potential rebound opportunity
③ Locking Mechanism During strong bullish (red) and strong bearish (green) trends, and partial weak trends:
If the trend curve breaks above the red zone (overbought) and the market trend strength remains in a strong trend or robust weak trend, the trend curve will lock near 0.7 (original curve continues in gray).
If the trend curve breaks below the green zone (oversold) and the market trend strength remains in a strong trend or robust weak trend, the trend curve will lock near -0.7 (original curve continues in gray). This indicates that the trend may continue, and it is advisable to wait until the lock period ends before taking action. ✅ Example of extreme bullish trend: (e.g., ETH from July 10 to 20, 2025, where the trend curve remained red, indicating a persistent bullish trend. During this period, ETH's trend curve dipped into the oversold zone, locking the curve at the bottom for 3 K-line periods, signifying a right-side buying opportunity in the bullish trend.)
Trading Signals
Overbought/Oversold Signals + Trend Judgment
Red Zone (Overbought): Trend curve ≥ 0.6 → Potential pullback risk, pay attention to trend changes
Green Zone (Oversold): Trend curve ≤ -0.615 → Potential rebound opportunity, pay attention to trend changes
Usage Notes
① Exchange Recommendation: Use Binance and OKX BTC/USDT spot data simultaneously (volume discrepancies across different exchanges may affect signal accuracy).
② Special Market Optimization: Parameters have been adjusted for the low-volatility era following the Bitcoin ETF launch (2024-2025) and will continue to be optimized based on market changes.
③ Strong Trend Operation Tips: When the trend curve is locked in overbought or oversold zones, reduce counter-trend operations. ④ First Use Recommendation: Observe historical market trends to validate signal characteristics. Capture reversal points in range-bound markets and identify continuation signals in trending markets.
Contact on X: Jeffmo0769
Trend Following Bundle [ActiveQuants]The Trend Following Bundle indicator is a comprehensive toolkit designed to equip traders with a suite of essential technical analysis tools focused on identifying , confirming , and capitalizing on market trends . By bundling popular indicators like Moving Averages , MACD , Supertrend , ADX , ATR , OBV , and the Choppiness Index into a single script, it streamlines chart analysis and enhances strategy development.
This bundle operates on the principle that combining signals from multiple, complementary indicators provides a more robust view of market trends than relying on a single tool. It integrates:
Trend Direction: Moving Averages, Supertrend.
Momentum: MACD.
Trend Strength: ADX.
Volume Pressure: On Balance Volume (OBV).
Volatility: Average True Range (ATR).
Market Condition Filter: Choppiness Index (Trend vs. Range).
By allowing users to selectively enable, customize, and view these indicators (potentially across different timeframes), the bundle facilitates nuanced and layered trend analysis.
█ KEY FEATURES
All-in-One Convenience: Access multiple core trend-following indicators within a single TradingView script slot.
Modular Design: Easily toggle each individual indicator (MAs, MACD, Supertrend, etc.) On or Off via the settings menu to customize your chart view.
Extensive Customization: Fine-tune parameters (lengths, sources, MA types, colors, etc.) for every included indicator to match your trading style and the specific asset.
Multi-Timeframe (MTF) Capability: Configure each indicator component to analyze data from a different timeframe than the chart's, allowing for higher-level trend context.
Integrated Alerts: Pre-built alert conditions for key events like Moving Average crossovers , MACD signals , Supertrend flips , and Choppiness Index threshold crosses . Easily set up alerts through TradingView's alert system.
When configuring your alerts in TradingView, pay close attention to the trigger option:
- Setting it to " Only Once " will trigger the alert the first time the condition is met, which might happen during an unclosed bar (intra-bar). This alert instance will then cease.
- Setting it to " Once Per Bar Close " will trigger the alert only after a bar closes if the condition was met on that finalized bar. This ensures signals are based on confirmed data and allows the alert to potentially trigger again on subsequent closing bars if the condition persists or reoccurs. Use this option for signals based on confirmed, closed-bar data.
MA Smoothing & Bands (Optional): Apply secondary smoothing or Bollinger Bands directly to the Fast and Slow Moving Averages for advanced analysis.
█ USER INPUTS
Fast MA:
On/Off: Enables/Disables the Fast Moving Average plot and related smoothing/bands.
Type: Selects the primary calculation type (SMA, EMA, SMMA (RMA), WMA, VWMA). Default: EMA.
Source: Input data for the MA calculation (e.g., close, open, hl2). Default: close.
Length: Lookback period for the primary MA calculation. Default: 9.
Color: Sets the color of the primary Fast MA line. Default: Yellow.
Line Width: Sets the thickness of the primary Fast MA line. Default: 2.
Smoothing Type: Selects secondary smoothing type applied to the primary MA (e.g., None, SMA, EMA) or adds Bollinger Bands (SMA + Bollinger Bands). Default: None.
Smoothing Length: Lookback period for the secondary smoothing MA or the basis MA for Bollinger Bands. Relevant only if Smoothing Type is not " None ". Default: 10.
BB StdDev: Standard deviation multiplier for Bollinger Bands. Relevant only if Smoothing Type is " SMA + Bollinger Bands ". Default: 2.0.
Timeframe: Sets a specific timeframe for the MA calculation. Default: Chart.
Wait TF Close: If a timeframe is set, waits for that timeframe's bar to close before plotting, preventing repainting. Default: true.
Slow MA:
On/Off: Enables/Disables the Slow Moving Average plot and related smoothing/bands.
Type: Selects the primary calculation type (SMA, EMA, SMMA (RMA), WMA, VWMA). Default: EMA.
Source: Input data for the MA calculation (e.g., close, open, hl2). Default: close.
Length: Lookback period for the primary MA calculation. Default: 9.
Color: Sets the color of the primary Slow MA line. Default: Yellow.
Line Width: Sets the thickness of the primary Slow MA line. Default: 2.
Smoothing Type: Selects secondary smoothing type applied to the primary MA (e.g., None, SMA, EMA) or adds Bollinger Bands (SMA + Bollinger Bands). Default: None.
Smoothing Length: Lookback period for the secondary smoothing MA or the basis MA for Bollinger Bands. Relevant only if Smoothing Type is not " None ". Default: 10.
BB StdDev: Standard deviation multiplier for Bollinger Bands. Relevant only if Smoothing Type is " SMA + Bollinger Bands ". Default: 2.0.
Timeframe: Sets a specific timeframe for the MA calculation. Default: Chart.
Wait TF Close: If a timeframe is set, waits for that timeframe's bar to close before plotting, preventing repainting. Default: true.
MACD:
On/Off: Enables/Disables the MACD plots (MACD line, Signal line, Histogram).
Fast Length: Lookback period for the fast MA in MACD calculation. Default: 12.
Slow Length: Lookback period for the slow MA in MACD calculation. Default: 26.
Source: Input data for the MACD MAs. Default: close.
Signal Smoothing: Lookback period for the Signal Line MA. Default: 9.
Oscillator MA Type: Calculation type for Fast and Slow MAs (SMA, EMA). Default: EMA.
Signal Line MA Type: Calculation type for Signal Line MA (SMA, EMA). Default: EMA.
MACD Color: Color of the MACD line. Default: #2962FF.
MACD Signal Color: Color of the Signal line. Default: #FF6D00.
Timeframe: Sets a specific timeframe for the MACD calculation. Default: Chart.
Wait TF Close: If a timeframe is set, waits for that timeframe's bar to close. Default: true.
On Balance Volume (OBV):
On/Off: Enables/Disables the OBV plot and its related MAs/Bands.
Type (MA Smoothing): Selects MA type for smoothing OBV (None, SMA, EMA, etc.) or SMA + Bollinger Bands. Default: None.
Length (MA Smoothing): Lookback period for the OBV smoothing MA. Default: 14.
BB StdDev: Standard deviation multiplier for Bollinger Bands if selected. Default: 2.0.
Color: Color of the main OBV line. Default: #2962FF.
Timeframe: Sets a specific timeframe for the OBV calculation. Default: Chart.
Wait TF Close: If a timeframe is set, waits for that timeframe's bar to close. Default: true.
ADX:
On/Off: Enables/Disables the ADX plot.
ADX Smoothing: Lookback period for the ADX smoothing component. Default: 14.
DI Length: Lookback period for the Directional Movement (+DI/-DI) calculation. Default: 14.
Color: Color of the ADX line. Default: Red.
Timeframe: Sets a specific timeframe for the ADX calculation. Default: Chart.
Wait TF Close: If a timeframe is set, waits for that timeframe's bar to close. Default: true.
ATR:
On/Off: Enables/Disables the ATR plot.
Length: Lookback period for the ATR calculation. Default: 14.
Smoothing: Selects the calculation type for ATR (SMMA (RMA), SMA, EMA, WMA). Default: SMMA (RMA).
Color: Color of the ATR line. Default: #B71C1C.
Timeframe: Sets a specific timeframe for the ATR calculation. Default: Chart.
Wait TF Close: If a timeframe is set, waits for that timeframe's bar to close. Default: true.
Supertrend:
On/Off: Enables/Disables the Supertrend plot and background fill.
ATR Length: Lookback period for the ATR calculation within Supertrend. Default: 10.
Factor: Multiplier for the ATR value used to calculate the Supertrend bands. Default: 3.0.
Up Trend Color: Color for the Supertrend line and background during an uptrend. Default: Green.
Down Trend Color: Color for the Supertrend line and background during a downtrend. Default: Red.
Timeframe: Sets a specific timeframe for the Supertrend calculation. Default: Chart.
Wait TF Close: If a timeframe is set, waits for that timeframe's bar to close. Default: true.
Choppiness Index:
On/Off: Enables/Disables the Choppiness Index plot and bands.
Length: Lookback period for the Choppiness Index calculation. Default: 14.
Offset: Shifts the plot left or right. Default: 0.
Color: Color of the Choppiness Index line. Default: #2962FF.
Timeframe: Sets a specific timeframe for the CI calculation. Default: Chart.
Wait TF Close: If a timeframe is set, waits for that timeframe's bar to close. Default: true.
█ STRATEGY EXAMPLES
The following strategy examples are provided for illustrative and educational purposes only to demonstrate how indicators within this bundle could be combined. They do not constitute financial advice or trading recommendations. Always conduct your own thorough research and backtesting before implementing any trading strategy.
Here are a few ways the indicators in this bundle can be combined:
1. MA Crossover with Multi-Factor Confirmation
Goal: Enter trends early with confirmation from momentum and trend strength, while filtering out choppy conditions.
Setup: Enable Fast MA (e.g., 9 EMA), Slow MA (e.g., 50 EMA), MACD, ADX, and Choppiness Index.
Entry (Long):
- Price > Slow MA (Establishes broader uptrend context).
- Fast MA crosses above Slow MA OR Price crosses above Fast MA.
- MACD Histogram > 0 (Confirms bullish momentum).
- ADX > 20 or 25 (Indicates sufficient trend strength).
- Choppiness Index < 61.8 (Filters out excessively choppy markets).
Entry (Short): Reverse logic (except for ADX and Choppiness Index).
Management: Consider using the Supertrend or an ATR multiple for stop-loss placement.
Image showing a chart with 2:1 long and short trades, highlighting a candle disqualified for a long entry due to ADX below 20.
2. Supertrend Breakout Strategy
Goal: Use Supertrend for primary signals and stops, confirming with volume and trend strength.
Setup: Enable Supertrend, Slow MA, ADX, and OBV.
Entry (Long):
- Supertrend line turns green and price closes above it.
- Price > Slow MA (Optional filter for alignment with larger trend).
- ADX is rising or above 20 (Confirms trending conditions).
- OBV is generally rising or breaks a recent resistance level (Confirms volume supporting the move).
Entry (Short): Reverse logic (except for ADX and OBV).
Management: Initial stop-loss placed just below the green Supertrend line (for longs) or above the red line (for shorts). Trail stop as Supertrend moves.
Image showing a chart with a 2:1 long trade, one candle disqualified for a short entry, and another disqualified for a long entry.
3. Trend Continuation Pullbacks
Goal: Enter established trends during pullbacks to value areas defined by MAs or Supertrend.
Setup: Enable Slow MA, Fast MA (or Supertrend), MACD, and ADX.
Entry (Long):
- Price is consistently above the Slow MA (Strong uptrend established).
- ADX > 25 (Confirms strong trend).
- Price pulls back towards the Fast MA or the green Supertrend line.
- MACD Histogram was decreasing during the pullback but turns positive again OR MACD line crosses above Signal line near the MA/Supertrend level (Indicates momentum resuming).
Entry (Short): Reverse logic (except for ADX) during a confirmed downtrend.
Management: Stop-loss below the recent swing low or the Slow MA/Supertrend level.
Image showing a chart with 2:1 long and short trades, where price pulls back to the fast MA and the MACD histogram changes color, indicating shifts in momentum during the pullbacks.
█ CONCLUSION
The Trend Following Bundle offers a powerful and flexible solution for traders focused on trend-based strategies. By consolidating essential indicators into one script with deep customization, multi-timeframe analysis, and built-in alerts, it simplifies the analytical workflow and allows for the development of robust, multi-conditional trading systems. Whether used for confirming entries, identifying trend strength, managing risk, or filtering market conditions, this bundle provides a versatile foundation for technical analysis.
█ IMPORTANT NOTES
⚠ Parameter Tuning: Indicator settings (lengths, factors, thresholds) are not one-size-fits-all. Adjust them based on the asset being traded, its typical volatility, and the timeframe you are analyzing for optimal performance. Backtesting is crucial .
⚠ Multi-Timeframe Use: Using the Timeframe input allows for powerful analysis but be mindful of potential lag, especially if Wait TF Close is disabled. Signals based on higher timeframes will update only when that higher timeframe bar closes (if Wait TF Close is enabled).
⚠ Confirmation is Key: While the bundle provides many tools, avoid relying on a single indicator's signal. Use combinations to build confluence and increase the probability of successful trades.
⚠ Chart Clarity: With many indicators available, only enable those relevant to your current strategy to avoid overwhelming your chart. Use the On/Off toggles frequently.
⚠ Confirmed Bars Only: Like most TradingView indicators, signals and plots are finalized on the close of the bar. Be cautious acting on intra-bar signals which may change before the bar closes.
█ RISK DISCLAIMER
Trading involves substantial risk of loss and is not suitable for every investor. The Trend Following Bundle indicator provides technical analysis tools for educational and informational purposes only; it does not constitute financial advice or a recommendation to buy or sell any asset. Indicator signals identify potential patterns based on historical data but do not guarantee future price movements or profitability. Always conduct your own thorough analysis, use multiple sources of information, and implement robust risk management practices before making any trading decisions. Past performance is not indicative of future results.
📊 Happy trading! 🚀

Saral TrendSaral Trend
### Overview
The Saral Trend Indicator is a price-action-based tool designed to measure trend strength dynamically. Unlike traditional trend following indicators that rely solely on moving averages or fixed formulas, Saral Trend integrates Directional Movement, price positioning within the bar range, and volatility-adjusted trend weighting to create a clearer visualization of market momentum. By refining the classic trend following approach, this indicator provides more responsive and adaptive trend analysis across various timeframes.
### Key Features
Trend Histogram: Four types of bars indicate trend strength and momentum.
- Bullish Up: Higher than the previous bar; signals a strong uptrend; Color: Dark Blue.
- Bullish Down: Lower than the previous bar; suggests weakening momentum in an uptrend; Color: Light Blue.
- Bearish Up: Higher than the previous bar; signals a strong downtrend; Color: Dark Red.
- Bullish Down: Lower than the previous bar; suggests weakening momentum in a downtrend; Color: Light Red.
Trend Strength Line: A smoothed reference line that provides additional confirmation of momentum strength.
- When histogram bars are above this line, the trend is strong.
- When they fall below, momentum weakens.
Trend Pause Dots: Appear when the trend shows signs of temporary exhaustion, suggesting a possible short-term pause or reversal.
- A bullish pause dot on a bearish bar indicates a temporary halt in an uptrend before continuation or a reversal.
- A bearish pause dot on a bullish bar indicates a temporary halt in a downtrend before continuation or a reversal.
Oscillator Functionality: No fixed upper limit, but extreme bar values (e.g., above 100) suggest overbought or oversold conditions.
### Calculation Methodology
Analyzing Price Movement:
- The indicator calculates the difference between the highest and lowest prices over a period to determine price movement.
- It smooths these values using an Exponential Moving Average (EMA) to filter out short-term noise.
Identifying Trend:
- It compares the current high and low prices with their moving averages to determine whether the market is trending up or down.
- If the high price moves further from its average compared to the low price, it indicates bullish strength. Conversely, if the low price moves further from its average compared to high price, it signals bearish strength.
Evaluating Closing Price Position:
- The indicator analyzes where the closing price is within the high-low range.
- If the closing price is near the high, bullish strength is emphasized. If it is near the low, bearish strength is given more weight.
Measuring Trend Strength:
- The indicator applies volatility based smoothing techniques to measure positive and negative trend strength separately.
- A higher positive trend value suggests strong buying pressure, while a higher negative trend value indicates strong selling pressure.
- A dynamic smoothing approach ensures trend signals remain stable while reacting quickly to market shifts.
Visualizing Trend Strength with a Histogram:
- The indicator plots a positive and negative strength in form of histogram to represent the strength and direction of the trend.
- The color of the histogram bars changes based on whether the trend is strengthening or weakening.
- Blue shades indicate bullish trends, while red shades represent bearish trends.
Trend Reversal Detection: A trend pause or potential reversal is identified when the histogram weakens sharply, with dots appearing on bars as early warnings.
### How to Use It
Trend Direction: The colors of the histogram bars provide a visual clue about the ongoing trend - whether it's bullish or bearish - allowing traders to assess market sentiment at a glance.
Trend Confirmation: When histogram bars are consistently above the Trend Strength Line, it indicates strong momentum, confirming trade direction.
Momentum Shifts: A color shift (e.g., from Dark Blue to Light Blue) suggests weakening strength, which could indicate a pullback or reversal.
Reversal Signals: Trend Pause Dots highlight areas where momentum stalls, helping traders prepare for possible reversals or consolidations.
Timeframe Flexibility:
- Long-term traders can use weekly/monthly charts for macro trends.
- Swing traders can use daily/hourly charts to capture medium-term opportunities.
- Day traders can use 15-minute or lower timeframes for precise intraday entries.
### What Makes Saral Trend Unique?
Unlike conventional trend indicators that rely solely on moving averages, Saral Trend improves upon existing methods by:
Integrating price positioning within the range to make trend strength more responsive.
Applying volatility-adjusted trend weighting, ensuring trends are measured dynamically rather than through fixed lookback periods.
Providing multiple visual cues (histogram, strength line, and pause dots) to help traders make informed decisions.
This indicator is optimized for simplicity and efficiency , making it suitable for traders across different styles, from long-term investors to intraday scalpers.
By combining trend structure, momentum shifts, and volatility adaptation , Saral Trend delivers a comprehensive and actionable trend analysis tool for TradingView users.

Logarithmic Regression Channel-Trend [BigBeluga]
This indicator utilizes logarithmic regression to track price trends and identify overbought and oversold conditions within a trend. It provides traders with a dynamic channel based on logarithmic regression, offering insights into trend strength and potential reversal zones.
🔵Key Features:
Logarithmic Regression Trend Tracking: Uses log regression to model price trends and determine trend direction dynamically.
f_log_regression(src, length) =>
float sumX = 0.0
float sumY = 0.0
float sumXSqr = 0.0
float sumXY = 0.0
for i = 0 to length - 1
val = math.log(src )
per = i + 1.0
sumX += per
sumY += val
sumXSqr += per * per
sumXY += val * per
slope = (length * sumXY - sumX * sumY) / (length * sumXSqr - sumX * sumX)
average = sumY / length
intercept = average - slope * sumX / length + slope
Regression-Based Channel: Plots a log regression channel around the price to highlight overbought and oversold conditions.
Adaptive Trend Colors: The color of the regression trend adjusts dynamically based on price movement.
Trend Shift Signals: Marks trend reversals when the log regression line cross the log regression line 3 bars back.
Dashboard for Key Insights: Displays:
- The regression slope (multiplied by 100 for better scale).
- The direction of the regression channel.
- The trend status of the logarithmic regression band.
🔵Usage:
Trend Identification: Observe the regression slope and channel direction to determine bullish or bearish trends.
Overbought/Oversold Conditions: Use the channel boundaries to spot potential reversal zones when price deviates significantly.
Breakout & Continuation Signals: Price breaking outside the channel may indicate strong trend continuation or exhaustion.
Confirmation with Other Indicators: Combine with volume or momentum indicators to strengthen trend confirmation.
Customizable Display: Users can modify the lookback period, channel width, midline visibility, and color preferences.
Logarithmic Regression Channel-Trend is an essential tool for traders who want a dynamic, regression-based approach to market trends while monitoring potential price extremes.

Dual Trendline Breakout [Splirus]This advanced trading tool leverages the power of dual pivot-based trendlines to provide traders with a superior edge in identifying potential breakout and retest opportunities. By combining two separate pivot lengths, the indicator creates both primary and secondary trendlines, enabling more robust confluence and decision-making in your trading strategy.
Key Features:
1. Dual Pivot Analysis:
Primary Trendline: Uses a shorter pivot length to capture immediate price movements and breakout scenarios.
Secondary Trendline: Employs a longer pivot length for broader trend identification and confirmation.
2. Enhanced Confluence:
The combination of short-term and long-term trendlines provides stronger signals, reducing false positives and enhancing accuracy.
3. Dynamic Visualization:
Automatically plots trendlines and extends them until they are crossed.
Distinct colors for uptrend and downtrend lines for easy interpretation.
Highlights where price breaks above or below the trendlines with bar coloring.
4. Alerts for Key Events:
Alerts are triggered for breakout and retest scenarios, ensuring you never miss critical market movements.
5. Customizable Settings:
Adjust pivot lengths, trendline colors, and visualization preferences to suit your trading style.
Optional settings for showing only the most recent trendlines, hiding crossed lines, and extending lines dynamically.
How It Works:
The indicator identifies pivot highs and lows based on the specified lengths for both primary and secondary trendlines.
When price interacts with these trendlines (breakout, retest, or cross), it highlights the event with customizable bar colors and optional alerts.
By monitoring these interactions, traders can better time their entries and exits, leveraging the dual-period analysis for stronger market confluence.
Ideal Use Cases:
Scalping: Use primary trendlines for quick trade opportunities.
Swing Trading: Combine primary and secondary trendlines for more significant market moves.
Trend Continuation or Reversal: Identify breakout confirmations or retests for confident trade setups.
This indicator is a powerful addition to any trader's toolkit, offering precision, adaptability, and actionable insights for navigating the markets with confidence.
Its closed-source design ensures that the unique advantages of the Dual Trendline identification algorithm remain exclusive to its users, providing an edge that cannot be duplicated elsewhere.

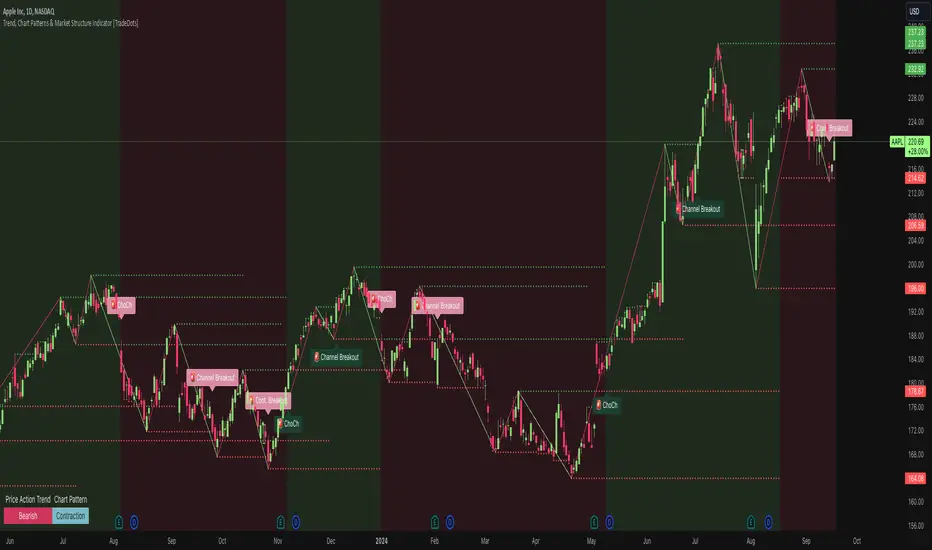
Trend, Chart Patterns & Market Structure Indicator [TradeDots]The "Trend, Chart Patterns & Market Structure Indicator" is engineered to identify pivotal price action points, revealing shifts in market dynamics. This tool aids traders to simplify any trading market in recognizing significant price levels, enhancing decision-making in diverse market conditions.
📝 HOW IT WORKS
Pivot Identification
The indicator detects pivots in price action using a complex mathematical model by analyzing a window of candlesticks to capture significant reversal patterns. It examines a series of bars, focusing on their open, high, low, close, and changes in these values, to pinpoint potential market turning points.
Support and Resistance Lines
Calculation: Automatically draws lines at key price pivots in bullish and bearish markets.
Significance: Aligning support and resistance levels highlights strong demand or supply zones, reinforcing trading biases. When multiple lines converge near a price level, it indicates robust support or resistance, as many traders focus on these levels for placing trades.
Chart Patterns Analysis
Formation: Utilizes four pivots to identify patterns such as ascending/descending channels, contraction, and expansion patterns.
Visualization: Background colors (green for bullish, red for bearish) help identify market trends.
Market Structure Shifts
Detection: Identifies price breakouts above or below previous support and resistance, indicating changes in market structure.
Confirmation: Highlights shifts in market character, aiding in trend reversal anticipation.
Types of Market Structure Shifts
Channel Breakout: The price breaks out from the current channel's resistance level.
Rev. Breakout: The price breaks out from a contraction pattern, moving in the opposite direction of the previous market trend.
Continuation Breakout: The price breaks out from a contraction pattern, continuing the previous market trend.
Change of Character (ChoCh): The price breaks out from either support or resistance, causing a change in the market trend.
🛠️ HOW TO USE
Chart Visualization
Color Coding: Background colors signify market trends, with green indicating bullish and red indicating bearish conditions.
Pattern Recognition: Identifies and labels patterns, providing insights into current market sentiment.
Reversal Signals
Signal Labels: Detects shifts in market structure indicating potential entry and exit points.
❗️LIMITATIONS
Market Noise: Accuracy may decrease in volatile and noisy markets.
Trend Confirmation Delay: Market trends are only confirmed once the price breaks out from support or resistance, potentially causing delays.
RISK DISCLAIMER
Trading involves substantial risk, and most traders may incur losses. All content, tools, scripts, articles, and education provided by TradeDots are for informational and educational purposes only.
Trend Titan Neutronstar [QuantraSystems]Trend Titan NEUTRONSTAR
Credits
The Trend Titan NEUTRONSTAR is a comprehensive aggregation of nearly 100 unique indicators and custom combinations, primarily developed from unique and public domain code.
We'd like to thank our TradingView community members: @IkKeOmar for allowing us to add his well-built "Normalized KAMA Oscillator" and "Adaptive Trend Lines " indicators to the aggregation, as well as @DojiEmoji for his valuable "Drift Study (Inspired by Monte Carlo Simulations with BM)".
Introduction
The Trend Titan NEUTRONSTAR is a robust trend following algorithm meticulously crafted to meet the demands of crypto investors. Designed with a multi layered aggregation approach, NEUTRONSTAR excels in navigating the unique volatility and rapid shifts of the cryptocurrency market. By stacking and refining a variety of carefully selected indicators, it combines their individual strengths while reducing the impact of noise or false signals. This "aggregation of aggregators" approach enables NEUTRONSTAR to produce a consistently reliable trend signal across assets and timeframes, making it an exceptional tool for investors focused on medium to long term market positioning.
NEUTRONSTAR ’s powerful trend following capabilities provide investors with straightforward, data driven analysis. It signals when tokens exhibit sustained upward momentum and systematically removes allocations from assets showing signs of weakness. This structure aids investors in recognizing peak market phases. In fact, one of NEUTRONSTAR ’s most valuable applications is its potential to help investors time exits near the peak of bull markets. This aims to maximize gains while mitigating exposure to downturns.
Ultimately, NEUTRONSTAR equips investors with a high precision, adaptable framework for strategic decision making. It offers robust support to identify strong trends, manage risk, and navigate the dynamic crypto market landscape.
With over a year of rigorous forward testing and live trading, NEUTRONSTAR demonstrates remarkable robustness and effectiveness, maintaining its performance without succumbing to overfitting. The system has been purposefully designed to avoid unnecessary optimization to past data, ensuring it can adapt as market conditions evolve. By focusing on aggregating valuable trend signals rather than tuning to historical performance, the NEUTRONSTAR serves as a reliable universal trend following system that aligns with the natural market cycles of growth and correction.
Core Methodology
The foundation of the NEUTRONSTAR lies in its multi aggregated structure, where five custom developed trend models are combined to capture the dominant market direction. Each of these aggregates has been carefully crafted with a specific trend signaling period in mind, allowing it to adapt seamlessly across various timeframes and asset classes. Here’s a breakdown of the key components:
FLARE - The original Quantra Signaling Matrix (QSM) model, best suited for timeframes above 12 hours. It forms the foundation of long term trend detection, providing stable signals.
FLAREV2 - A refined and more sophisticated model that performs well across both high and low timeframes, adding a layer of adaptability to the system.
NEBULA - An advanced model combining FLARE and FLAREV2. NEBULA brings the advantages of both components together, enhancing reliability and capturing smoother, more accurate trends.
SPARK - A high speed trend aggregator based on the QSM Universal model. It focuses on fast moving trends, providing early signals of potential shifts.
SUNBURST - A balanced aggregate that combines elements of SPARK and FLARE, confirming SPARK’s signals while minimizing false positives.
Each of these models contributes its own unique perspective on market movement. By layering fast, medium, and slower trend following signals, NEUTRONSTAR can confirm strong trends while filtering out shorter term noise. The result is a comprehensive tool that signals clear market direction with minimized false signals.
A Unique Approach to Trend Aggregation
One of the defining characteristics of NEUTRONSTAR is its deliberate choice to avoid perfectly time coherent indicators within its aggregation. In simpler terms, NEUTRONSTAR purposefully incorporates trend following indicators with slightly different signal periods, rather than synchronizing all components to a single signaling period. This choice brings significant benefits in terms of diversification, adaptability, and robustness of the overall trend signal.
When aggregating multiple trend following components, if all indicators were perfectly time coherent - meaning they responded to market changes in exactly the same way and over the time periods - the resulting signal would effectively be no different from a single trend following indicator. This uniformity would limit the system’s ability to capture a variety of market conditions, leaving it vulnerable to the same noise or false signals that any single indicator might encounter. Instead, NEUTRONSTAR leverages a balanced mix of indicators with varied timing: some fast, some slower, and some in the medium range. This choice allows the system to extract the unique strengths of each component, creating a combined signal that is stronger and more reliable than any single indicator.
By incorporating different signal periods, NEUTRONSTAR achieves what can be thought of as a form of edge accumulation. The fast components within NEUTRONSTAR , for example, are highly sensitive to quick shifts in market direction. These indicators excel at identifying early trend signals, enabling NEUTRONSTAR to react swiftly to emerging momentum. However, these fast indicators alone would be prone to reacting to market noise, potentially generating too many premature signals. This is where the medium term indicators come into play. These components operate with a slower reaction time, filtering out the short term fluctuations and confirming the direction of the trend established by the faster indicators. The combination of these varying signal speeds results in a balanced, adaptive response to market changes.
This approach also allows NEUTRONSTAR to adapt to different market regimes seamlessly. In fast moving, volatile markets, the faster indicators provide an early alert to potential trend shifts, while the slower components offer a stabilizing influence, preventing overreaction to temporary noise. Conversely, in steadier or trending markets, the medium and slower indicators sustain the trend signal, reducing the likelihood of premature exits. This flexible design enhances NEUTRONSTAR ’s ability to operate effectively across multiple asset classes and timeframes, from short term fluctuations to longer term market cycles.
The result is a powerful, multi-layered trend following tool that remains adaptive, capturing the benefits of both fast and medium paced reactions without becoming overly sensitive to short term noise. This unique aggregation methodology also supports NEUTRONSTAR ’s robustness, reducing the risk of overfitting to historical data and ensuring that the system can perform reliably in forward testing and live trading environments. The slightly staggered signal periods provide a greater degree of resilience, making NEUTRONSTAR a dependable choice for traders looking to capitalize on sustained trends while minimizing exposure during periods of market uncertainty.
In summary, the lack of perfect time coherence among NEUTRONSTAR ’s sub components is not a flaw - but a deliberate, robust design choice.
Risk Management through Market Mode Analysis
An essential part of NEUTRONSTAR is its ability to assess the market's underlying behavior and adapt accordingly. It employs a Market Mode Analysis mechanism that identifies when the market is either in a “Trending State” or a “Mean Reverting State.” When enough confidence is established that the market is trending, the system confirms and signals a “Trending State,” which is optimal for maintaining positions in the direction of the trend. Conversely, if there’s insufficient confidence, it labels the market as “Mean Reverting,” alerting traders to potentially avoid trend trades during likely sideways movement.
This distinction is particularly valuable in crypto, where asset prices often oscillate between aggressive trends and consolidation periods. The Market Mode Analysis keeps traders aligned with the broader market conditions, minimizing exposure during periods of potential whipsaws and maximizing gains during sustained trends.
Zero Overfitting: Design and Testing for Real World Resilience
Unlike many trend following indicators that rely heavily on backtesting and optimization, NEUTRONSTAR was built to perform well in forward testing and live trading without post design adjustments. Over a year of live market exposure has all but proven its robustness, with the system’s methodology focused on universal applicability and simplicity rather than curve fitting to past data. This approach ensures the aggregator remains effective across different market cycles and maintains relevance as new data unfolds.
By avoiding overfitting, NEUTRONSTAR is inherently more resistant to the common issue of strategy degradation over time, making it a valuable tool for traders seeking reliable market analysis you can trust for the long term.
Settings and Customization Options
To accommodate a range of trading styles and market conditions, NEUTRONSTAR includes adjustable settings that allow for fine tuning sensitivity and signal generation:
Calculation Method - Users can choose between calculating the NEUTRONSTAR score based on aggregated scores or by using the state of individual aggregates (long, neutral, short). The score method provides faster signals with slightly more noise, while the state based approach offers a smoother signal.
Sensitivity Threshold - This setting adjusts the system’s sensitivity, defining the width of the neutral zone. Higher thresholds reduce sensitivity, allowing for a broader range of volatility before triggering a trend reversal.
Market Regime Sensitivity - A sensitivity adjustment, ranging from 0 to 100, that affects the sensitivity of the sub components in market regime calculation.
These settings offer flexibility for users to tailor NEUTRONSTAR to their specific needs, whether for medium term investment strategies or shorter term trading setups.
Visualization and Legend
For intuitive usability, NEUTRONSTAR uses color coded bar overlays to indicate trend direction:
Green - indicates an uptrend.
Gray - signals a neutral or transition phase.
Purple - denotes a downtrend.
An optional background color can be enabled for market mode visualization, indicating the overall market state as either trending or mean reverting. This feature allows traders to assess trend direction and strength at a glance, simplifying decision making.
Additional Metrics Table
To support strategic decision making, NEUTRONSTAR includes an additional metrics table for in depth analysis:
Performance Ratios - Sharpe, Sortino, and Omega ratios assess the asset’s risk adjusted returns.
Volatility Insights - Provides an average volatility measure, valuable for understanding market stability.
Beta Measurement - Calculates asset beta against BTC, offering insight into asset volatility in the context of the broader market.
These metrics provide deeper insights into individual asset behavior, supporting more informed trend based allocations. The table is fully customizable, allowing traders to adjust the position and size for a seamless integration into their workspace.
Final Summary
The Trend Titan NEUTRONSTAR indicator is a powerful and resilient trend following system for crypto markets, built with a unique aggregation of high performance models to deliver dependable, noise reduced trend signals. Its robust design, free from overfitting, ensures adaptability across various assets and timeframes. With customizable sensitivity settings, intuitive color coded visualization, and an advanced risk metrics table, NEUTRONSTAR provides traders with a comprehensive tool for identifying and riding profitable trends, while safeguarding capital during unfavorable market phases.

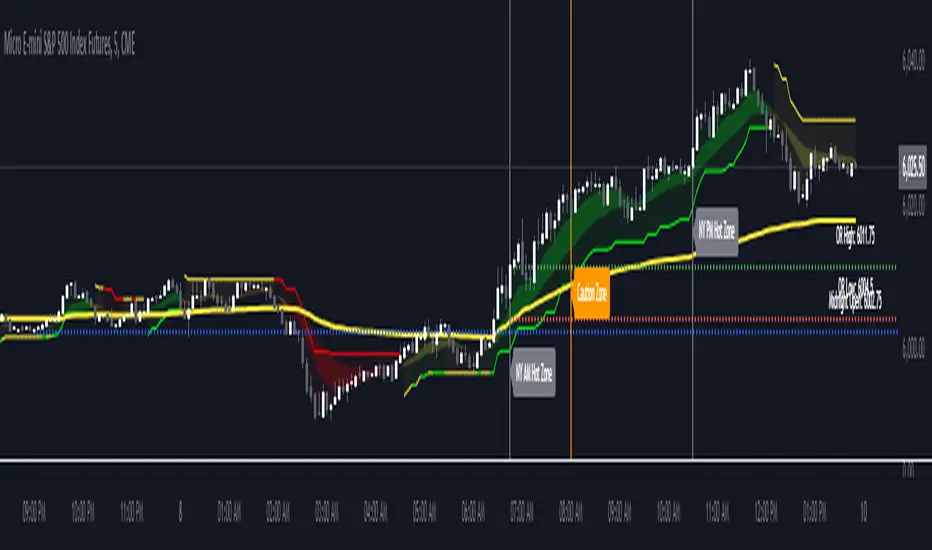
The Forexation: Super Trend SignalsOverview:
The Forexation: Super Trend Signals (STS) indicator was crafted to enhance visualization of market trends by integrating multiple technical analysis tools and adding logic to them so they color bullish, bearish, counter trends, and cautious trends. By combining standard and higher-timeframe Supertrends with dynamic EMAs and VWAP, STS offers a multi-dimensional view of market dynamics. This synergy allows traders to:
Assess Trend Strength and Alignment
Identify Momentum Shifts and Reversals
Gauge Market Sentiment through Volume-Weighted Pricing
Filter Out Market Noise for Clearer Signals
Key Features and Synergy:
1. Dual Supertrend Analysis:
Standard Supertrend:
Utilizes the Average True Range (ATR) and a multiplier factor to detect immediate market trends.
Customizable ATR Length and Factor to adjust sensitivity to market volatility.
Used as a guide to help follow the trend and identify where if price breaks through we can be reversing trend or entering a counter/cautious trend.
Higher Time Frame (HTF) Supertrend:
Integrates Supertrend data from a higher timeframe for a broader market perspective.
Smoothing applied via an EMA to reduce lag and false signals.
**Synergistic Effect:
Trend Alignment: By analyzing both standard and HTF Supertrends, STS identifies when short-term trends align with long-term trends, increasing the reliability of trend signals.
Dynamic Adjustments: Traders can adjust parameters to fine-tune the balance between responsiveness and stability.
2. Customized EMAs with Contextual Color-Coding:
Fast and Slow EMAs:
Customizable periods to match different trading strategies and timeframes.
EMAs are used to identify momentum shifts and potential reversals through crossovers.
Dynamic Color-Coding:
EMA lines change color based on their relationship with each other, the Supertrends, and VWAP.
Visual Interpretation:
Bullish Alignment: Fast EMA above Slow EMA, both above Supertrend and VWAP, signals strong upward momentum.
Bearish Alignment: Fast EMA below Slow EMA, both below Supertrend and VWAP, signals strong downward momentum.
Caution Zones: Misalignment or crossovers indicate potential reversals or consolidation.
**Synergistic Effect:
Momentum Confirmation: EMA crossovers are validated against Supertrend directions, reducing false signals.
Support and Resistance Zones: The area between EMAs acts as dynamic support/resistance, visualized through an optional fill.
3. VWAP Integration for Volume-Weighted Insights:
VWAP Analysis:
Calculates the average price weighted by volume, providing insights into institutional trading levels and market sentiment.
**Synergistic Effect:
Trend Validation: Confirms trend strength by analyzing whether price and EMAs are above or below VWAP.
Counter-Trend Detection: Identifies potential pullbacks or reversals when price interacts with VWAP against the prevailing trend of the standard and higher time frame SuperTrend.
4. Composite Signal Generation:
Color-Coded Market Conditions:
Bullish Signals (Green): Strong upward trends with alignment across standard + HTF Supertrend, EMAs, and price above VWAP.
Bearish Signals (Red): Strong downward trends with inverse alignment.
Caution State (Orange): Potential market reversals or uncertainty when indicators are misaligned. (Example: price above VWAP but under HTF SuperTrend)
Counter-Trend Conditions (Yellow): Signals possible pullbacks or consolidations when price or EMAs cross VWAP. (Example: Price is above VWAP & HTF SuperTrend but the EMAs and Standard SuperTrend are in a down trend)
**Synergistic Effect:
Enhanced Signal Accuracy: By requiring multiple confirmations across different indicators and timeframes, STS filters out noise and increases the probability of trends in the market.
Timely Alerts: Alerts are generated when critical conditions are met, keeping traders informed of significant market movements.
Underlying Concepts and Calculations:
Supertrend Algorithm:
Calculation:
Supertrend is calculated using ATR to set a dynamic trailing stop that follows price movements.
The indicator switches between bullish and bearish modes when price crosses the Supertrend line.
Customization:
ATR Length and Factor can be adjusted to make the Supertrend more or less sensitive to price changes.
In STS: Both standard and HTF Supertrends are used, with the HTF providing longer-term trend context.
Exponential Moving Averages (EMAs):
Calculation:
EMAs apply more weight to recent prices, making them more responsive than Simple Moving Averages (SMAs).
Crossovers between Fast and Slow EMAs signal potential momentum shifts.
Customization:
Periods for Fast and Slow EMAs are user-defined to suit different trading styles.
In STS: EMA behavior is analyzed in conjunction with Supertrend and VWAP to validate signals.
Volume Weighted Average Price (VWAP):
Calculation:
VWAP accumulates total dollars traded (price times volume) divided by total volume over a specific period.
Reflects the average price at which the instrument has traded throughout the day based on both price and volume.
**In STS:
VWAP serves as a dynamic support/resistance level.
Interaction with VWAP can indicate shifts in market sentiment, especially when combined with other indicators.
Justifying the Value of STS:
Holistic Market Analysis:
STS doesn't just merge indicators; it creates a cohesive system where each component validates and enhances the others.
This integrated approach offers a more reliable analysis than using individual indicators in isolation.
Customizable and Adaptive:
Traders have control over key parameters, allowing STS to be tailored to different markets and trading styles.
The ability to adjust sensitivity helps in adapting to varying market conditions.
Enhanced Decision-Making:
By providing clear visual cues and alerts, STS aids in quick interpretation of complex market data.
The indicator helps in identifying high-probability trend opportunities and managing risk effectively with trailing SuperTrend guidance.
Unique Signal Filtering:
The combination of multiple confirmations reduces the likelihood of false trend signals.
The use of higher timeframe data and volume-weighted analysis adds depth to trend assessment.
How to Use STS Effectively:
1. Configuring Settings:
Supertrend Settings:
Adjust ATR Length and Factor to set the desired sensitivity.
Select the Higher Time Frame for the HTF Supertrend to align with your trading horizon.
Set the Smoothing Period for the EMA applied to the HTF Supertrend.
EMA Settings:
Define periods for Fast and Slow EMAs based on your strategy.
Ensure the Fast EMA period is shorter than the Slow EMA for effective crossovers.
Color and Display Settings:
Customize colors for different market conditions to enhance visual clarity.
Choose whether to display the HTF Supertrend, EMA lines, EMA fill, and VWAP.
2. Interpreting Signals:
Bullish Scenario:
Supertrends indicate an uptrend.
Fast EMA crosses above Slow EMA, both trending upwards.
Price and EMAs are above VWAP.
Action: Consider long positions, using the standard Supertrend as a trailing stop.
Bearish Scenario:
Supertrends indicate a downtrend.
Fast EMA crosses below Slow EMA, both trending downwards.
Price and EMAs are below VWAP.
Action: Consider short positions. using the standard Supertrend as a trailing stop
Caution and Counter-Trend Signals:
Misalignment between indicators or color changes to orange/yellow.
Action: Exercise caution, tighten stops, or wait for clearer signals.
4. Setting Up Alerts:
Access the Alerts menu.
Configure alerts for:
Supertrend Direction Changes
EMA Crossovers
Price Crossing VWAP
Set alert actions and ensure they trigger on confirmed data by selecting "Once Per Bar Close."
Example Trading Strategies:
Trend Following:
Use STS to identify strong trends where all indicators are aligned.
Enter positions in the direction of the trend.
Use Supertrend lines as dynamic stop-loss levels.
Pullback Entries:
Wait for price to pull back to the EMA fill area or VWAP in a prevailing trend.
Look for bounce signals off these levels when supported by Supertrend direction.
Counter-Trend Opportunities:
Identify potential reversals when caution or counter-trend signals appear.
Confirm with additional analysis or indicators before taking positions against the main trend.
Disclaimer:
This indicator is intended to aid in technical analysis and should be used as part of a comprehensive trading strategy. It does not guarantee profits and carries the risk of loss. Trading financial instruments involves significant risk; please consult with a qualified financial advisor before making any investment decisions. Past performance is not indicative of future results.
Final Notes:
The Forexation: Super Trend Signals (STS) indicator represents a thoughtfully engineered tool that brings together multiple technical elements to provide a more nuanced understanding of market behavior. By leveraging the strengths of Supertrend, EMAs, and VWAP in unison, STS aims to enhance trading precision and confidence in the trends the market creates but also guide risk management levels for managing a trade and stop loss areas.
We are committed to continuous improvement and value user feedback. Please share your experiences and suggestions to help us refine the indicator further.
Happy Trading!
Trailing Stop Loss Smart [TradingFinder] Market Trend + CVD/EMA🔵 Introduction
Trailing Stop Loss (TSL) is one of the most powerful tools available. A Trailing Stop Loss is a modification of a typical stop order that adjusts dynamically based on market price movement. It can be set at a defined percentage or dollar amount away from the security's current market price, making it a flexible tool for locking in profits while minimizing risk. Unlike standard stop-loss orders, a Trailing Stop follows the market in the direction of the trade, protecting gains without requiring constant manual adjustments.
The Trailing Stop Loss Smart (TFlab Trailing Stop) indicator takes this concept even further by incorporating advanced metrics like Cumulative Volume Delta (CVD), volume dynamics, and Average True Range (ATR). This combination not only enhances risk management but also acts as a trend identifier, providing traders with a powerful tool to capitalize on both short-term and long-term price movements.
This indicator also supports various Order Types, allowing for flexible strategies that include a trailing stop/stop-loss combo to maximize winning trades while minimizing losses. The trailing stop limit is particularly useful for traders who want to set their stop at a precise level relative to the current market price, either by a percentage or a dollar amount. The Trailing Stop Loss Smart indicator can help ensure that traders do not exit too early during trends, while the stop-loss feature kicks in during reversals.
The advantages of using a Trailing Stop Loss are its ability to protect profits and reduce the emotional decision-making process in volatile markets. However, like all trading strategies, it has disadvantages, such as the risk of triggering too early during normal market fluctuations. By understanding how the Trailing Stop Loss Smart indicator integrates features like CVD, ATR, and volume analysis, traders can leverage its full potential while navigating these pros and cons.
With its unique ability to track market movements and trends using Cumulative Volume Delta, volume dynamics, and ATR-based trailing stops, this indicator offers a complete solution for traders looking to secure profits while minimizing downside risk. Whether you're employing a simple trailing stop or a trailing stop/stop-loss combo, this tool provides all the flexibility and precision needed to execute winning trades in various markets, including Forex, Crypto, and Stock.
🔵 How to Use
The Trailing Stop Loss Smart indicator integrates multiple advanced components to provide traders with superior risk management and trend identification.
Here’s how each part of the logic works :
🟣 Cumulative Volume Delta (CVD) Logic
The CVD tracks buying and selling pressure by calculating the difference between upward and downward price movements. When there’s more buying pressure, the CVD is positive, indicating a potential bullish trend. Conversely, more selling pressure results in a negative CVD, pointing to a bearish trend.
CVD Trend Detection : The indicator determines whether the market is in a bullish or bearish phase by comparing the CVD to its moving average. A bullish trend is confirmed when the CVD is above its moving average and the price is closing higher.
A bearish trend occurs when the CVD is below its moving average and the price is closing lower. This trend detection is critical for determining whether the trailing stop should be placed below the price (bullish) or above it (bearish).
🟣 Volume Dynamics
Volume is a key factor in identifying market strength. The Trailing Stop Loss Smart indicator pulls volume data based on the market selected (Forex, Crypto, or Stock) and adjusts the trailing stop based on whether the market is experiencing high volume or low volume.
High Volume : When the current volume exceeds the average volume, the market is in a high-volume state. During these conditions, the trailing stop is placed closer to the price, as high volume often indicates strong trends with less chance of reversals.
Low Volume : In low-volume conditions, the trailing stop gives the market more room to breathe by placing the stop further away from the price. This prevents premature stop-outs in periods of reduced market activity.
🟣 ATR-Based Trailing Stop
The Average True Range (ATR) is used to measure market volatility. The Trailing Stop Loss Smart uses the ATR to dynamically adjust the stop-loss distance.
Bullish Market : When a bullish trend is detected, the trailing stop is placed below the lowest price of the recent bars (determined by the Bar Back parameter), and adjusted by the ATR Multiplier. This allows for tighter protection during strong bullish trends.
Bearish Market : When the market is bearish, the trailing stop is placed above the highest price of recent bars, also adjusted by the ATR Multiplier. This ensures that short positions are safeguarded against sudden reversals.
🟣 Dynamic Stop-Loss Updates
The trailing stop is updated every few bars (according to the Refiner parameter), ensuring it remains relevant to the most recent price action and volume changes. This dynamic feature ensures the stop-loss adapts to both trending and volatile market conditions, without requiring manual intervention.
High Volume with Trends : In periods of high volume and a confirmed trend, the stop-loss is positioned tightly to lock in profits while minimizing the risk of reversal.
Low Volume with Trends : In low-volume conditions, the stop-loss is placed further from the price, allowing the market to move freely without triggering premature exits.
🟣 Visual Representation
The indicator visually represents the trailing stop on the chart, with green lines indicating bullish trends and red lines for bearish trends. This visual aid helps traders quickly assess the state of the market and the position of their trailing stop in real-time.
🔵 Settings
The Trailing Stop Loss Smart indicator offers several customizable settings to suit various trading strategies. Understanding these inputs is key to optimizing the tool for your specific trading style.
🟣 General Settings
Cumulative Mode : This controls how the CVD is calculated.
You can choose between :
EMA : Exponential Moving Average smoothing.
Periodic : Sums the delta over a fixed period.
CVD Period : Defines the look-back period for CVD calculation. A longer period smooths the data, making it less sensitive to short-term fluctuations.
Ultra Data : This Boolean input aggregates volume across multiple exchanges for a more comprehensive view of market activity.
Market Ultra Data : Select between Forex, Crypto, and Stock to ensure the indicator pulls accurate volume data for your market.
🟣 Logical Settings
Moving Average CVD Period : Defines the period for the moving average of the CVD. A longer period smooths the trend, reducing noise.
Moving Average Volume Period : Sets the period for the moving average used to distinguish between high and low volume conditions.
Level Finder Bar Back : Determines how many bars to look back when identifying the highest or lowest price for trailing stop placement.
Levels update per candles : Sets how often (in bars) the trailing stop should be updated to remain in sync with market movements.
ATR On : Toggles the use of ATR to adjust the trailing stop based on volatility.
ATR Multiplie r: Defines how far the stop is placed from the price based on the ATR. A larger multiplier increases the stop distance, reducing the likelihood of getting stopped out during market fluctuations.
ATR Multiplier Adjusts the distance of the trailing stop based on the ATR. A higher multiplier places the stop further from the price, providing more breathing room in volatile markets.
🔵 Conclusion
The Trailing Stop Loss Smart indicator is a comprehensive tool for traders looking to manage risk while identifying market trends. By incorporating Cumulative Volume Delta (CVD) to detect buying and selling pressure, volume dynamics to gauge market activity, and ATR to adjust for volatility, this indicator ensures that stop-loss levels are both adaptive and protective.
Whether you’re trading in Forex, Crypto, or Stock markets, the Trailing Stop Loss Smart allows you to capitalize on trends while dynamically adjusting to changing market conditions. Its ability to distinguish between high-volume and low-volume periods ensures that you’re not stopped out prematurely during periods of consolidation or market hesitation.
By providing real-time visual feedback, dynamic adjustments, and trend identification, this indicator serves as a vital tool for traders aiming to maximize profits while minimizing risk. Its versatility and adaptability make it an essential part of any trader’s toolkit, helping you stay ahead in fast-moving markets while safeguarding your positions.

Price-Volume w Trendline - Strategy [presentTrading]█ Introduction and How it is Different
The Price-Volume with Trendline Strategy is an innovative strategy that combines volume profile analysis, price-based Z-scores, and dynamic trendline filtering to identify optimal entry and exit points in the market. What sets this strategy apart is the integration of volume concentration (Point of Control or PoC) with dynamic volatility thresholds. Additionally, this strategy introduces a multi-step take profit (TP) mechanism that adjusts based on predefined levels, allowing traders to exit trades progressively while capitalizing on market momentum.
BTCUSD 6hr LS Performance
█ Strategy, How it Works: Detailed Explanation
The combination of multiple indicators and methodologies serves to create a more robust and reliable trading system. Each element is carefully chosen for its complementary role in providing accurate signals while minimizing false entries and exits. Here’s why the different components were chosen and how they work together:
- PoC and Z-Scores: The volume profile identifies key price areas, while the Z-score measures deviations from the mean. Together, they highlight points where the market is likely to react. For example, when the Z-score indicates an oversold condition near a PoC support level, it increases the probability of a reversal, providing a clear entry signal.
- Trendlines and Z-Scores: Trendlines serve as a secondary filter to ensure that price deviations identified by Z-scores align with broader market trends. This ensures that trades are only entered when the price has both deviated from its average and broken through a significant trendline level, reducing the likelihood of false signals.
- Multi-Step TP and Risk Management: Finally, the multi-step take profit logic works in tandem with the entry signals generated by the PoC, Z-scores, and trendlines. As the price moves in favor of the trade, profits are gradually locked in, ensuring the trader captures gains while still leaving room for further upside.
🔶 Point of Control (PoC) and Volume Profile Analysis
The PoC identifies the price level with the highest volume concentration within a specified lookback period. This price level represents where the most trading activity has occurred, often acting as a strong support or resistance. By breaking down the range into several rows (bins), the strategy identifies how much volume was traded at each price level.
🔶 Z-Score Calculation
The Z-score is a statistical metric that measures how far the current price is from its mean, expressed in terms of standard deviations. This is calculated both for price deviation and PoC-based deviation.
🔶 Trendline Breakout Filtering
The trendline filtering is a crucial aspect that refines entry signals by confirming trend continuation or reversals. It calculates trendlines based on pivot highs and lows using the selected method (e.g., ATR or standard deviation).
🔶 Multi-Step Take Profit
The multi-step take profit mechanism allows the strategy to take partial profits at several predefined levels. For example, when the price reaches 3%, 8%, 14%, or 21% above (or below) the entry price, it exits portions of the position. This is a useful technique for locking in profits as the market moves favorably.
Local
█ Usage
The Price-Volume with Trendline Strategy can be applied to various asset classes, including stocks, cryptocurrencies, and commodities. It is particularly effective in volatile markets where price deviations and volume concentrations signal potential reversals or trend continuations. By adjusting the settings for volatility and the lookback period, this strategy can be tailored to both short-term intraday trades and longer-term swing trades.
█ Default Settings
The default settings in the strategy play a vital role in shaping its performance.
- POC_lookbackLength (144): This defines the number of bars used to calculate the PoC. A longer lookback captures more data, leading to a more stable PoC, but may result in delayed signals. A shorter lookback increases responsiveness but may introduce noise.
- priceDeviationLength (200): This determines the period for calculating the standard deviation of price. A higher length smooths out the volatility, reducing the likelihood of false signals. Shorter lengths make the strategy more sensitive to sudden price movements.
- TL_length (14): Controls the swing detection period for trendline calculation. A shorter length will generate more frequent trendline breakouts, while a longer length captures only significant moves.
- Stop Loss and Take Profit: The strategy offers both fixed and SuperTrend-based stop losses. SuperTrend is adaptive to volatility, while fixed stop losses provide simpler risk control. The multi-step take profit ensures that profits are secured progressively, which can improve performance in trending markets by reducing the risk of full reversals.
Each of these settings can significantly affect the strategy’s risk-reward balance. For instance, increasing the stop loss level or the take profit percentages allows the strategy to stay in trades longer, potentially increasing profit per trade but at the cost of larger drawdowns. Conversely, tighter stops and smaller profit targets result in more frequent trades with lower average profit per trade.

Uptrick: Adaptive Trend Strength Index (ATSI)### **Adaptive Trend Strength Index (ATSI): Trend Detection Tool**
---
### Introduction
The **Adaptive Trend Strength Index (ATSI)** is a state-of-the-art indicator designed to offer traders an unparalleled view into market trends. By combining the principles of adaptive trend analysis with advanced volatility filtering, ATSI provides a powerful and visually intuitive method for identifying and following market trends. Its unique algorithm and customizable features make it an essential tool for traders across all markets—whether you're trading stocks, forex, commodities, or cryptocurrencies.
### The Purpose and Design Philosophy
At its core, the ATSI was built with the understanding that financial markets are dynamic, ever-changing entities influenced by a multitude of factors, including market sentiment, economic data, geopolitical events, and, critically, volatility. Traditional trend indicators often fall short by either over-smoothing price data (thus lagging behind the actual trend) or reacting too quickly to minor price fluctuations, resulting in false signals.
**ATSI solves this dilemma by adapting to market conditions in real-time.** It effectively filters out market noise while being sensitive enough to detect meaningful shifts in trend direction. The result is a trend line that is both responsive and smooth, providing traders with a clear, actionable view of the market's current trajectory.
### Key Features and Functionality
#### 1. **Adaptive Trend Calculation**
The heart of ATSI is its adaptive trend algorithm, which adjusts based on market conditions. It leverages a combination of price action analysis and volatility filtering to determine the strength and direction of the trend. Here’s how it works:
- **Volatility Sensitivity:** ATSI incorporates the Average True Range (ATR) to measure market volatility. This volatility measure is then adjusted by a user-defined sensitivity factor. This ensures that the indicator responds dynamically to different market environments—be it high-volatility breakouts or low-volatility consolidations.
- **Adaptive Smoothing:** The trend calculation is further enhanced by an exponential moving average (EMA) applied not just to the raw price data, but also to the resulting trend line itself. This dual-layer smoothing process helps to eliminate noise, resulting in a cleaner and more reliable trend line.
- **Real-Time Adaptation:** Unlike rigid indicators that require constant tweaking to stay relevant in changing market conditions, ATSI adapts in real-time. This adaptability makes it particularly valuable in fast-moving markets where conditions can change rapidly.
#### 2. **Visual Clarity**
In trading, visual clarity can make the difference between spotting a lucrative trend and missing out. ATSI excels in this regard by offering a clear, color-coded trend line that provides instant feedback on market conditions:
- **Thicker and Smoother Line:** ATSI’s trend line is designed to be visually prominent. By default, it is thicker than most standard indicators, making it easy to spot even in dense charts. Additionally, the smoothing applied to the line ensures that it flows smoothly, avoiding the jagged, noisy appearance that can plague other indicators.
- **Color-Coded Trends:** The trend line changes color based on the direction and strength of the trend:
- **Green Line**: Indicates a bullish trend, suggesting upward momentum in the market.
- **Red Line**: Indicates a bearish trend, signaling downward momentum.
- **Gold Line**: Represents a neutral or weak trend, where the market is consolidating or where there is no clear direction.
This color-coding is not just for aesthetics—it’s a critical feature that allows traders to quickly assess market conditions at a glance.
#### 3. **Customizable Parameters**
ATSI is built with the understanding that every trader’s strategy is unique. Whether you’re a day trader looking for short-term trends or a swing trader interested in catching longer moves, ATSI can be tailored to fit your needs:
- **Trend Length:** The length parameter controls how much historical data is considered in the trend calculation. A shorter length will make the indicator more sensitive to recent price changes, while a longer length will smooth out short-term fluctuations, focusing on the broader trend.
- **Smoothing Factor:** This parameter controls the level of smoothing applied to the trend line. A higher smoothing factor will result in a smoother, more stable trend line, while a lower factor will make the line more responsive to quick changes in price.
- **Volatility Sensitivity:** By adjusting the volatility sensitivity, you can control how reactive the indicator is to market volatility. A higher sensitivity makes the indicator more likely to detect trends in volatile markets, while a lower sensitivity helps to filter out noise in calmer markets.
- **Line Width:** ATSI allows you to adjust the thickness of the trend line, ensuring that it stands out on your chart. This is particularly useful when trading on charts with a lot of overlays or when you need a clear, bold line to guide your trading decisions.
- **Color Customization:** The colors for bullish, bearish, and neutral trends can be fully customized to match your personal preferences or to integrate seamlessly with your existing chart setup.
### Practical Applications
ATSI is a versatile indicator that can be applied to a wide range of trading strategies. Here’s how it can enhance your trading:
#### 1. **Trend Following**
For traders who thrive on catching and riding trends, ATSI is a game-changer. Its adaptive nature ensures that you stay in the trend for as long as possible without being shaken out by minor fluctuations. The clear color-coded line makes it easy to identify when a trend starts and ends, providing clear entry and exit signals.
#### 2. **Risk Management**
One of the biggest challenges in trading is managing risk, particularly in volatile markets. ATSI’s volatility sensitivity feature helps traders adjust their strategies based on current market conditions. For example, in a high-volatility environment, the indicator will become more sensitive, allowing you to tighten your stop losses or take profits earlier. Conversely, in a low-volatility market, the indicator will smooth out minor fluctuations, reducing the risk of being stopped out prematurely.
#### 3. **Trend Reversals and Consolidations**
ATSI is also highly effective in identifying trend reversals and periods of consolidation. The neutral (gold) line indicates periods where the market is undecided, which can often precede significant moves. Recognizing these periods can help you avoid getting caught in choppy markets and position yourself for the next big move.
#### 4. **Market Timing**
Timing the market is often seen as the holy grail of trading. While no indicator can predict the future with 100% accuracy, ATSI’s real-time adaptation gives you a significant edge. By responding to changes in market conditions as they happen, ATSI helps you make timely decisions, whether you’re entering a trade, exiting a position, or adjusting your risk parameters.
### Comparative Advantage
What sets ATSI apart from other trend indicators is its combination of adaptability, visual clarity, and ease of use:
- **Adaptability:** Most trend indicators are static—they apply the same calculations regardless of market conditions. ATSI, however, adapts to the market in real-time, ensuring that it remains relevant and reliable across different market environments.
- **Visual Clarity:** The thicker, smoother, color-coded line is not just aesthetically pleasing—it’s a functional design choice that helps you quickly interpret market conditions. Whether you’re glancing at your chart or conducting an in-depth analysis, the ATSI line stands out, providing immediate insight.
- **Ease of Use:** Despite its advanced features, ATSI is incredibly easy to use. The default settings are optimized for general use, but the indicator offers a high degree of customization for those who want to tailor it to their specific trading strategy.
### Conclusion
The **Adaptive Trend Strength Index (ATSI)** is more than just another trend indicator—it’s a comprehensive tool designed to give traders an edge in today’s fast-paced, volatile markets. By combining adaptive trend analysis with advanced volatility filtering, ATSI offers a unique blend of responsiveness and reliability. Its clear, color-coded visual representation of trends makes it easy to use, even for traders who are new to technical analysis, while its customizable parameters provide the flexibility that experienced traders demand.
Whether you’re looking to ride the next big trend, manage your risk more effectively, or simply get a clearer picture of the market’s current direction, ATSI is an invaluable addition to your trading toolkit. With its cutting-edge design and powerful functionality, ATSI is poised to become the go-to indicator for traders seeking to enhance their market analysis and improve their trading outcomes.

Trendlines (long)Hi all!
I hope that this indicator helps you to be a more efficient trader. The concept is well known and useful. So this is not some magic algorithm founded by me, but rather a well known concept. The concept is the drawing of trendlines.
It draws trendlines that has a retest. It draws the trendlines in different colors, the colors used are blue, red, fuchsia and lime.
These are the steps for finding a trendline:
1. Find a generic retest
Find a low that has 2 earlier lows and 1 later low that are higher. This is the reason that a trendline will be created "1 bar late". This is the base and the indicator goes on from here, meaning that this needs to be true to continue.
2. Find an uptrend
Look back 8 bars to find a low that is lower than the retest low.
3. Create the first point of a trendline
Go thru every bar between the user defined "Lookback" and the retest bar (minus the user defined "Skip gap" that's needed between points to create a trendline). From the earliest bar to the latest.
4. Create the second point of the trendline
Go thru every bar between the retest bar and the the first point (bar) minus the "Skip gap". From latest bar to the earliest. A trendline between the two bars are invalidated if some of the criteria are met in-between the bars creating the trendline:
- closed above the trendline (trendline broken)
- is not within the retest bar
- the slope of the trendline is upwards (this indicator is for long entries only)
- at least 1 of the bars creating the retest (1 main bar and 2 earlier bars) has NOT been above the trendline
- is not the created trendline (between the two points) that's closest to the low of the retest bar
TODO:
- add functionality to draw trendlines directly on breakouts
- add volume (high volume needed to create a trendline from a breakout/retest)
- ...?
I hope this explanation makes sense, let me know otherwise. Also let me know if you have any suggestions on improvements.
Best of luck trading!

Trendline Cross CountThe Trendline Cross Count indicator is an innovative technical analysis tool that revolutionizes the way traders interact with trendlines. This cutting-edge indicator doesn't just identify trendlines - it quantifies their impact on price action in real-time, providing traders with unprecedented insight into market structure.
Core Functionality:
Trendline Cross Quantification:
At the heart of this indicator is its ability to display the actual number of trendlines being crossed by the current price. The algorithm doesn't just count intersections; it evaluates the significance of each trendline, weighing factors such as trendline duration, number of touch points, and historical reliability.
Dynamic Trendline Generation:
The indicator employs an advanced pivot-based trendline detection system. It continuously scans the chart for significant pivot points and constructs trendlines based on these pivots. The innovation lies in its ability to adapt to changing market conditions, constantly updating its trendline library.
Confluence Analysis:
By tracking multiple trendlines simultaneously, the indicator provides a real-time measure of trendline confluence. This allows traders to identify areas where multiple significant trendlines converge, potentially signaling powerful support or resistance levels.
Key Inputs and Their Significance:
Trendline Source:
This input allows traders to select the price data used for trendline analysis. While the default is the closing price, the flexibility to choose other price points enables traders to tailor the analysis to their specific trading style or market preferences.
Pivot Size:
This crucial parameter defines the lookback period for identifying pivot points. The default value of 3 strikes a balance between sensitivity and reliability, but adjusting this value can dramatically alter the indicator's behavior. Lower values increase sensitivity but may introduce noise, while higher values provide more stable, long-term trendlines.
Pivot Sequence:
This innovative feature allows traders to focus on specific market structures. Options include:
"LL" (Lower Lows): Focuses on downtrends
"HH" (Higher Highs): Emphasizes uptrends
"Any": Provides a comprehensive view of all trendlines
What Makes It Unique:
The Trendline Cross Count indicator stands out due to several groundbreaking features:
Quantitative Trendline Analysis:
While most indicators simply draw trendlines, this tool quantifies their impact, providing a numerical representation of market structure complexity.
Adaptive Pivot Detection:
The indicator's ability to dynamically adjust its pivot detection based on market volatility ensures relevance across all market conditions.
Sequence-Based Filtering:
The unique pivot sequence option allows traders to focus on specific trend types, a feature not found in conventional trendline tools.
Real-Time Confluence Measurement:
By providing a live count of intersecting trendlines, traders gain instant insight into potential support and resistance strength.
Significance Algorithm:
Not all trendlines are created equal. This indicator employs an algorithm to weigh the importance of each trendline, ensuring that the cross count reflects truly significant levels.
This indicator represents a significant advancement in trendline analysis, offering insights that are not readily available through traditional methods. Its ability to quantify trendline interactions in real-time provides traders with a unique edge in understanding market structure and potential price movements. The Trendline Cross Count indicator is not just a tool, but a gateway to a new dimension of technical analysis.

Trend Strength Signals [AlgoAlpha]🌟Introducing the Trend and Strength Signals indicator by AlgoAlpha ! This tool is designed to help you identify trends and gauge market strength with precision and ease. 📈🚀
🛠 Customizable Parameters : Adjust the period, standard deviation multiplier, gauge size, and colors to fit your trading style.
📊 Trend Detection : Visualize trends with clear color-coded signals for uptrends and downtrends.
📈 Strength Gauge : Assess market strength with a dynamic gauge that adapts to the current price action.
🔔 Alerts : Set alerts for bullish and bearish trend crossovers and take profit points to stay ahead of the market.
🎨 Visual Enhancements : Enjoy a clutter-free chart with the integration of plot shapes, color fills, and gradient gauges.
🚀 Quick Guide to Using the Trend and Strength Signals Indicator
Maximize your trading with the Trend and Strength Signals indicator by following these streamlined steps! 🎯✨
🛠 Add the Indicator : Add the indicator to your favorites. Customize settings like period, standard deviation multiplier, and colors to fit your trading style.
📊 Market Analysis : Observe the color-coded candles and gauge to understand market trend direction and strength. Use the alerts for key trading signals.
🔔 Alerts : Enable notifications for trend crossovers and take profit points to catch trading opportunities without constantly monitoring the chart.
⚙️ How it works
This indicator calculates the moving average and standard deviation of the closing price over a customizable period to identify the upper and lower bounds. When the price crosses these bounds, it signals an uptrend or downtrend. The gauge measures market strength by comparing the price to the moving average and scaling it over a customizable range, while the underlying logic uses concepts from the Bollinger Bands, this indicator gives a unique perspective on price behavior through added features and signals derived from it.
Unleash the power of trend and strength analysis with this comprehensive indicator! Happy trading! 🚀📈✨
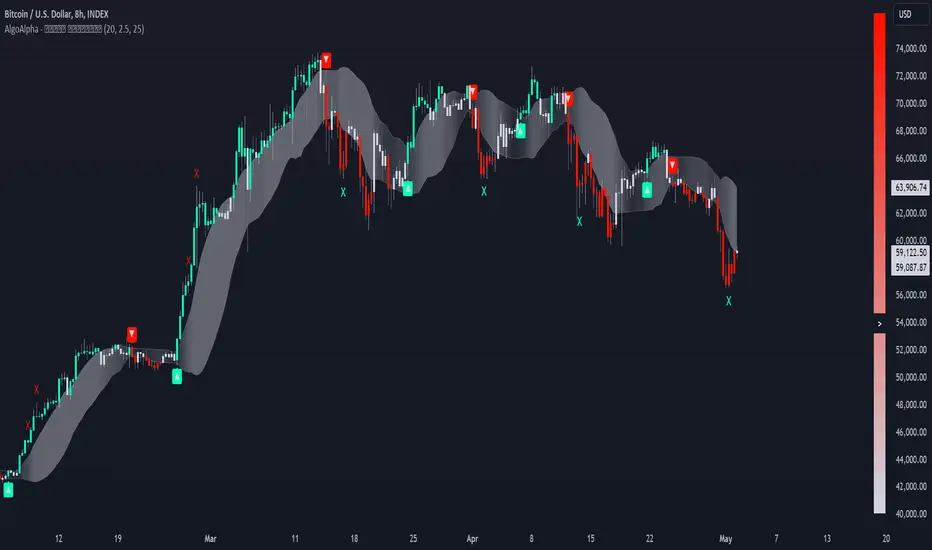
Trend Channels (MTF) | Flux Charts💎 GENERAL OVERVIEW
Introducing our new Trend Channels (MTF) indicator! Latest trends play an important role for traders and sometimes it can be hard to spot trends in other timeframes. This indicator can plot latest trend channels across different timeframes, so you can spot trends and their channels easier. More info about the process in the "How Does It Work" section.
Features of the new Trend Channels (MTF) indicator :
Plot Trend Channels Across Up To 3 Different Timeframes
Broad Customizability Of Trend Detection
Variety Of Trend Invalidation Options
High Visual Customizability
🚩UNIQUENESS
While the detection of trend channels is a common concept among traders, trend channels across different timeframes can be as crucial as the ones in the current timeframe. This indicator can find them from up to 3 different timeframes. While the general settings will perform well enough most of the time, the indicator also provides fine-tuning options for trend detection and trend invalidation for more experienced traders.
📌 HOW DOES IT WORK ?
Trend channels occur when the price of an asset starts making a strong movement in a bullish or a bearish direction. This indicator detects trend channels using the Simple Moving Average (SMA). When the slope of the SMA line exceeds the user-defined size, a trend channel will occur.
To understand how individual settings work, you can check the "⚙️SETTINGS" section.
⚙️SETTINGS
1. General Configuration
SMA Length -> Determines the length used in the SMA function. Higher values mean that an average of a longer timespan will be taken into account when spotting trends.
Slope Length -> Used while finding the slope of the trend channel. Check this example for slope length :
ATR Size -> This setting is taken into calculation while checking if a trend channel is worth plotting. The higher this setting is, the higher the slope of the trend channel must be to get rendered. You can take a look at the chart provided above for a visual explanation.
Channel Expander -> When a trend channel occurs, the top and the bottom of the channel are initally determined by the latest highest highs / lowest lows. This setting expands the channel vertically by X times Average True Range (ATR). Check this example :
Trend Invalidation -> The trend channel gets invalidated when the bar closes / wicks above the top of the channel, or below the bottom of the channel. With this setting, you can switch the behaviour between bar close / bar wick.
Avoid False Invalidation -> This setting makes it harder for trend channels to get invalidated to prevent false invalidations.
Retries : The trend channel will have 5 chances for invalidation. First 4 invalidations will not invalidate the channel. The trend channel will only invalidate once the 5th invalidation occur.
Volume : The bar that invalidates the trend channel must have a volume higher than 1.5x the average bar volume of the current chart. Otherwise the trend channel will not be invalidated.
None : The trend channel will invalidate at the first invalidation.

Trend Lines [LuxAlgo]Our new "Trend Lines" indicator detects and highlights relevant trendlines on the user chart while keeping it free of as much clutter as possible.
The indicator is thought for real-time usage and includes several filters as well as the ability to estimate trendline angles.
🔶 USAGE
Trendlines can act as support/resistance, with a higher number of tests indicating a more significant support/resistance role.
A broken TrendLine can be indicative of a potential trend reversal. The script highlights breaks with a label.
Users can additionally filter trendlines, only showing trendlines whose angles fall within a user set range:
This allows for the removal of potential clutter from the chart but also helps keep steeper or more horizontal trendlines.
🔶 DETAILS
When a swing (pivot point) is found, a Trendline is drawn when certain conditions are fulfilled.
An essential condition is that a Bearish Trendline (red) always occurs on a lower high, while a Bullish Trendline (blue) occurs on a higher low.
Our implementation will first show an initial dotted-styled TrendLine on confirmation, after which a solid-styled secondary TrendLine will develop. The latter will be used for the real-time detection of breaks at that line:
Furthermore, the script allows you to add more conditions:
🔹 Length (Swings)
A swing develops when a high/low is the highest/lowest against x highs/lows on the left AND right of that bar. x can be set by "Length" in settings.
The following images clarify this. The script confirms a swing where the yellow flag is shown; the high (here visualized with a purple label) is the highest point against x bars left and right of that point.
At that moment, this swing is checked against the previous swing. If all conditions are fulfilled, an initial TrendLine is drawn on confirmation.
After that point, a secondary thicker solid line is seen which keeps progressing bar after bar, until:
• a new TrendLine is formed
• the TrendLine is broken
🔹 Breaks between Swings
Once there is confirmation that a TrendLine can be drawn, the script allows you to filter for breakthroughs on that line. This can be set with "Check breaks between"
Disabled : the initial TrendLine is allowed to be pierced:
Check breaks between point A - point B : no breaks are allowed between both Swing points:
Point A - Current bar : no breaks are allowed between the first Swing point and the point of confirmation ('current' bar):
🔹 TrendLine breaks
As mentioned, the secondary TrendLine (solid line) progresses bar after bar until a new TrendLine is formed or the TrendLine is broken. When a TrendLine is broken, the TrendLine stops progressing, but if there isn't a new TrendLine and price return back, the TrendLine will re-appear, potentially giving several signals when the TrendLine is broken again.
Minimal bars allow you to regulate the amount of signals when the TrendLine is broken.
-> The secondary TrendLine must be uninterrupted for at least x bars before a potential break can be considered.
The following example shows 1 signal against 3 by adjusting this setting from 2 to 5:
🔹 Angles
Angles should normally be calculated when the units of the X and Y axis are the same. However, on our charts, the unit of the X-axis is bar_index (bars), and on the Y-axis the unit is price (¥, €, £, $,...).
It is not easy to normalize and create reasonably valid angles. Often certain angle calculations can differ through price changes or volatility.
Our calculate_slope() function tries to make corresponding angles through all bars.
We do this by calculating the difference between the highest/lowest price values in a certain bar range. The bar range is our X-axis, and the price difference is our Y-axis.
Zooming in/out will not change the amount of bars or the price. Since it does change our view on the chart, and thereby how we see the angles, we have included a setting where you can personalize the ratio between X and Y-axis (Angles -> Ratio X-Y axis).
Settings: Angles - Ratio X-Y axis:
🔶 SETTINGS
🔹 Swings
Length: Lookback period for the detection of swing points.
🔹 Trendline validation
Check breaks between :
Disabled : the initial TrendLine is allowed to be pierced
Check breaks between point A - point B : no breaks are allowed between both Swing points
Point A - Current bar : no breaks are allowed between the first Swing point and the point of confirmation ('current' bar)
Source (breaks) : Source which invalidates TrendLine, default: close
🔹 TrendLine breaks
Minimal bars : The secondary TrendLine must be uninterrupted for at least x bars before a potential break can be considered.
🔹 Angles
Show : Toggle labels.
Ratio X-Y axis : Every user has his preferences regarding zoom, chart layout,...
If the shown angles are not according to your expectations, you can adjust this number.
Only TrendLine between : Only allow TrendLines between the minimum and maximum degrees. Set only the minimal and maximum values above 0.

Predictive Trend and Structure (Expo)█ Overview
The Predictive Trend and Structure indicator is designed for traders seeking to identify future trend directions and interruptions in trend continuation. This indicator is unique because it employs standard deviation to predict upcoming trend directions and potential trend continuation levels. This enables traders to stay ahead of the market.
█ How It Works
This indicator primarily functions based on the calculated standard deviation of the trend over a specified period. It evaluates the trend direction by comparing the current trend value to its previous one and scales the standard deviation, allowing for adjustments in sensitivity to price fluctuations.
█ How to Use
Trend
You can easily identify when a future trend begins by observing where the trend level is displayed. If the price breaks above and remains above the trend, it indicates a bullish trend. Conversely, if the price breaks below and stays below, it signifies a bearish trend.
Support and Resistance
With the Predictive Structure enabled, the indicator aids in identifying potential support and resistance levels.
Trend Continuation Break
Trend continuation breaks occur when prices breaks support or resistance, indicating the existing trend may persist. The indicator plots these levels in advance, allowing traders to quickly identify where trend continuation might occur.
█ Settings
Period for Std Dev: Determines the number of periods used for the standard deviation calculation, impacting the indicator's sensitivity to price changes.
Standard Deviation Scaler: Scales the computed standard deviation, affecting the deviations needed to confirm trends and the indicator's focus on significant trend changes.
Predictive Structure: Enables or disables the prediction of market structures like potential levels of structure breaks/trend continuation breaks.
-----------------
Disclaimer
The information contained in my Scripts/Indicators/Ideas/Algos/Systems does not constitute financial advice or a solicitation to buy or sell any securities of any type. I will not accept liability for any loss or damage, including without limitation any loss of profit, which may arise directly or indirectly from the use of or reliance on such information.
All investments involve risk, and the past performance of a security, industry, sector, market, financial product, trading strategy, backtest, or individual's trading does not guarantee future results or returns. Investors are fully responsible for any investment decisions they make. Such decisions should be based solely on an evaluation of their financial circumstances, investment objectives, risk tolerance, and liquidity needs.
My Scripts/Indicators/Ideas/Algos/Systems are only for educational purposes!

Dynamic Trendline Break - Strategy [presentTrading]- Introduction and How It Is Different
The Dynamic Trendline Break Strategy is a unique trading algorithm that leverages the power of trendlines and swing detection to identify potential trading opportunities.
Unlike traditional trendline strategies that rely on static trendlines, this strategy dynamically calculates trendlines based on pivot highs and lows.
This dynamic approach allows the strategy to adapt to changing market conditions (especially 24hr markets like Crypto) and potentially identify trading opportunities that static trendlines might miss.
BTCUSD 6hr chart
Tencent 700.HK 1D chart
- Strategy, How It Works
The strategy works by first identifying pivot highs and lows using a lookback period defined by the user. These pivot points are then used to calculate the slope of the trendlines. The slope calculation method can be chosen from three options: Average True Range (ATR), Standard Deviation (Stdev), or Linear Regression (Linreg), providing flexibility to the trader.
Once the trendlines are calculated, the strategy identifies potential trading opportunities when the price crosses over the upper trendline (for long trades) or crosses under the lower trendline (for short trades). The strategy also allows the user to define the trade direction (Long, Short, or Both) and the stop loss method (Fixed or SuperTrend).
- Trade Direction
The trade direction parameter allows the user to define the direction of the trades that the strategy will take. If set to "Long", the strategy will only take long trades when the price crosses over the upper trendline. If set to "Short", the strategy will only take short trades when the price crosses under the lower trendline. If set to "Both", the strategy will take both long and short trades.
- Usage
To use this strategy, simply input your desired parameters for the swing detection lookback, slope, slope calculation method, trade direction, stop loss method, and stop loss level. Once these parameters are set, the strategy will automatically calculate the trendlines and identify potential trading opportunities based on the defined parameters.
- Default Settings
The default settings for the strategy are as follows:
Swing Detection Lookback: 30
Slope: 0.618
Slope Calculation Method: ATR
Trade Direction: Both
Stop Loss Method: SuperTrend
Stop Loss Level: 15%
SuperTrend Factor: 3
SuperTrend Lookback: 21
These settings can be adjusted to suit your trading style and risk tolerance. Always remember to backtest any changes to the settings before live trading.

Smart Trend EnvelopeThe "Smart Trend Envelope" indicator is a powerful tool that combines the "Nadaraya-Watson Envelope " indicator by LuxAlgo and the "Strongest Trendline" indicator by Julien_Eche.
This indicator provides valuable insights into price trends and projection confidence levels in financial markets. However, it's important to note that the indicator may repaint, meaning that the displayed results can change after the fact.
The "Strongest Trendline" indicator by Julien_Eche focuses on identifying the strongest trendlines using logarithmic transformations of price data. It calculates the slope, average, and intercept of each trendline over user-defined lengths. The indicator also provides standard deviation, Pearson's R correlation coefficient, and upper/lower deviation values to assess the strength and reliability of the trendlines.
In addition, the "Nadaraya-Watson Envelope " indicator developed by LuxAlgo utilizes the Nadaraya-Watson kernel regression technique. It applies a kernel function to smooth the price data and estimate future price movements. The indicator allows adjustment of the bandwidth parameter and multiplier to control the width of the envelope lines around the smoothed line.
Combining these two indicators, the "Smart Trend Envelope" indicator offers traders and investors a comprehensive analysis of price trends and projection confidence levels. It automatically selects the strongest trendline length based on the highest Pearson's R correlation coefficient. Traders can observe the trendlines on the price chart, along with upper and lower envelope lines generated by the Nadaraya-Watson smoothing technique.
The "Smart Trend Envelope" indicator has several qualities that make it a valuable tool for technical analysis:
1. Automatic Length Selection: The indicator dynamically selects the optimal trendline length based on the highest Pearson's R correlation coefficient, ensuring accurate trend analysis.
2. Projection Confidence Level: The indicator provides a projection confidence level ranging from "Ultra Weak" to "Ultra Strong." This allows traders to assess the reliability of the projected trend and make informed trading decisions.
3. Color-Coded Visualization: The indicator uses color schemes, such as teal and red, to highlight the direction of the trend and the corresponding envelope lines. This visual representation makes it easier to interpret the market trends at a glance.
4. Customizable Settings: Traders can adjust parameters such as bandwidth, multiplier, line color, and line width to tailor the indicator to their specific trading strategies and preferences.
The "Smart Trend Envelope" indicator has been specifically designed and coded to be used in logarithmic scale. It takes advantage of the logarithmic scale's ability to represent exponential price movements accurately. Therefore, it is highly recommended to use this indicator with the chart set to logarithmic scale for optimal performance and reliable trend analysis, especially on higher timeframes.
It's important to remember that the "Smart Trend Envelope" indicator may repaint, meaning that the displayed results can change after the fact. Traders should use this indicator as a tool for generating trade ideas and confirmation, rather than relying solely on its historical values. Combining the indicator with other technical analysis tools and considering fundamental factors can lead to more robust trading strategies.

Trend & Pullback Toolkit (Expo)█ Overview
The Trend & Pullback Trading Toolkit is an all-encompassing suite of tools designed for serious traders who want a comprehensive trend approach. It empowers traders to align their strategies with prevailing market trends, thereby mitigating risk while maximizing profit potential.
The Toolkit helps traders spot, analyze, and react to market trends, pullbacks, and significant trends. It combines multiple trading methodologies, such as the Elliott Wave theory, cyclical analysis, retracement analysis, strength analysis, volatility analysis, and pivot analysis, to provide a thorough understanding of the market. All these tools can help traders detect trends, pullbacks, and major shifts in the overall trend. By integrating different methodologies, this toolkit offers a multifaceted approach to analyzing market trends.
In essence, the Trend & Pullback Toolkit is the complete package for traders seeking to detect, evaluate, and act upon market trends and pullbacks while being prepared for major trend shifts.
The Trend & Pullback Toolkit works in any market and timeframe for discretionary analysis and includes many oscillators and features, but first, let us define what a cycle is:
█ What is a cycle
This involves the analysis of recurring patterns or events in the market that repeat over a specific period. Cycles can exist in various time frames and can be identified and analyzed with various tools, including some types of oscillators or time-based analysis methods.
Traders must also be aware that cycles do not always repeat perfectly and can often shift, evolve, or disappear entirely.
█ Features & How They Work
Elliott Wave Cycles: This is a method of technical analysis that traders use to analyze financial market cycles and forecast market trends. Elliott Wave theory asserts that markets move in repetitive cycles, which traders can analyze to predict future price movement. The core principle behind the theory is that market prices alternate between an impulsive, or driving phase, and a corrective phase on all time scales of trend. This pattern forms a fractal, meaning it's a self-similar pattern that repeats regardless of the degree or size of the waves.
The Elliott Wave Cycle Feature uses the principle of the Elliott Wave to identify trends and pullbacks in real-time.
Ratio Wave Cycle: This method elaborates on the concept of how negative volatility, or the degree of variation in the negative returns of a financial instrument, influences the effectiveness of a relative price move. Essentially, it delves into the relationship between the negative fluctuations in the market and the resulting relative price change, exploring how the two aspects interact with each other.
The central concept is that trends are generally more stable and predictable than rapid retracements. Therefore, the indicator calculates the relationship between these two market movements. By doing so, it establishes a trend-based identification system. This system aids in forecasting future market movements, allowing traders to make informed decisions based on these predictions. Essentially, it uses the calculated relationship to discern the overall direction (trend) of the market despite temporary counter-movements (retracements), thereby providing a more robust trading signal.
Periodic Wave Cycle: Thi refers to patterns or events in price action that recur over a specific time period. Periodic cycles can range from short-term intraday cycles (like the tendency for stock market volatility to be high at the opening and close of trading) to long-term cycles trend cycles. Traders use this to predict future price movements and trends.
By identifying the phases of a cycle, traders can predict key turning points in the market.
Retracement Cycles: Retracements are temporary price reversals that occur within a larger trend. These retracements are a common occurrence in all markets and timeframes, representing a pause or counter-move within a larger prevailing trend. Retracements can be driven by a variety of factors, including profit-taking, market uncertainty, or a change in market fundamentals. Despite these periodic reversals, the overall trend (upwards or downwards) often continues after the retracement is complete.
Fibonacci retracement functions are primarily used to identify potential retracement levels.
Volatility Cycle: A volatility cycle refers to the periodic changes in the degree of dispersion or variability of a security's returns, expressed as a standard deviation or variance. This feature uses both measures.
Strength Cycle: Gauges the power of a market trend and its inherent impulses. This feature offers a broad perspective on the cyclical nature of markets, which alternate between periods of strength, often referred to as bull markets, and periods of weakness, known as bear markets. It effectively tracks the direction, intensity, and cyclic patterns of market behavior.
Let us define the difference between strength and impulse:
Strength: This refers to the power or force behind a price move. In trading, this refers to the momentum or volume supporting a price move.
Impulse: In the context of trading, an impulse usually refers to a strong move in price. Impulse moves are typically followed by corrective moves against the trend.
Pivot Cycles: Pivot cycles refer to the observation of recurring price patterns or turning points in the market. Pivots can be defined as significant highs or lows that act as potential reversal or support/resistance points. Pivot point analysis helps traders understand the prevailing market sentiment. Overall, pivot cycles provide traders with a framework to identify potential market turning points and price levels of interest.
█ How to use the Trend & Pullback Toolkit
Elliott Wave Cycles
Ratio Wave Cycle
Periodic Wave Cycle
Retracement Cycles
Volatility Cycle:
Strength Cycle
Pivot Cycles
█ Why is this Trend & Pullback Toolkit Needed?
The core philosophy of this toolkit revolves around the popular adage in trading circles: "The trend is your friend." This toolkit ensures that you are always in sync with the trend, thereby increasing the chances of successful trades.
Here's an overview of the key benefits:
Trend Identification: The toolkit includes sophisticated algorithms and indicators that help identify the prevailing trend in the market. These algorithms analyze price patterns, momentum, volume, and other factors to determine the direction and strength of the trend.
Risk Reduction: By enabling traders to trade with the trend, this toolkit reduces the risk of betting against market momentum.
Profit Maximization: Trading with the trend increases the likelihood of successful trades.
Advanced Analysis Tools: The toolkit includes tools that provide a deeper insight into market dynamics. These tools enable a multi-dimensional analysis of market trends, from Elliott Wave cycles and period cycles to retracement cycles, ratio wave cycles, pivot cycles, and strength cycles.
User-friendly Interface: Despite its sophistication, the toolkit is designed with user-friendliness in mind. It allows for customization and presents data in easy-to-understand formats.
Versatility: The toolkit is versatile and can be used across different markets - stocks, forex, commodities, and cryptocurrencies. This makes it a valuable resource for all types of traders.
█ Any Alert Function Call
This function allows traders to combine any feature and create customized alerts. These alerts can be set for various conditions and customized according to the trader's strategy or preferences.
█ In conclusion, The Trading Toolkit is a powerful ally for any trader, offering the capabilities to navigate the complexities of the market with ease. Whether you're a novice or an experienced trader, this toolkit provides a structured and systematic approach to trading.
-----------------
Disclaimer
The information contained in my Scripts/Indicators/Ideas/Algos/Systems does not constitute financial advice or a solicitation to buy or sell any securities of any type. I will not accept liability for any loss or damage, including without limitation any loss of profit, which may arise directly or indirectly from the use of or reliance on such information.
All investments involve risk, and the past performance of a security, industry, sector, market, financial product, trading strategy, backtest, or individual's trading does not guarantee future results or returns. Investors are fully responsible for any investment decisions they make. Such decisions should be based solely on an evaluation of their financial circumstances, investment objectives, risk tolerance, and liquidity needs.
My Scripts/Indicators/Ideas/Algos/Systems are only for educational purposes!
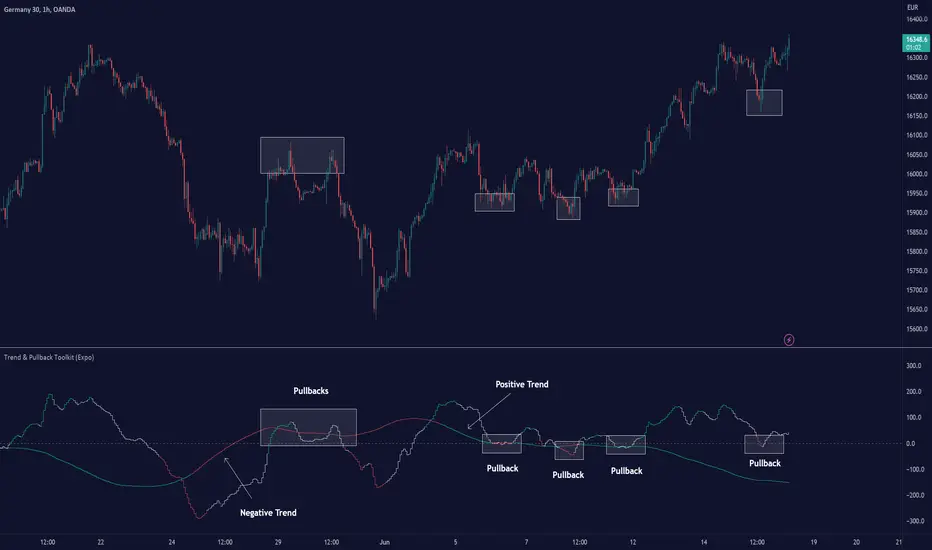
Dynamic Trendlines Multi-TimeframeThe Dynamic Trendlines indicator is a useful tool for traders to identify potential support and resistance levels in the market. By analyzing price volatility and drawing trendlines based on high volatility candles, it helps traders visualize key price levels that may influence future price action. This indicator uses the Average True Range (ATR) as a measure of price volatility to determine the threshold for high volatility candles. This indicator can be used on multiple time frames, so just choose which one works best for you!
The underlying concept of this indicator revolves around the calculation of the True Range and Average True Range. The True Range is the maximum value among the difference between the current high and low, the absolute value of the difference between the current high and previous close, and the absolute value of the difference between the current low and previous close. The ATR is then calculated as the simple moving average of the True Range over a user-defined period (default is 14). The threshold for high volatility candles is determined by multiplying the ATR by a user-defined multiplier (default is 1.5).
The indicator identifies high volatility candles when the closing price is greater than the previous closing price plus the threshold. Based on the price action, trendlines are drawn connecting the high or low of high volatility candles. The initial color and style of the trendline are determined by whether the price is moving up or down. Green solid lines represent upward price movement, while red solid lines represent downward price movement.
As the price crosses the trendlines, the indicator tracks the number of crosses and updates the line's style accordingly. If the price crosses a trendline twice, the line style is changed to dashed, indicating the potential weakening of the support or resistance level.
This indicator works best with trading methods that focus on capturing price breakouts or reversals. Traders can use the trendlines to identify potential entry or exit points, stop-loss levels, or take-profit targets. It's important to note that this indicator should be used in conjunction with other technical analysis tools and an understanding of the overall market context to make informed trading decisions.
When using the Dynamic Trendlines indicator on TradingView, users can customize the ATR length, threshold multiplier, and the number of recent trendlines displayed on the chart. Additionally, small triangles are plotted below high volatility candles, with their color based on the trendline it starts, providing a quick visual reference for traders.
In summary, the Dynamic Trendlines indicator is a valuable tool for identifying potential support and resistance levels in the market by analyzing price volatility and drawing trendlines based on high volatility candles. It is best suited for breakout and reversal trading strategies and should be used in conjunction with other technical analysis tools for optimal results.
