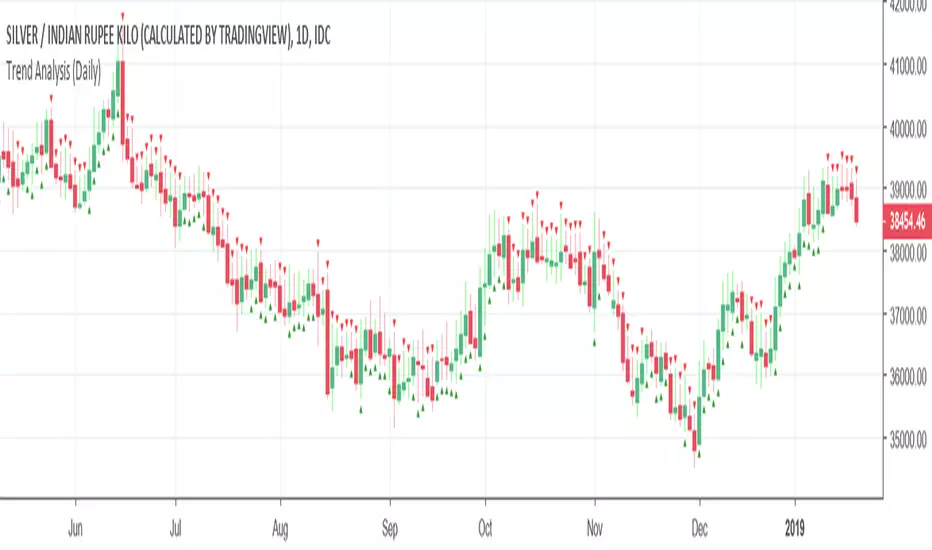
Trend Analysis (Daily)This indicator works for Daily Timeframe in gold and silver.
Users can test it in any other Pair or timeframe.
Used to determine trend from moving average which changes its calculation by the closing of previous close.
在腳本中搜尋"trend"

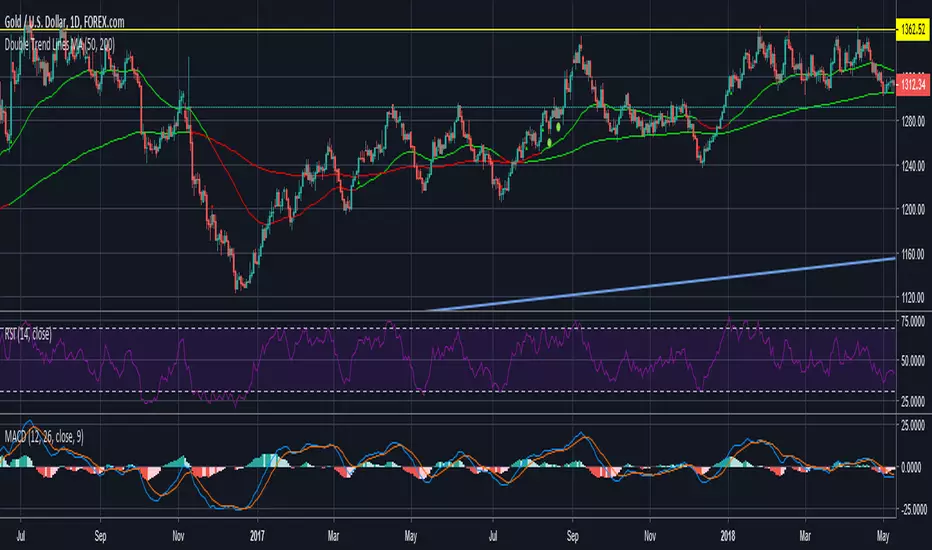
Double Trend Lines MA-ATRTrend indicator using double MA and ATR channel breakout. No repaint and a lot faster than waiting for MA cross.
Trend Follower With Help of Donchian Channels - TFWHDCThis is a simple Day Trade indicator, but can be used for swing and long term trades.
It is based on Donchian Channels to detect trend and point out resistance or support breakouts using arrows.
The bars ared colored when a breakout occurs. When a resistance breakout occurs the current and the next bars are colored green (default) and when a support breakout occurs the current and the next bars are colored red (default). This way this indicator can show if its an uptrend or a downtrend.
I hope this indicator will be useful for many traders!
Thank you!

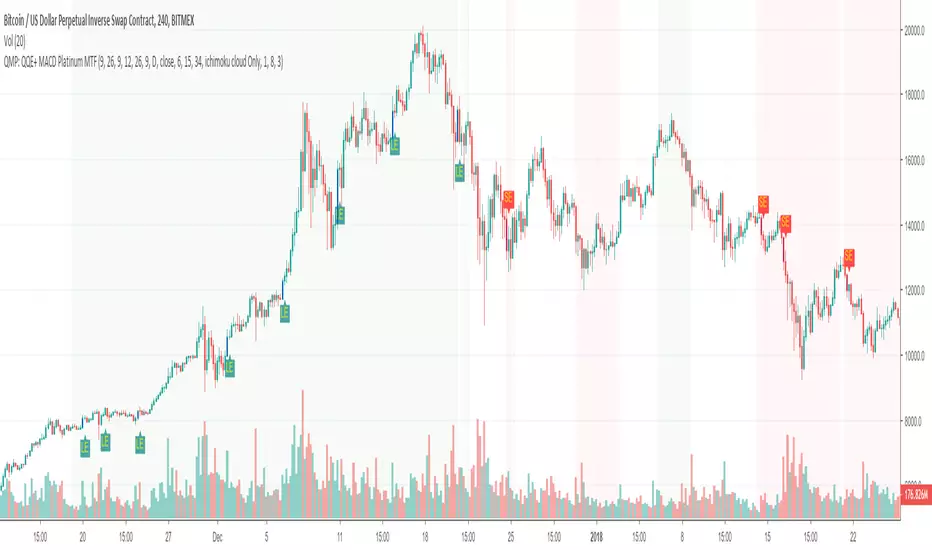
Trend following and reversal strategy for cryptoThe idea of this indicator comes from Jim Brown's book.
using the "MACD Platinum" and "QQE advanced" and multi-timeframe.
The difference to the original idea is that I use Ichimoku cloud for trend detection.
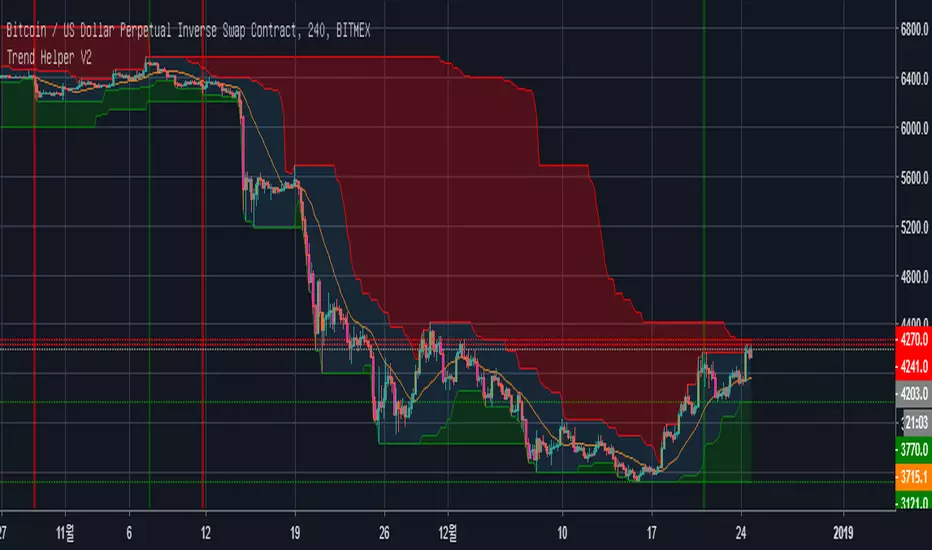
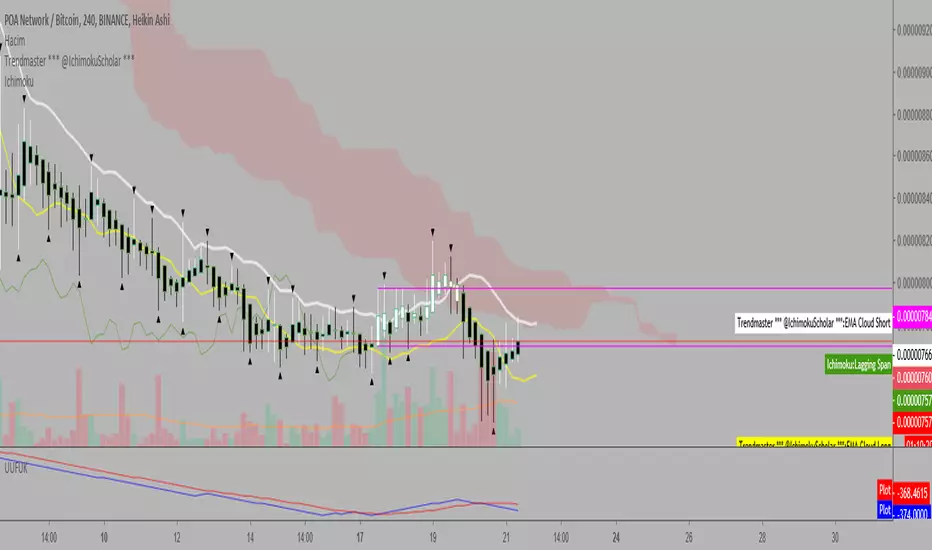
Trend Helper트레이딩의 90%는 추세입니다.
추세에 반대되는 트레이딩은 실패 확률이 매우 높으며
추세에 반대되는 물타기의 끝은 청산입니다.
Swing High/Swing Low 를 통해 만들어지는 구름입니다.
초록색 구름(양운)이 두껍다면 상승추세.
빨간색 구름(음운)이 두껍다면 하락추세.
*일목구름 아닙니다.
--------------------------------------------------------------------
Trading is all about TREND.
Trading against the trend always has high risks, and averaging down against the trend often leads to liquidation.
The script has clouds based on Swing High/Swing Low
If green cloud is thicker than red, it's uptrend.
If red cloud is thicker than green, it's downtrend.
*this is not Ichimoku Cloud.
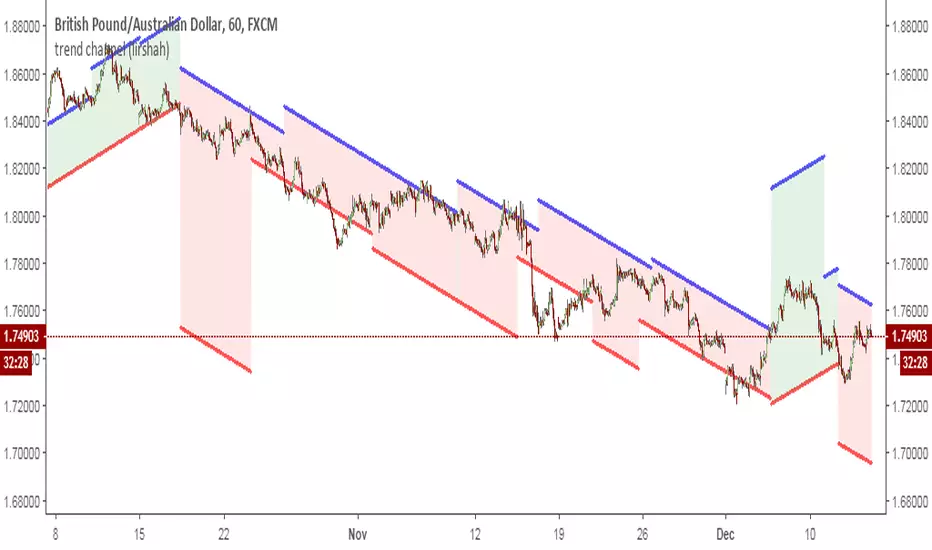
trend channel (lirshah)this indicator shows the trend lines and the channel which price fluctuate within, according to highest and lowest prices (historical data)
every line is calculated according to present bar and no repaint occurs.
trend show strategy(lirshah)this strategy has been created according to trend show(lirshah) indicator.
simplicity, sensitivity to trend change and the lowest repainting has made this strategy unique.
it has good results on almost all markets and is one of the best for manual trading.

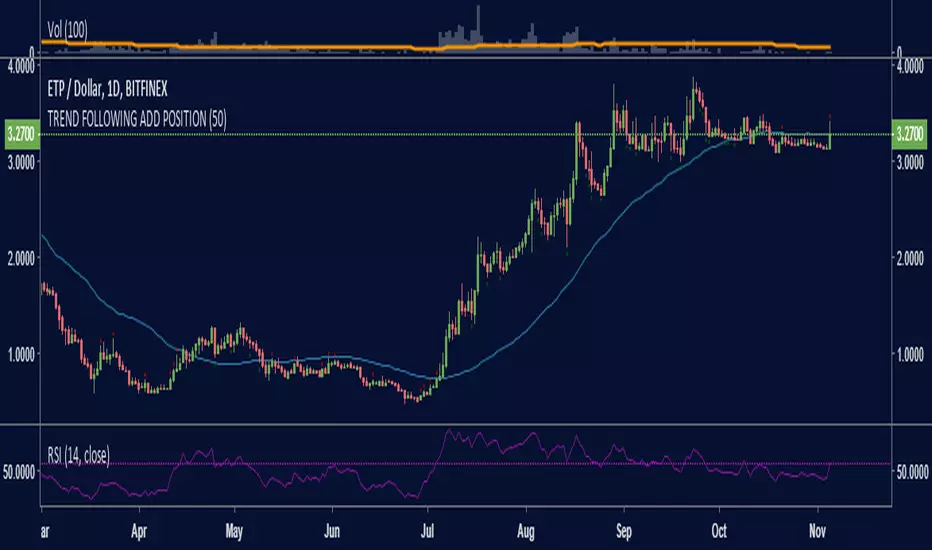
TREND FOLLOWING ADD POSITIONComplimentary to my trend following system, I am trying to easily spot the best points to add positions.
I'm using the same concept of HHHC and LLLC but when they go agains the trend withouth breaking it, in other words just a corrections with momentum which may be a good indication of oversold in and uptrend or overbought in a downtrend.
Trend Trader Bands Backtest This is plots the indicator developed by Andrew Abraham
in the Trading the Trend article of TASC September 1998
It was modified, result values wass averages.
And draw two bands above and below TT line.

Trend Trader Bands Strategy This is plots the indicator developed by Andrew Abraham
in the Trading the Trend article of TASC September 1998
It was modified, result values wass averages.
And draw two bands above and below TT line.

Trend Trader Bands This is plots the indicator developed by Andrew Abraham
in the Trading the Trend article of TASC September 1998
It was modified, result values wass averages.
And draw two bands above and below TT line.

Trend Trader AVR Backtest This is plots the indicator developed by Andrew Abraham
in the Trading the Trend article of TASC September 1998
It was modified, result values wass averages.

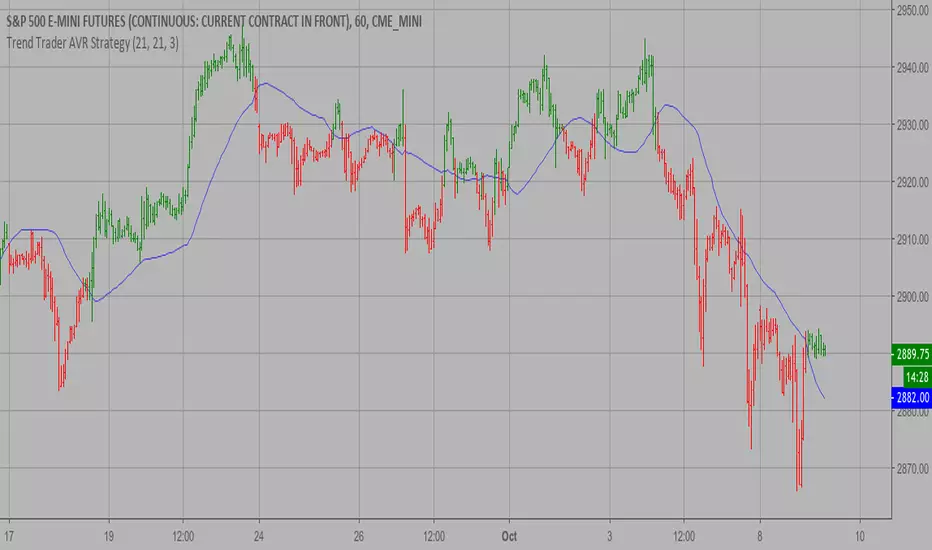
Trend Trader AVR Strategy This is plots the indicator developed by Andrew Abraham
in the Trading the Trend article of TASC September 1998
It was modified, result values wass averages.
Trend Trader AVR This is plots the indicator developed by Andrew Abraham
in the Trading the Trend article of TASC September 1998
It was modified, result values wass averages.

trend searchYou can know chart trend by this indicator. SMA theory is using for search trend.
Green back color = Uptrend start
Red back color = Downtrend start

Trend Hunter BETAThis is the Trend Hunter Alert Companion study. A trend following/breakout strategy with profit percentage targets.

Leonard-15M Trend Following SystemTrend Following System
Leonard
Build 4555525553442d31354d
Copyright Exonumia Fund

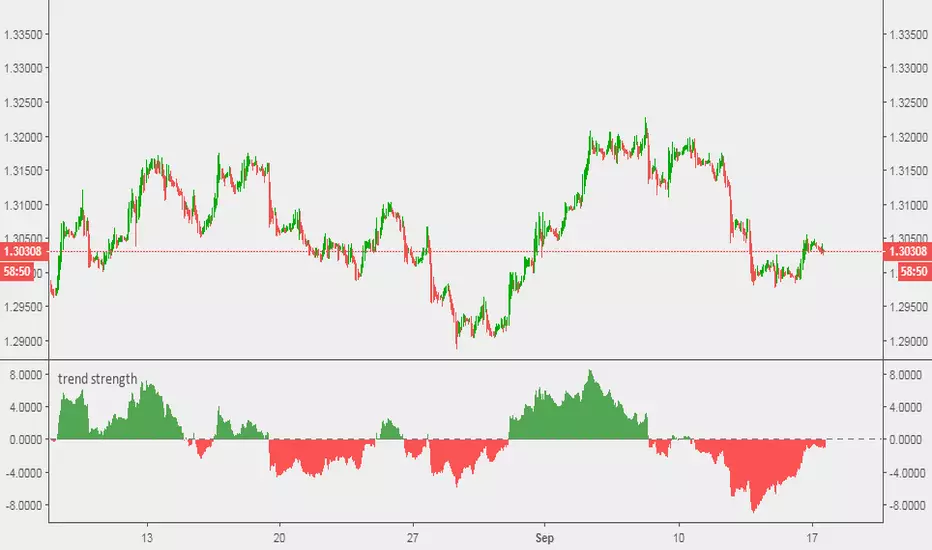
trend Strength Oscillatortrend strength is a column bar oscillators which shows power of trend according to EMA and signal period inputs
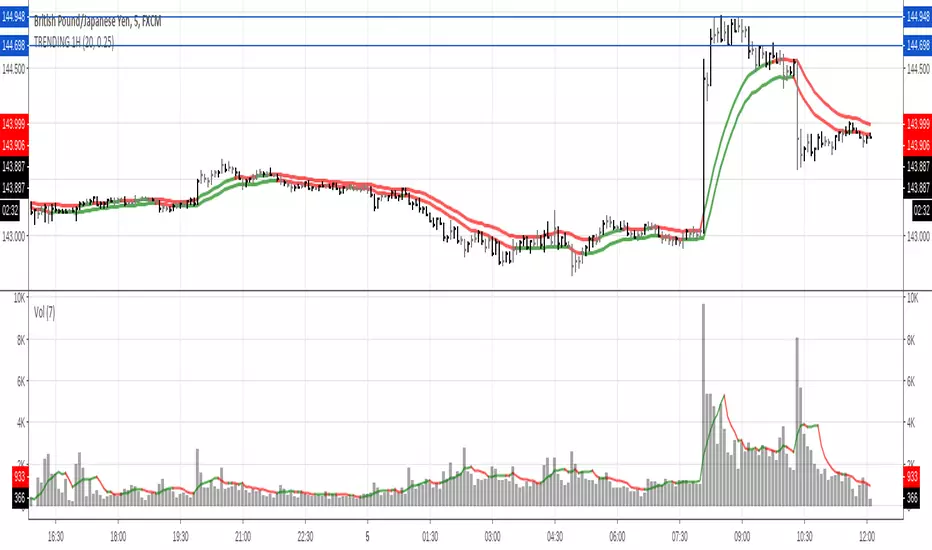
TRENDING high / low 20s EMA with GRAY Bars / Black BarsColored 20 default EMAs describing the trend
Black bars showing strength or weakness on 25% default.
Gray bars showing uncertainty
check volume to take decisions.
trend show(lir)
trend show is a powerful indicator which shows dominant trend in different time franmes

Trend Strength Indicator - "Tren"The Tren indicator is a combination of Trend Strength Indicators that I combined in an attempt to better aid position taking. It utilizes certain conditions amongst trend strength indicators and plots numbers 0-12 above (if bullish) or below (if bearish) depending on the conditions. The higher the number, the stronger the Trend Strength is. If one wanted to go long or short, but the trend strength was weak - a trader might want to reconsider their position. If a trader was currently in a position and experienced a retrace, but the trend strength was high and in their favor, a trader might use this indicator to reconsider exiting a trade - therefore maximzing profits.
This indicator is not currently for sale, and is in its beta stages. Follow me for more updates and indicators.
