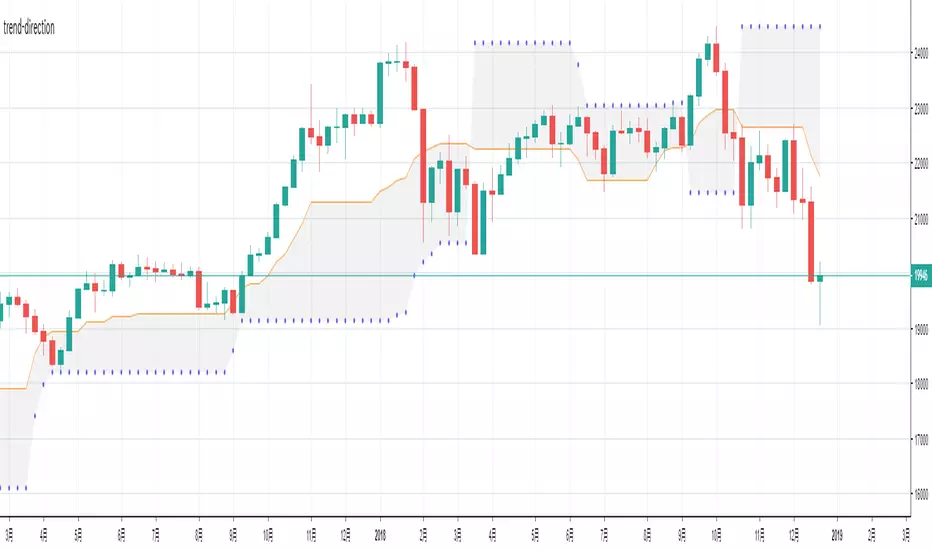
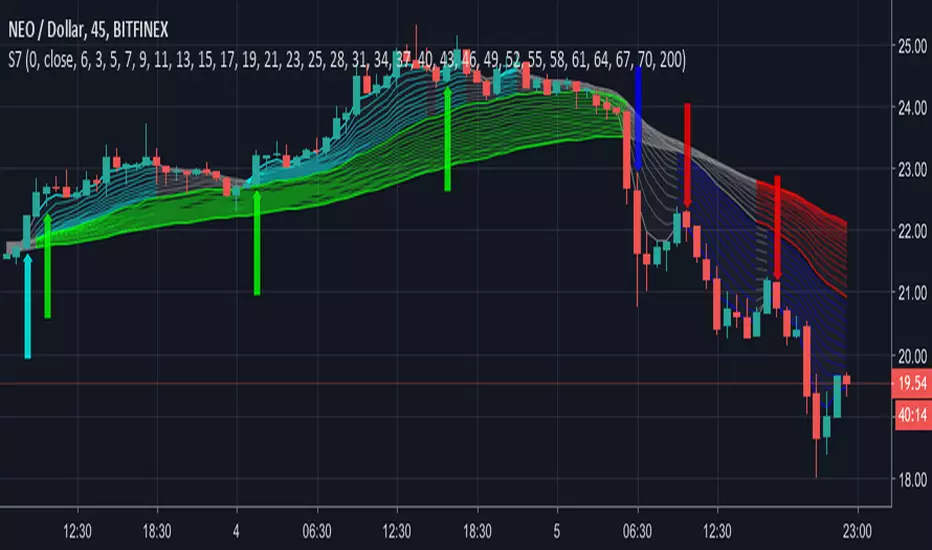
trend-directionThis is an indicator to check the range period and trend occurrence period.
When the closing price is within the "net", judgment is made as the range, and where I left the "net" it is recognized as a trend occurrence.
In addition, it is also possible to check multiple entry timing with this indicator.
This indicator can be used in any market.
在腳本中搜尋"trend"

trend-directionThis is an indicator to check the range period and trend occurrence period.
When the closing price is within the "net", judgment is made as the range, and where I left the "net" it is recognized as a trend occurrence.
In addition, it is also possible to check multiple entry timing with this indicator.
This indicator can be used in any market.
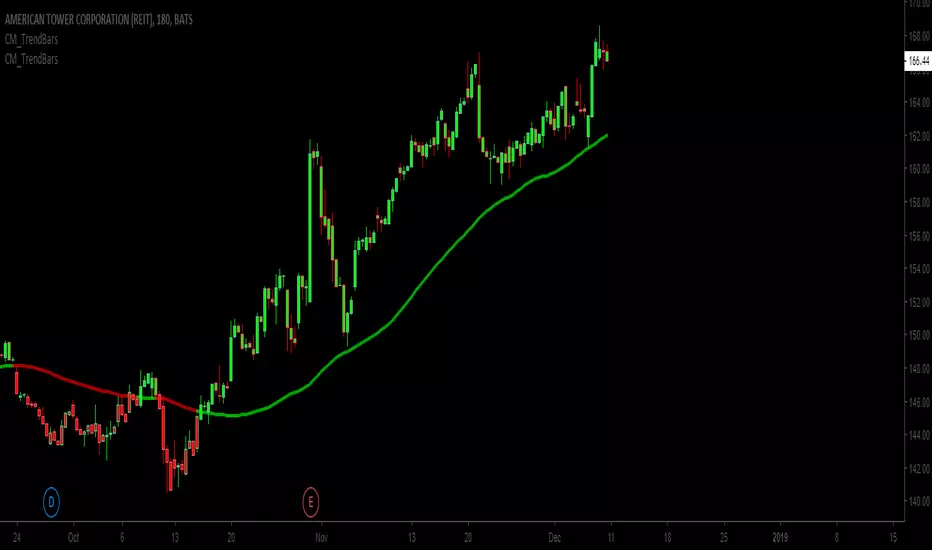
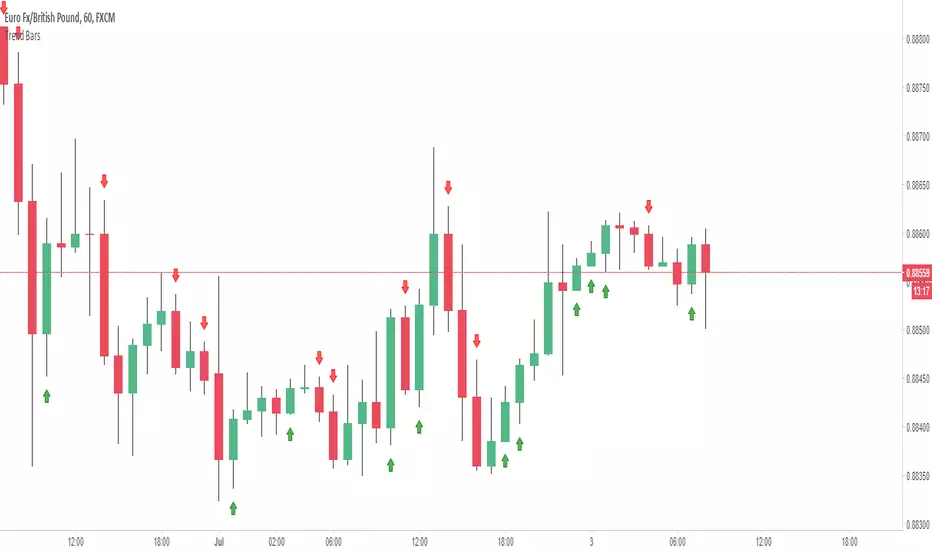
Trend bars with SMA trend linejust changing the colour of the candles based on a SMA trendline
Basic changes made to Chris Moody's trend bars setup
Third attempt by me to do this.
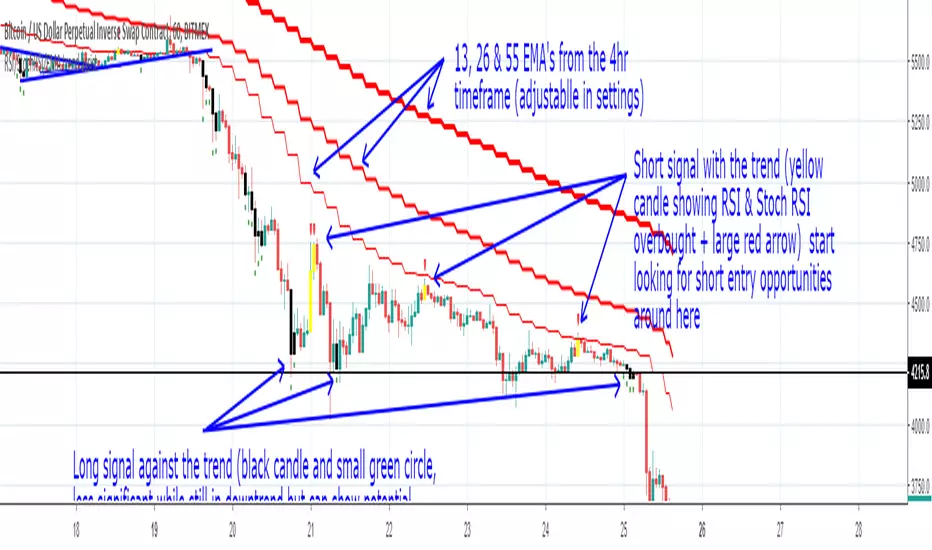
RSI/StochRSI/EMA trend assist- Trend determined by the crossover of the 4hr 13 and 26 EMA's (or whatever you set the Short and Mid term EMA to)
- Oversold conditions (Stoch RSI and RSI) are shown with a black candle
- Black candle and large green arrow below = Potential long WITH the trend
- Black candle and small green circle below = Potential long AGAINST the trend (used better as a warning to watch trade in case exit required.)
- Overbought Conditions (Stoch RSI and RSI) are shown with a yellow candle
- Yellow candle and large red arrow above = Potential shot WITH the trend
- Yellow candle with small red circle above = Potential short AGAINST the trend (used better as a warning to watch trade in case exit required.)
Best used to confirm your TA and provide additional confirmation on market conditions. (not as a standalone buy sell indicator)
I've found it useful for keeping my head right by showing me clearly the trend on the larger timeframes and keeping me out of the market until I see conditions that meet my entry criteria. Backtesting seems to show good results on the 1hr (default settings)

TREND PRESSURE BOTThis is the BOT version of the TREND PRESSURE script I previously published, optimised for Autoview and other crypto bots. This version is for 1H charts only.

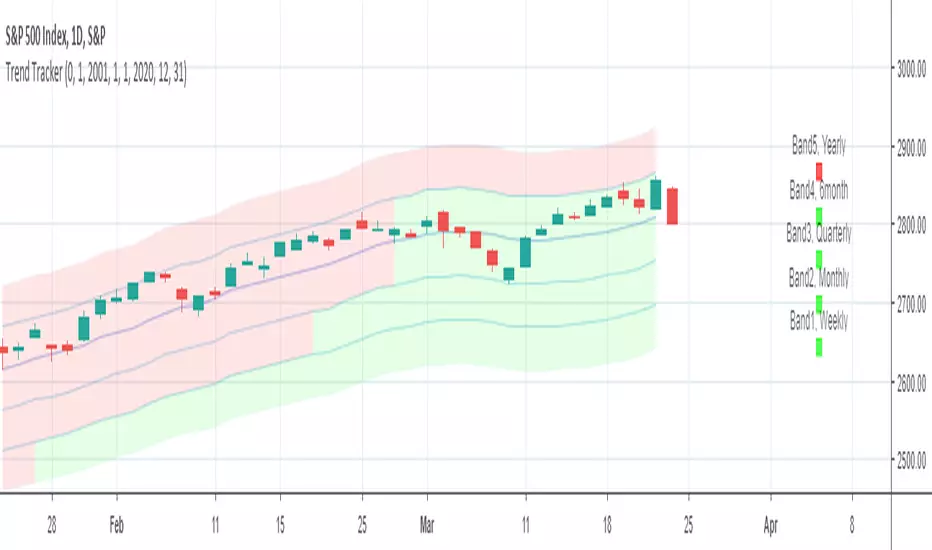
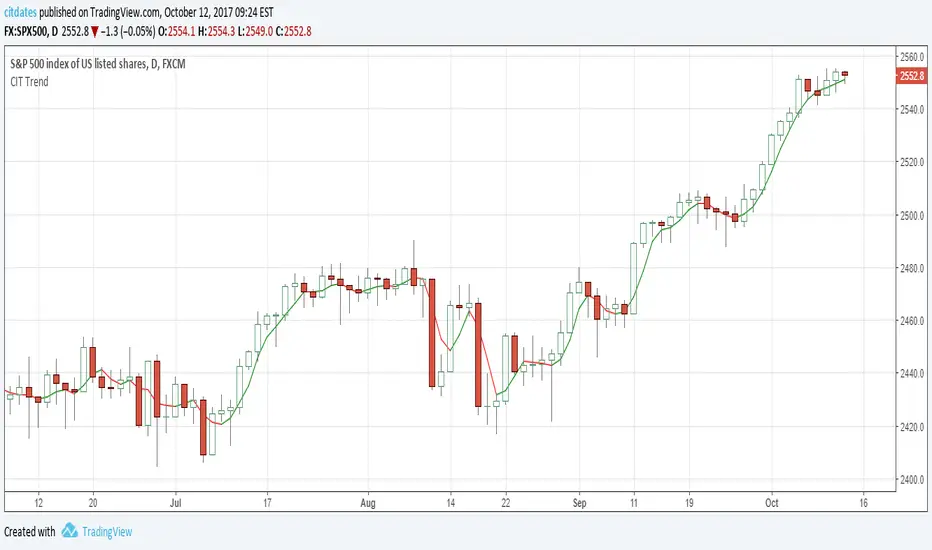
Trend tracker by ClefsphereThis script attempts to identify the trend and go with it. Green colored squares are bullish, Black squares are bearish. Script is written to show back-test results. Dates of back-test period can be adjusted. Strategy is for Long trades only, but closed trades could possibly be considered for Short trades. Coded with latest PineScript version 3.
For more information and to request for use, go to: marketcast.wordpress.com
Thanks for your interest and support!
Disclaimer: This information is not trading advice and is for educational purposes only. Past performance is not a guarantee of future results.
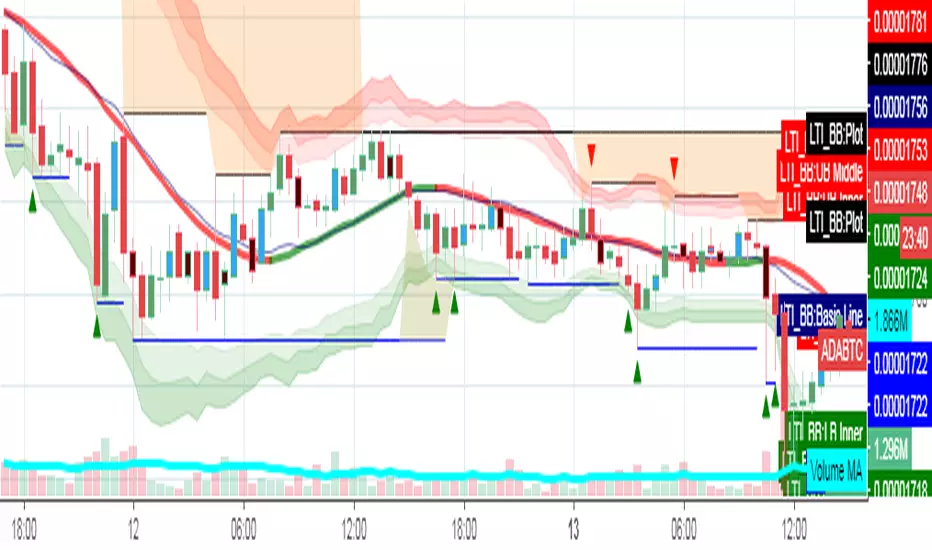
Letest Trend Indicator with Bollinger BandTrend Analysis with Bollinger Band using Support & Resistance and Pivot Blue EMA Breakout
Trend[S]it works as support and resistance in all time periods..the buy zone on the trend, and the sales zone below the trend.tells you about trend direction.
Use with ema 7.


Trend Trading DCRBTC
Listed on Houbi and Okex!! 13% profit.
My script helped me make a good entry into the decred yesterday, you will probably find that his hit rate is quite high.
Especially when you follow the trend in the right way.

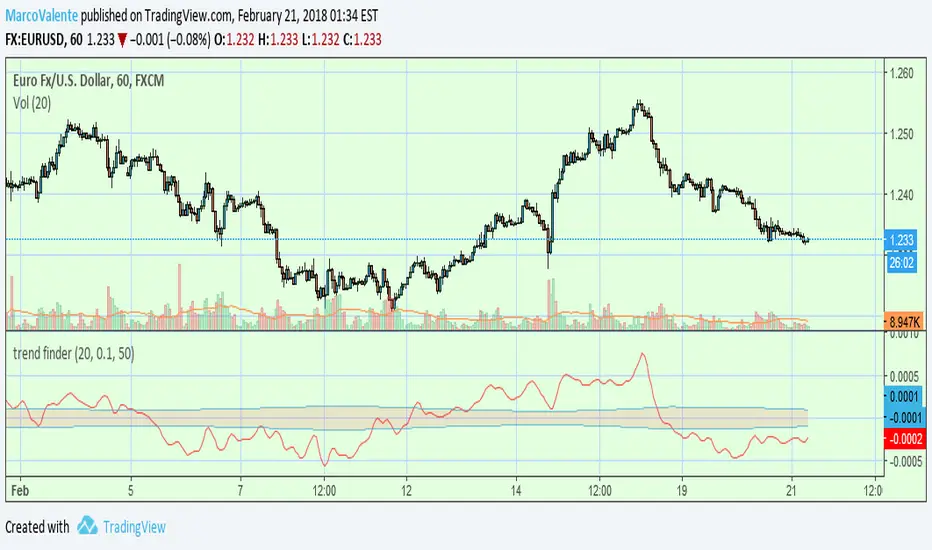
trend finderThis tool can help to find the trend. Above the band is bull and below is bear; line in the band is flat or a reverse coming soon.

Trendline Breakout Navigator [LuxAlgo]The Trendline Breakout Navigator indicator shows three trendlines, representing trends of different significance between Swing Points.
Dots highlight a Higher Low (HL) or Lower High (LH) that pierces through the Trendline without the closing price breaking the Trendline.
A bar color and background color option is included, which offers insights into the price against the trendlines.
🔶 USAGE
Trendlines (TL) are drawn, starting as a horizontal line from a Swing Point.
When an HL (in the case of a bullish TL) or an LH (bearish TL) is found, this Swing Point is connected to the first Swing Point. In both cases, the TL can be optimized when one or more historical close prices breach the TL (see DETAILS).
A solid-styled long-term trendline represents the overall market direction, while a dashed-styled medium-term trendline captures medium-term movements within the long-term trend. Finally, a dotted-styled short-term trendline tracks short-term fluctuations.
🔹 Swing Points vs. Trend
A "Higher High" (HH) or "Lower Low" (LL) will initialize a new trendline, respectively, starting from the previous "Swing Low" or Swing High".
To spot the trend shift, "HH/LL" labels and an optional background color are included. They can be enabled/disabled or set at "Long, Medium, or Short" term TL (Settings—"MS", "HH/LL" and "Background Color").
These features are linked to one Trendline of choice only.
Where the "HH/LL" labels can show a potential trend shift, the background color is:
Green from the moment the close price breaks above a bearish trendline or when an HH occurs
Red from the moment the close price breaks below a bullish trendline or when an LL occurs
🔹 Bar Color
The bar color will depend on the location of the closing price against the three trendlines. When a trendline is unavailable (for example, if the close price breaks the TL and there is no HH/LL), the last known trendline value will be considered.
All three trendlines influence the bar color.
If the close price is above the "Long Term" TL, the bar color will show a gradient of green, darker when the close price is below the "Medium Term" and/or "Short Term" TLs.
On the other hand, when the close price is below the "Long Term" TL, the bar color will show a gradient of red, which becomes darker when the close price is above the "Medium Term" and/or "Short Term" TLs.
To keep the above example simple, only the "Long Term" TL is considered. The white line (not included in the script) resembles the actual value of the TL at each bar, where you can see the effect on the bar color.
Combined with the trendlines and dots, the bar color can provide extra depth and insights into the underlying trends.
🔹 Tested Trendlines
If a new HL/LH pierces the Trendline without the close price breaking the Trendline, the Trendline will be updated.
The exact location where the price exceeded the Trendline is visualized by a dot, colored blue on a bullish trendline and orange when bearish.
These dots can be indicative of a potential trend continuation or reversal.
🔹 Higher TimeFrame Option
The "Period" setting enables users to visualize higher-timeframe trendlines as long as the line length doesn't exceed 5000 bars.
🔶 DETAILS
When a new trendline is drawn, the script first draws a preliminary line and then checks whether a historical close price exceeded this line above (in the case of a bearish TL) or below (in a bullish case).
Subsequently, the most valid point in between is chosen as the starting point of the Trendline.
🔶 SETTINGS
Period: Choose "chart" for trendlines from the current chart timeframe, or choose a higher timeframe
🔹 Swing Length
Toggle and Swing Length for three trendlines: Period used for the swing detection, with higher values returning longer-term Swing Levels.
🔹 Style
Trendline: color for bullish/bearish Trendline
Wick Dot: color for bullish/bearish trendline test
Term: Long-, medium- or short-term
HH/LL: Show HH/LL labels (with or without previous Swing High/Low) of chosen Term
Background Color: Green when the closing price is above the trendline of choice, red otherwise
Bar Color

Trend Analysis Ultimate (Zeiierman)█ Overview
Trend Analysis Ultimate (Zeiierman) highlights meaningful pullbacks within active market trends and visualizes them through green and red columns, retracement triangles, and an optional trend-colored background. It is designed to make the distinction between continuation and transition phases clear at a glance while automatically managing dynamic trailing stops, early and partial profit-taking levels, and alert conditions for entries, take-profits, and full exits.
The system adapts to changing market structure in real time, allowing traders to monitor momentum shifts, retracement strength, and phase transitions with precision. By combining structural mapping with adaptive sensitivity controls, it provides a complete framework for identifying where a trend is likely to continue, pause, or reverse.
⚪ Why This One Is Unique
Unlike traditional trend tools that simply color bars or measure moving averages, Trend Analysis Ultimate integrates retracement mapping with trend phase detection. Its framework merges contextual structure analysis (higher highs/lows or lower highs/lows) with dynamic sensitivity controls, identifying both the rhythm and the stress points within a trend.
Through a unified signal logic and adaptive retracement engine, traders can distinguish between normal pullbacks within a trend and retracements that precede reversal — all visualized with intuitive, color-coded accuracy.
█ Main features
⚪ Retracements
A retracement is a temporary move against the prevailing trend. It often signals a pause, potential continuation opportunity, or the early stages of a reversal. In this indicator, green/red retracement columns mark significant pullbacks that frequently precede new local highs/lows, continuation legs, or the end of a trend.
Key concept: Retracements appear at both continuation points and turning points. The trader’s edge is in recognizing whether the pullback is a reset of strength or the first warning that the current trend is losing control.
Bullish Retracement
Bearish Retracement
⚪ Retracements Signals
The Retracement Signals feature highlights the precise moments when a temporary counter-move within a dominant trend shows signs of exhaustion and potential continuation. It converts early momentum shifts into clear bullish or bearish setup signals.
Bullish Retracement Signal
Bearish Retracement Signal
⚪ Trend
The Trend Feature visually defines the current market regime — bullish, bearish, or neutral — by dynamically coloring bars, the indicator background, and the Confirmed Trend Columns in the lower panel. Together, these elements reflect the underlying directional bias detected by the trend engine, providing immediate context for all retracement, continuation, and entry signals.
Green bars, background, and confirmed columns → Active Bullish Trend Phase
Red bars, background, and confirmed columns → Active Bearish Trend Phase
Light or neutral bars → Transition Phase, signaling potential trend change or reduced directional strength.
█ How to Use
⚪ Major Retracements / Pullbacks
Major Bullish Retracements
Step 1: Ask Key Context Questions
When green retracement columns appear in the indicator window, ask yourself:
Are we in a bullish trend? Look for higher highs (HH) and higher lows (HL). Confirm that trendlines are pointing upward.
Is this forming a higher low? Green columns often print during pullbacks, just before price forms a higher low and the uptrend continues.
Is this a healthy correction? If price respects previous structure or the rising trendline, and the green bars begin shrinking, it indicates renewed strength and that the pullback may be ending.
Step 2: Apply Practically
If the answers above are Yes, the retracement likely represents a continuation opportunity.
Confirm an uptrend (HH/HL structure, rising trendlines).
Treat green columns as a pullback zone within that trend.
Watch for confirmation such as:
Rejection candles near support
Break of a short-term downtrend line
Volume confirming renewed buying pressure
Enter once price resumes upward movement, not during the retracement itself.
Major Bearish Retracements
Step 1: Ask Key Context Questions
When red retracement columns appear in the indicator window, ask yourself:
Are we in a bearish trend? Check if lower highs (LH) and lower lows (LL) are forming, and confirm that trendlines are pointing downward.
Is this forming a lower high? Red columns often appear during pullbacks, just before price forms a lower high and the downtrend resumes.
Is this a healthy correction? If price respects prior resistance or a falling trendline, and the red bars begin shrinking, it signals renewed weakness and that the pullback may be ending.
Step 2: Apply Practically
If the answers above are Yes, the retracement likely marks a continuation opportunity in the prevailing downtrend.
Confirm a downtrend (LH/LL structure, falling trendlines).
Treat red columns as a pullback zone within that trend.
Watch for confirmation such as:
Rejection candles near resistance
Break of a short-term uptrend line
Volume confirming renewed selling pressure
Enter once price resumes downward movement, not during the retracement itself.
⚪ Minor Retracements / Pullbacks
Minor retracements represent short, fast counter-moves within an active trend. They often occur as quick pauses or micro-corrections and are best suited for scalping or short-term continuation setups. Always align these signals with the dominant background trend and confirm direction using clear trendlines to stay on the right side of market structure.
Minor Bullish Retracements
When price is in a clear uptrend and a small pullback occurs:
Watch for short sequences of green retracement impulses (▲) or shrinking green columns on the indicator.
Treat these as quick buy-the-dip zones within the larger bullish context.
Look for confirmation from trendline support or a rejection candle before entering.
Minor Bearish Retracements
When price is trending downward and a brief rally appears:
Watch for red retracement impulses (▼) or shrinking red columns indicating weakening upward correction.
Use these as potential short re-entry zones in line with the broader downtrend.
Confirm with rejection at resistance or a break of a short-term uptrend line.
⚪ Retracements Signals
Bullish Signals
Bullish Retracement Signals appear during an active uptrend, typically within retracement phases when the market experiences a short-term pullback against the main trend. These signals are triggered when the retracement shows signs of exhaustion and the indicator detects renewed buying momentum aligned with the broader bullish structure.
They highlight potential continuation points, where the price may resume making higher highs after completing a healthy correction. This setup leverages the natural rhythm of the market — capturing the moment buyers regain control following temporary weakness.
Bearish Signals
Bearish Retracement Signals form during an active downtrend, typically within counter-trend rallies or retracement phases against the dominant bearish direction. They emerge when temporary upward movement loses strength, and the indicator identifies renewed selling pressure aligned with the main trend.
These signals often precede fresh downside continuation — when sellers reassert control and push price toward new lower lows.
⚪ Identifying the End of One Trend and the Start of Another
Every trend eventually runs out of strength. Early signs often look like a normal retracement, a routine pullback within the existing move. But when price fails to attract enough buyers or sellers to continue in the same direction, that retracement can mark the turning point where momentum shifts and a new trend begins.
When price can no longer find support in an uptrend or resistance in a downtrend, it signals exhaustion of the current phase and a possible transition into the opposite direction. The retracement columns highlight these transition zones, areas where one trend may fade and another may start forming.
When they appear, it’s important to ask:
Is the current trend mature? The longer a trend has been running, the greater the likelihood of reversal. If retracement columns show up late in a multi-leg move, treat them as early warnings.
Are there reversal signs forming? Watch for structures like double tops, double bottoms, trendline breaks, or channel violations that suggest the trend’s strength is fading.
By combining retracement columns with a clear understanding of trend structure and price action, traders can better distinguish between healthy pullbacks and the emergence of a new trend.
Bullish Trend Ends
Bearish Trend Ends
█ How It Works
⚪ Trend Phase Architecture
The indicator models directional bias through a continuously adaptive trend-mapping framework. It classifies market states as bullish, bearish, or neutral based on slope polarity and structural persistence.
Calculation: Utilizes layered regression vectors and dynamic range analysis to estimate directional gradients, blending short- and long-term components to maintain stability while remaining responsive to new motion.
⚪ Retracement Detection Engine
Retracement columns quantify counter-movements within the dominant trend, identifying deceleration, pullback depth, and phase overlap. Each bar’s classification reflects the relative strength trend progression.
Calculation: Applies trend-state comparison with phase-weighted averaging to isolate transitional motion. The resulting dual-polar columns (green/red) are normalized to a zero-centered scale for visual symmetry and precision.
⚪ Impulse & Triangle Module
Retracement impulses (▲/▼) represent local acceleration spikes during pullback phases, revealing the moment when opposing momentum reaches statistical significance.
Calculation: Identifies short-term impulse clusters through curvature mapping to isolate localized bursts of directional momentum within the retracement phase.
⚪ Entry & Signal Logic
The entry module fuses retracement data with trend-state validation, filtering signals through contextual structure and confirmation hierarchy. Only qualified impulses aligned with the dominant vector trigger actionable events.
Calculation: Integrates a composite decision function using multi-phase sensitivity weighting, differential smoothing, and state gating to separate impulsive noise from valid continuation momentum.
-----------------
Disclaimer
The content provided in my scripts, indicators, ideas, algorithms, and systems is for educational and informational purposes only. It does not constitute financial advice, investment recommendations, or a solicitation to buy or sell any financial instruments. I will not accept liability for any loss or damage, including without limitation any loss of profit, which may arise directly or indirectly from the use of or reliance on such information.
All investments involve risk, and the past performance of a security, industry, sector, market, financial product, trading strategy, backtest, or individual's trading does not guarantee future results or returns. Investors are fully responsible for any investment decisions they make. Such decisions should be based solely on an evaluation of their financial circumstances, investment objectives, risk tolerance, and liquidity needs.
付費腳本

Trendline Pivots [QuantVue]Trendline Pivots
The Trend Line Pivot Indicator works by automatically drawing and recognizing downward trendlines originating from and connecting pivot highs or upward trendlines originating from and connecting pivot lows.
These trendlines serve as reference points of potential resistance and support within the market.
Once identified, the trend line will continue to be drawn and progress with price until one of two conditions is met: either the price closes(default setting) above or below the trend line, or the line reaches a user-defined maximum length.
If the price closes(default setting) above a down trend line or below an up trend line, an "x" is displayed, indicating the resistance or support has been broken. At the same time, the trend line transforms into a dashed format, enabling clear differentiation from active non-breached trend lines.
This indicator is fully customizable from line colors, pivot length, the number lines you wish to see on your chart and works on any time frame and any market.
Don't hesitate to reach out with any questions or concerns.
We hope you enjoy!
Cheers.

Trend Algo (Zeiierman)█ Overview
Trend Algo (Zeiierman) converts raw price movement into a cohesive, volatility-aware trend map. Rather than static moving averages, it builds an adaptive trend core that responds to market state changes, then layers regime-sensitive clouds (Infinite Sky) and horizon-bounded channels (HorizonX), plus precise trend-change and continuation signals. The result is a clean framework for reading direction, timing pullbacks, and validating momentum.
The indicator visualizes the active trend line, adaptive clouds, and stateful signals to reveal transition zones, trend acceleration, and exhaustion. It suits intraday execution, swing confirmations, and structural regime assessment.
⚪ Why This One Is Unique
Unlike conventional trend tools, this version combines volatility-normalized trend estimation, AI-style regime clustering, and horizon-bounded support/resistance channels. Its framework uses multi-phase smoothing, adaptive width scaling, and state detection that aligns entries and continuations with current market inertia—reducing whipsaw while preserving responsiveness.
█ Main features
⚪ Dynamic Clouds
The Dynamic Trend Line provides a stabilized, noise-aware trajectory of price, color-coded by directional bias. Two cloud systems overlay the core trend:
Infinite Sky (AI) — a regime-aware cloud that distinguishes fast vs. slow trend states.
HorizonX — adaptive channels that operate as dynamic support/resistance and define trend boundaries.
⚪ Candle Coloring
The candle coloring is designed to highlight trend momentum peaks, allowing you to instantly recognize when the trend is accelerating or slowing down. This visual feedback makes it easier to interpret the strength and speed of directional moves directly on the chart, seamlessly complementing the Dynamic Trend Line and Cloud systems.
⚪ Trend Change Signals & Trend Continuation Signals
The main signals are the Trend Change Signals , designed to trigger when the current trend structure begins to shift its state. These signals give you an instant sense of when a potential trend reversal or directional change might occur.
To complement them, we’ve added Trend Continuation Signals , which only activate within an established trend. These signals confirm the current direction and indicate that the trend is gaining strength and preparing for another move in the same direction.
⚪ Trend Line
Two types of trend lines are integrated: Stability and Dynamic.
The Stability Line follows the current price action in a smooth, drift-like manner — staying closer to price to act as a faster support and resistance zone.
The Dynamic Line adapts to volatility, ensuring that continuous movements within the trend are taken into account. This helps traders stay aligned with the trend and capture extended moves during periods of higher market activity.
█ How to Use
⚪ Trend Changes
Trend Change Signals appear when the current trend structure begins to shift, signaling a potential reversal or directional transition. These signals help traders anticipate moments when momentum weakens or changes direction, offering early insight into possible turning points in the market. Combine Trend Change Signals with Candle Coloring or Cloud behavior to confirm entries and strengthen trend reversal validation.
⚪ Trend Continuations
Trend Continuation Signals trigger within an established trend, confirming that the current direction remains strong. They often appear after pullbacks or pauses, suggesting that the market is ready for another move in the same direction. These signals work best when paired with the Dynamic Trend Line, allowing traders to stay confidently aligned with powerful ongoing trends.
⚪ Support and Resistance
The Stability Trend Line acts as a reactive support and resistance guide, staying close to price and highlighting areas where market reactions are most likely to occur. It offers traders a clear view of short-term structure and helps identify potential bounce or rejection zones with precision.
The Dynamic Trend Line adapts to volatility, forming flexible support and resistance zones that expand during strong momentum and contract during quieter phases, keeping the visual structure balanced and responsive to changing market conditions.
HorizonX defines the outer adaptive boundaries of the trend. These dynamic channels operate as broader support and resistance frameworks, helping traders anticipate trend exhaustion or continuation zones beyond the immediate price action.
The Infinite Sky (AI) cloud adds a regime-aware layer that distinguishes fast and slow trend states, visually framing the strength of support or resistance regions as they evolve and allowing traders to read both momentum and structure in a single glance.
█ How It Works
⚪ Dynamic Trend Core
A volatility-normalized estimator generates the primary trajectory and color state, balancing stability vs. agility by adapting to dispersion and displacement.
Calculation: Multi-phase weighted smoothing with volatility-scaled adjustments and adaptive phase control to minimize lag while preserving curvature.
⚪ Infinite Sky (AI Regime Cloud)
Differentiates fast vs. slow trend states and paints a regime-aware cloud that guides timing and risk.
Calculation: Windowed return modeling (with optional consolidation), two-pole response filtering, and distribution-center clustering to classify regimes and modulate the envelope.
⚪ HorizonX Trend Channels
Defines dynamic support/resistance “horizons” that expand/contract with conditions and filter counter-trend noise when strong-trend mode is enabled.
Calculation: A volatility-aware core that evolves with changing price dynamics, maintaining precision across all market conditions.
⚪ Trend Line & Continuations
A fast reaction line confirms pullbacks and validates continuation only when aligned with prevailing bias and structure.
Calculation: Short-horizon smoothing with phase-managed weighting, slope/position gating, and context checks against regime and horizon levels.
⚪ Impulse Detection
Identifies statistically meaningful bursts that precede expansion or warn of exhaustion after extended runs.
Calculation: Nonlinear impulse-response mapping emphasizing second-order changes in directional energy while suppressing micro-noise.
⚪ Trend Bands
Upper/lower bands visualize the active envelope for timing adds, trims, or exits within trend.
Calculation: Percentile-guided banding blended with adaptive anchors to retain structural relevance through regime shifts.
⚪ Bar Color Integration
Bars can inherit trend/gradient context to make state shifts obvious at a glance.
Calculation: Algorithmic gradient model integrating directional momentum intensity to render bar coloration in sync with market flow.
-----------------
Disclaimer
The content provided in my scripts, indicators, ideas, algorithms, and systems is for educational and informational purposes only. It does not constitute financial advice, investment recommendations, or a solicitation to buy or sell any financial instruments. I will not accept liability for any loss or damage, including without limitation any loss of profit, which may arise directly or indirectly from the use of or reliance on such information.
All investments involve risk, and the past performance of a security, industry, sector, market, financial product, trading strategy, backtest, or individual's trading does not guarantee future results or returns. Investors are fully responsible for any investment decisions they make. Such decisions should be based solely on an evaluation of their financial circumstances, investment objectives, risk tolerance, and liquidity needs.
付費腳本

TrendLine ScythesTrendline Scythes is a script designed to automatically detect and draw special curved trendlines, resembling scythes or blades, based on pivotal points in price action. These trendlines adapt to the volatility of the market, providing a unique perspective on trend dynamics.
🔲 Methodology
Traditional trendlines connect consecutive pivot points on a price chart, providing a linear representation of trend direction. However, this script employs a distinctive methodology by automatically detecting price pivots and then calculating special curved trendlines based on the Average True Range (ATR) of the price. This introduces a curvature to the trendlines, resembling scythes, offering a unique way to interpret market trends.
🔲 Auto Breakout and Target Detection
Trendline Scythes includes features for automatic breakout detection, signaling potential trend changes. Additionally, the script assists in target detection, helping traders set realistic and data-driven profit-taking levels based on market volatility and user adjustment.
🔲 Utility
Trend Confirmation - Use Trendline Scythes to confirm existing trends by observing how price interacts with the curved trendlines.
Breakout Signals - Auto-detection of breakouts adds a proactive element to your trading strategy, helping you stay ahead of potential trend reversals.
Target Setting - Utilize the script to set profit-taking targets based on volatility, aligning with the current market conditions.
🔲 Settings
Pivot Length - Swing detection length
Scythe Length - Adjusts the length of the scythes blade
Sensitivity - Controls how restrained the target calculation is, higher values will result in tighter targets.
🔲 Alerts
Breakout
Breakdown
Target Reached
Target Invalidated
As well as the option to trigger 'any alert' call.
Trendline Scythes is a versatile tool combining the benefits of traditional trendlines with the dynamic adaptability of curved lines for a unique approach to trend analysis.

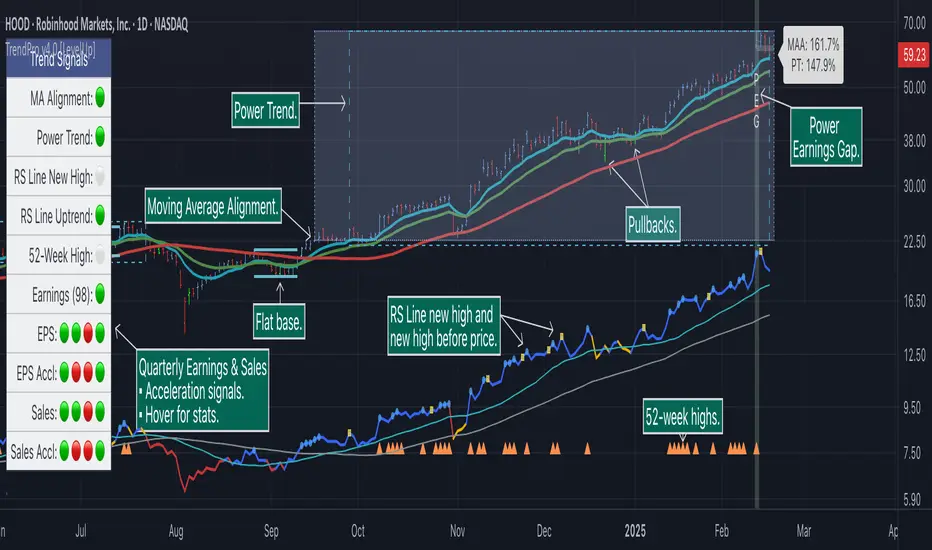
Trend Alignment Pro [LevelUp]Trend Alignment Pro™ is designed for traders who focus on trading with the trend. This indicator automates key aspects of fundamental and technical analysis to identify and highlight chart patterns and signals, drawing on the proven techniques of legendary trend-following traders such as William O'Neil, Jesse Livermore, and Stan Weinstein.
The indicator name, Trend Alignment , emphasizes the importance of confirming price action, patterns, and signals across multiple timeframes. It provides both daily and weekly analysis to enable accurate and timely trend identification.
🔹—— Key Features ——🔹
Daily Timeframe
Moving Average Alignment™
▪ Highlight trends based on moving averages and price action.
▪ Specify price in relation to moving averages (e.g. close above).
▪ Specify which moving averages are required to be in an uptrend.
▪ Specify moving average stacking requirements (e.g. fast above slow).
▪ Require active Power Trend (optional).
▪ Set stop-loss and requirements to end Moving Average Alignment.
Power Trend Tools and Analysis
▪ Highlight Power Trends with box or symbols at start/end points.
▪ Auto-tracking of key metrics towards a new Power Trend.
Custom Moving Averages
▪ Specify type (EMA/SMA), length and color.
▪ View 10-week SMA on daily chart.
Stats Table
▪ Comprehensive daily price and percent change stats.
Signals Table
▪ Track important trend signals with clear visuals.
Power Earnings Gap (PEG) Detection
▪ Auto-detect and highlight Power Earnings Gaps.
▪ Customize requirements, such as gap-up percent and earnings surprise.
Weekly Timeframe
Custom Moving Averages
▪ Specify type (EMA/SMA), length and color.
Tight Weeks and Up Weeks
▪ Specify weekly and percent change requirements.
Stats Table
▪ Comprehensive weekly price and percent change stats.
Daily & Weekly Timeframes
Flat Base & Consolidation
▪ Automated detection with defaults based on the active timeframe.
Custom Relative Strength Line
▪ Specify index and lookback range.
▪ Symbols plotted on RS Line indicating new high and new high before price.
▪ Two custom moving averages for daily & weekly timeframes.
Anchored VWAP (AVWAP)
▪ Multiple anchor options: year-to-date, year-to-date low/high.
Pullbacks
▪ Set key requirements and minimum number of bars.
52-Week and All-Time Highs
▪ Bullish indicators indicating outperformance.
Marked Highs & Lows
▪ Identify potential areas of support/resistance.
🔹—— Daily Chart Examples ——🔹
Daily charts are ideal for analyzing short to intermediate term trends and spotting actionable setups as they develop.
🔹—— Weekly Chart Example ——🔹
Weekly charts are helpful for identifying longer-term trends and patterns.
🔹—— Moving Average Alignment (Daily) ——🔹
Moving Average Alignment™ (MAA) is a trend-identification tool that uses moving averages, price action and their relationships to one another to detect momentum and upward trends. MAA offers extensive customization, including the following:
▪ Moving average types (EMA/SMA) and length.
▪ Which moving averages are required to be in an uptrend.
▪ Requirements on the order of moving averages (e.g. fast above slow).
▪ Optional requirement that the stock be in a Power Trend.
▪ Set stop-loss and requirements to signal the end of the MAA.
MAA delivers clear visual confirmation of trend strength and helps identify both the start and potential end of an uptrend.
🔹—— Power Trend (Daily) ——🔹
The concept of a Power Trend was created by Mike Webster, Justin Nielsen and Charles Harris while working with William O’Neil, founder of Investor's Business Daily and creator of the CANSLIM methodology. When a Power Trend is active, there is a stronger than usual uptrend underway.
A Power Trend by definition uses a major index, such as the Nasdaq Composite (IXIC), as the data source for determining a Power Trend's state. The Trend Alignment indicator builds upon this concept by enabling the current chart symbol to be the data source for the Power Trend, thus offering traders a unique and quantifiable signal when a stock is in a strong uptrend.
What Starts A Power Trend
▪ Low is above the 21-EMA for at least 10 days.
▪ 21-EMA is above the 50-SMA for at least five days.
▪ 50-SMA is in an uptrend.
▪ Close up for the day.
What Ends A Power Trend
▪ 21-EMA crosses under 50-SMA and the close is below prior day close.
▪ Close below the 50-SMA and low is 10% below recent high.
One unique feature of the Trend Alignment indicator is that you can track the progress towards a new Power Trend beginning. See the chart below for more details.
🔹—— Power Earnings Gap (Daily) ——🔹
A Power Earnings Gap refers to a stock experiencing a significant price gap-up, on high volume, following an earnings report. This typically occurs when the stock opens at least 5-10% (or more) above the prior day's close, forming a gap-up bar on the chart that signals strong retail and/or institutional buying and the start or continuation of a major uptrend. It's a bullish pattern seen in leading growth stocks that often continue to outperform.
There are extensive customization options including required gap-up percent, minimum volume change over the average volume and preferred earnings surprise requirements.
🔹—— Relative Strength Line ▪ RS Line (Daily & Weekly) ——🔹
The Relative Strength Line (RS Line), another concept popularized by William O’Neil, is a technical indicator used in stock analysis to measure a stock's performance relative to a benchmark index, such as the S&P 500. An upward-trending RS Line indicates the stock is outperforming the market, while a downward trend shows underperformance. This helps identify potential leaders or laggards regardless of market conditions.
RS Line New High
When the RS Line reaches a new high, this signals that the stock's relative strength against the benchmark is at its highest point over the current lookback range — clear evidence of market leadership.
RS Line New High Before Price
When the RS Line hits a new high ahead of the stock's price reaching a new high, this can be a leading indicator of impending price strength, as it shows the stock gaining momentum relative to the market before that strength is reflected in its price. This signal shows early outperformance and potential market leadership, often preceding a breakout or trend continuation.
New High and New High Before Price Symbols
Easily spot RS Line new highs and new highs before price; a small circle on the RS Line indicates new highs and a small square highlights new high before price.
Highlight Breaks of Moving Averages
There are two custom moving averages of the RS Line that can be configured. Looking for breaks above or below these moving averages can be helpful to effectively manage positions, such as scaling out of a trade systematically.
🔹—— Tight Weeks and Up Weeks (Weekly) ——🔹
In William O'Neil's CANSLIM methodology, tight weekly closes and up weeks are key technical indicators used to evaluate stock chart patterns and identify potential buying opportunities. Tight and up weeks may indicate institutional accumulation and price strength.
Tight closes on a weekly timeframe refer to consecutive weeks where closing prices stay within a narrow 1-1.5% range of the prior week's close, often with declining volume. This signals buyer control and accumulation, making it a bullish indicator, particularly in patterns like three-weeks-tight after an initial breakout.
When a stock closes higher than the prior week, this signals positive momentum. Multiple up weeks often indicate sustained buying and may help to spotlight emerging leaders. Increased volume on up weeks show institutional support and increase the potential for a breakout.
🔹—— Automated Anchored VWAP ▪ AVWAP (Daily & Weekly) ——🔹
Based on the work of Brian Shannon, CMT, the anchored VWAP (AVWAP) shows the average price a stock has traded at, weighted by volume, starting from a specific point in time, the anchor. AVWAP can be helpful for trend confirmation and reversals, breakout and breakdown signals as well as risk management for placing stops.
The AVWAP works with any exchange around the globe, respecting trading days, hours and holidays. Use the AVWAP with the TradingView Replay feature for historical and post-mortem analysis.
🔹—— Marked Highs and Lows (Daily & Weekly) ——🔹
Pivot highs and pivot lows are core principles in technical analysis for identifying potential turning points, support/resistance, and trends. Shown on the chart as either price or a triangle symbol, these visual cues help to quickly spot significant price levels.
Pivots highlight historical turning points in price, serving as reliable zones for potential bounces or breakouts. They can also help determine overall market direction, for example, higher highs and higher lows in uptrends. Pivots also represent where demand overwhelms supply or vice versa.
🔹—— Price Stats and Signals Tables (Daily & Weekly) ——🔹
Comprehensive daily and weekly price stats. Daily charts also includes real-time signals to monitor the trend as well as quarterly earnings and sales data.
🔹—— Custom Alerts ——🔹
The Trend Alignment indicator supports custom alerts:
▪ Moving Average Alignment started.
▪ Moving Average Alignment ended.
▪ Power Trend started.
▪ Power Trend ended.
▪ Power Earnings Gap started.
🔹—— Best Practices ——🔹
▪ Look for confirmation of an uptrend on multiple timeframes.
▪ Use multiple signals and/or patterns for confirmation of the trend.
▪ Relative strength is key to find stocks outperforming the market.
▪ Focus on companies with earnings and sales acceleration.
▪ Avoid chasing extended stocks.
▪ Always define risk before entering a trade — know where you’ll exit.
▪ Size positions based on volatility and conviction, not emotion.
▪ Be patient — trends take time to develop.
付費腳本
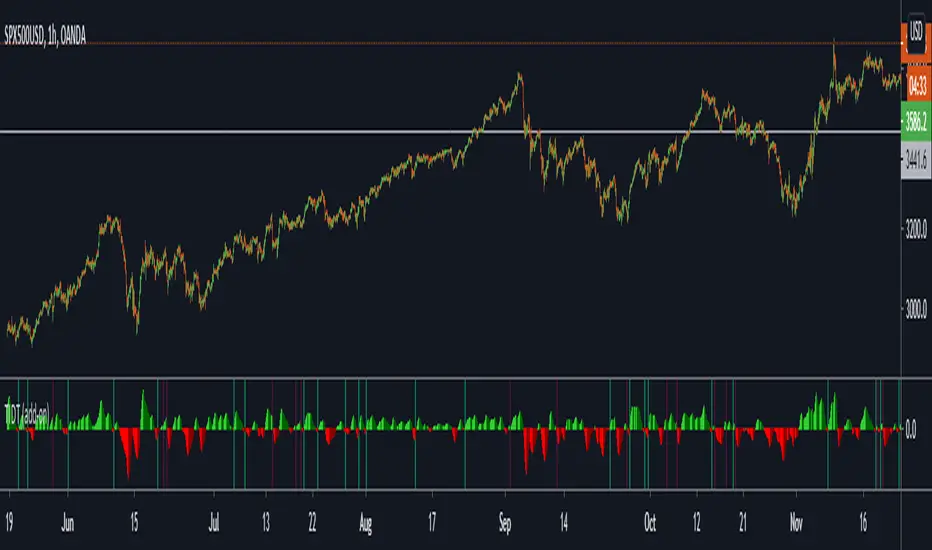
Trend Indicator for Directional Trading (add-on)TIDT is a two-part trend-based indicator designed to recognize the general direction and help you identify good opportunities for going long or short (both indicators are called the same way with "main" and "add-on" additions).
This is the add-on indicator that is added below the chart and aside from identifying trending opportunities, it also shows Bullish and Bearish Divergences. Similar to the main indicator, it is based on 3 Moving Averages over which you have full control. You can choose between the following 7 types:
- Simple Moving Average ( SMA )
- Exponential Moving Average ( EMA )
- Weighted Moving Average ( WMA )
- Running Moving Average (RMA)
- Hull Moving Average ( HMA )
- Volume Weighted Moving Average ( VWMA )
- Arnaud Legoux Moving Average ( ALMA )
I strongly suggest that the types and periods for your MAs in the main and the add-on versions are identical so that you get a better visual of the whole picture. However, you may develop a trading strategy that relies on two different types of signals, so that's entirely up to you. Once you have set up the MAs and chosen the lookback period, the rest is taken care of for you. You get two types of signals:
1) Pullbacks - the divergences between your MAs generate a result, which is then averaged as a percentage gain or loss and worked out into a histogram. The colors of the histogram indicate opportunities to buy (if green), short (if red), or sit tight (if white) unless an explicit signal is given by the indicator. Overall the principle is simple - establish the trend and look for weaknesses so that you can open an order in the direction of the trend.
2) Divergences - generated in a similar way to the Pullbacks strategy with some minor adjustments and improvements to better catch the divergences. The histogram is slightly different, as the positive results are plotted above 0 and the negative ones below 0. As such, the histogram looks a lot like MACD, but with different calculations. The color principle mentioned above is the same - green for longs, red for shorts, and white for neutral unless specified by a signal. The change of the shade of the color shows an increase or a decrease in the momentum. A Long signal comes up when the price makes a lower low, while the momentum makes a higher low. A Short signal comes up when the price makes a higher high, but the momentum makes a lower high.
Ticking a box next to the signal type will show the associated histogram and its signals. Due to the different ways those two histograms are calculated and displayed I recommend having either of them On, but not both. However, you may want to be able to see both types of signals, so I've left this as an option. Once again, all colors are fully configurable.
The complete Trend Indicator for Directional Trading has gone over 1,500 revisions, has been forked over 10 times, and has been worked out to be as minimalistic, useful, and practical as possible. A great deal of work, time, and experience have been poured into this indicator to do what it's supposed to do - help you identify better entry opportunities for increased profitability.
If you have any questions regarding the indicator or suggestions on how it could be improved, please let me know. Thank you.