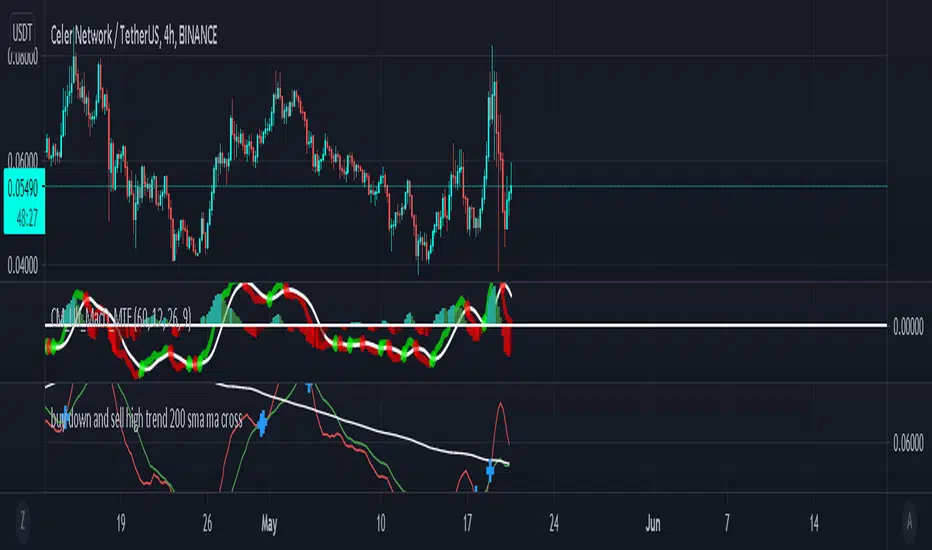
buy down and sell high trend 200 sma and ma cross this indicator showing you when have to buy down and sell high and also can see the market trend is being above or below
I'm sorry if there is an error
在腳本中搜尋"trend"
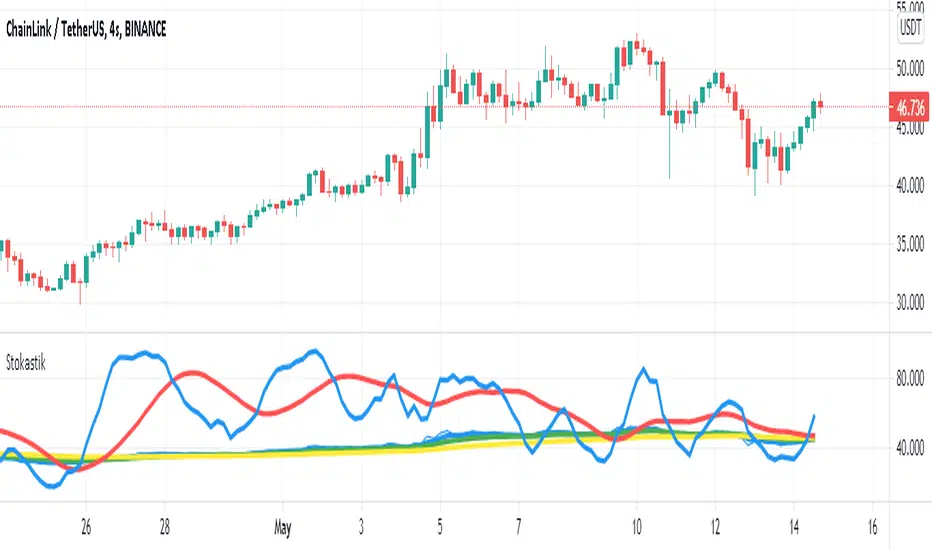
4-Hour Stochastic EMA TrendThis trading strategy relies heavily on catching the trend. You
may have success using this strategy on as low as the one hour
chart or as high as the daily chart; however, I’ve had most
success trading it on the four hour chart. This strategy consists
of four indicators, which are:
1. 5 Period Exponential Moving Average (closed)
2. 15 Period Exponential Moving Average (closed)
3. 50 Period Exponential Moving Average (closed)
4. Stochastic indicator K=13 D=5 Smooth=5 (13,5,5) 80/20
Levels
Refer
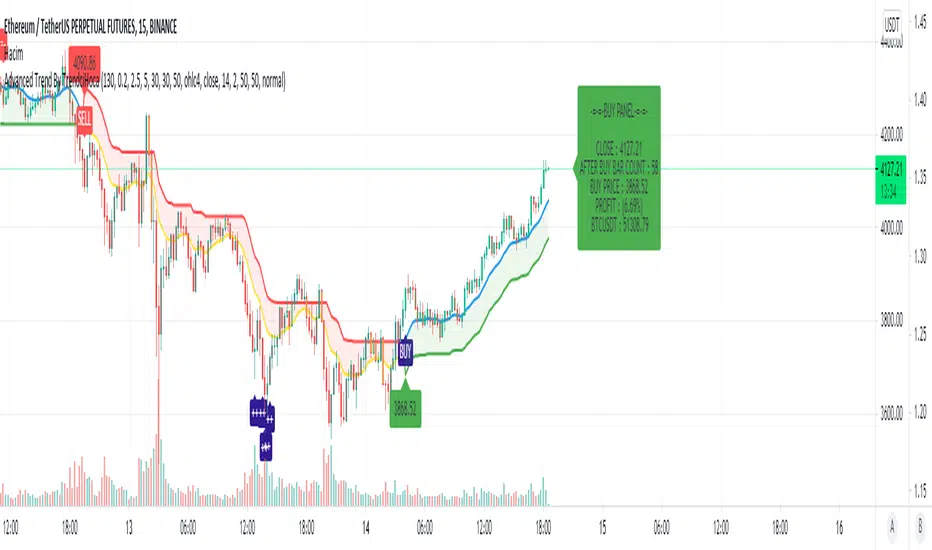
Advanced Trend By TrendciHocaMany people want to earn more while earning. But sometimes terminating can bring more profit. The meaning of the flag symbols on the graph means if you want the minus symbol that comes when the trend is up, take profit, the minus symbol that comes when the trend is down means take profit again. Sometimes these signals can allow you to get more profit. This indicator prepared for one hour period but if you want you can use all period. You can also have info panel that shows you how much percent of your last buy or sell profit. You can use all stocks and coins.
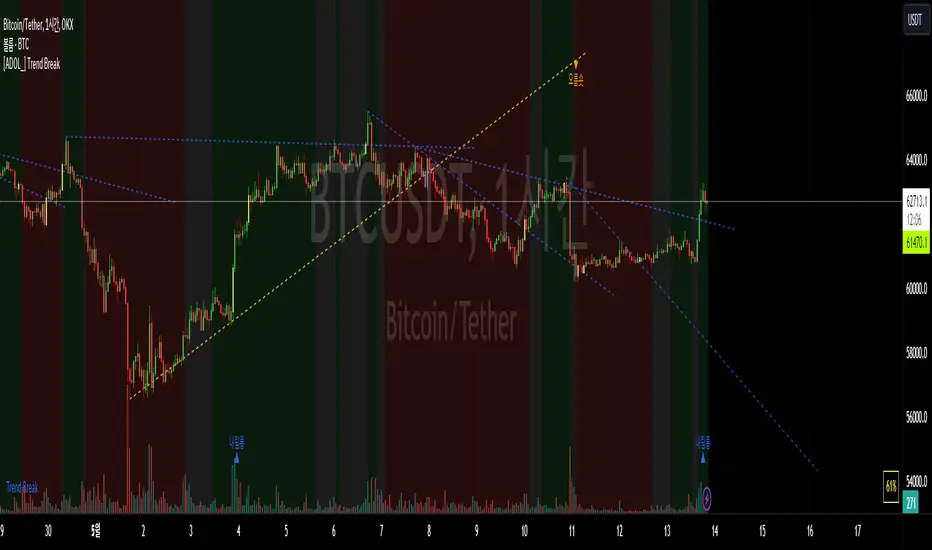
[ADOL_]Trend BreakENG)
Trend Break trend break+
It automatically draws a trend line and generates signals based on elaborate standards.
It is a secretary who plays an excellent role as an auxiliary tool in the sale and sale.
Trend lines are an important tool in determining the direction of trading.
These indicators are automatic trend line construction and trading signal generation indicators.
The background informs the trend section. The key function is the notation of signals.
principle)
It reflects the concept of HH and LL.
What is HH? Abbreviation of Higher High, which means to increase the high point.
What is LL? It stands for Lower Low, which means to lower the low point.
The trend line is created by the basic construction method that connects the highs and the highs, and the lows and the lows.
The basic signal is prepared by generating a signal from the 3 previous candles of the breakthrough of the trend line.
Basic signal; L for long, S for short
When the flow continues in one direction by reflecting the candle flow in ascending and descending order
Create a filtered signal.
Filtering signal; Filtering signals are marked with ★.
The background is the output through direction matching filtering of the double weighted moving average.
Green Background: Uptrend Progress
Red background: downtrend progress
Gray background: neutral zone (rebound, retracement, crossing)
Principle example)
This is an example of a signal with no filtering applied.
This is an example of a filtered signal.
option)
Line color, line shape, whether or not to include a tail when drawing a trend, line thickness
You can choose options such as.
Time frame)
Applicable to all time frames.
Scalping: 1 minute bar, 3 minute bar
Single hit: 3 minutes, 15 minutes, 1 hour
Swing: 1 hour salary, 4 hour salary, daily salary
Applicable market)
Applicable to all markets.
Examples of market application)
NASDAQ
Korean stocks (ex: Samsung Electronics)
alert)
You can use the alert function.
-Background alert for trend direction
-Alert to break through downtrend line and alert to break through uptrend line
-Filtering applied alert to break through the downtrend line
-Filtering applied alert to break through the uptrend line
Trading method)
1. The trend line refers to the concept of support/resistance touch. Through the concept of touch
You can set a standard once more to see if the signal output is adequate.
One touch of support/resistance line: On the first touch, see long at the support line and short at the resistance line.
Touch the support/resistance line 2: Check the position once more in the step of building (consolidating) the support/resistance line. Long at the support level and short at the resistance level.
3 touches of the ground/resistance line: This is the section with high possibility in both directions.
Support/resistance line 4 (or higher) touch: Use as a breakthrough reference line. When breaking through, hit short at the support line and long at the resistance line.
If the support/resistance line breaks through to the closing price, support becomes resistance and resistance becomes support."
2. Entry Criteria/Stop Loss Criteria
-Entry criteria; Follow the signal.
-Stop loss criteria;
Using Fixed Stop Loss: Set the 1% fixed stop loss interval from signal generation (% is set individually).
Use of Candle Stop: When the low or high point of the signal generating rod collapses, set the stop loss.
Use of flow stop loss: Set the stop loss by considering the flow of the wave.
3. Note
All trading decisions you make are your sole responsibility.
If the indicators were helpful, please support us. Help in developing the following metrics.
4. How to use
Tap Add Indicator to Favorites. Click on the indicator at the top of the chart screen and look at the left tab
Indicators have been added. Press to use. Anyone can use it.
KOR)
Trend Break 추세돌파+
추세선을 자동으로 작도해주며, 정교화된 기준으로 시그널을
발생시켜 매매에 보조도구로써 훌륭한 역할을 수행해내는 비서입니다.
추세선은 매매의 방향성을 결정하는데 중요한 도구입니다.
해당 지표는 자동 추세선 작도와 매매 시그널 발생 지표입니다.
배경은 추세구간을 알려줍니다. 핵심기능은 시그널의 표기입니다.
원리)
HH와 LL의 개념을 반영합니다.
HH란 ? Higher High의 약자로 고점을 높인다는 의미입니다.
LL란? Lower Low의 약자로 저점을 낮춘다는 의미입니다.
추세선은 고점과 고점, 저점과 저점을 잇는 기본 작도 방법으로 만들어집니다.
추세선 돌파의 3개 이전 캔들부터 신호발생으로 준비를 기본 시그널을 만듭니다.
기본 시그널 ; 롱의 경우 L 표기, 숏의 경우 S표기
오름차순과 내림차순의 캔들 흐름을 반영하여, 한 방향으로 흐름이 지속될때
필터링된 시그널을 만듭니다.
필터링 시그널 ; 필터링 시그널은 ★ 표기가 붙습니다.
배경은 이중 가중이동 평균의 방향일치 필터링을 통한 출력입니다.
초록색 배경 : 상승추세 진행
빨간색 배경 : 하락추세 진행
회색 배경 : 중립구역(반등, 되돌림, 교차)
원리 예시)
필터링이 적용되지 않은 시그널의 예시입니다.
필터링이 적용된 시그널의 예시입니다.
옵션)
선색상, 선모양, 추세선작도시 꼬리포함여부, 선굵기
등의 옵션을 선택할 수 있습니다.
타임프레임)
모든 시간프레임에 적용 가능합니다.
스캘핑 : 1분봉, 3분봉
단타 : 3분봉, 15분봉, 1시간봉
스윙 : 1시간봉, 4시간봉, 일봉
적용시장)
모든 시장에 적용 가능합니다.
시장 적용의 예시)
나스닥
한국주식(예 : 삼성전자)
알람)
얼러트 기능을 사용할 수 있습니다.
- 추세방향성에 대한 배경의 얼러트
- 하락추세선 돌파 얼러트, 상승추세선 돌파 얼러트
- 필터링을 적용한 하락추세선 돌파 얼러트
- 필터링을 적용한 상승추세선 돌파 얼러트
매매방법)
1. 추세선은 지지/저항의 터치 개념을 참고합니다. 터치의 개념을 통해
시그널 출력이 적절한지 한번 더 기준을 잡을 수 있습니다.
지지/저항선 1터치 : 첫번째 터치에는 지지선에서 롱을, 저항선에서 숏을 봅니다.
지지/저항선 2터치 : 지지/저항선 구축(다지기)의 단계로 한번 더 자리를 확인합니다. 지지선에서 롱을, 저항선에서 숏을 봅니다.
지/저항선의 3터치 : 양방향의 가능성이 높은 구간입니다.
지지/저항선4(이상)터치 : 돌파기준선으로 사용합니다. 돌파할 때, 지지선에서 숏을, 저항선에서 롱을 칩니다.
지지/저항선이 종가로 뚫리면 지지는 저항이 되고, 저항은 지지가 됩니다."
2. 진입기준/손절기준
- 진입기준; 시그널을 따릅니다.
- 손절기준;
고정손절가 이용 : 시그널 발생으로부터 1% 고정 손절가 구간을 설정합니다.(%는 개별로 설정)
캔들손절가 이용 : 시그널 발생봉의 저점이나 고점이 무너지면 손절을 설정합니다.
흐름손절가 이용 : 파동의 흐름을 고려하여 손절을 설정합니다.
3. 참고
귀하가 내리는 모든 거래 결정은 전적으로 귀하의 책임입니다.
지표가 도움이 되었다면 응원 부탁드립니다. 다음 지표 개발에 도움이 됩니다.
4. 사용방법
즐겨찾기에 인디케이터 넣기를 누릅니다. 차트화면 상단에 지표를 눌러서 왼쪽탭에 보면
지표가 추가되어 있습니다. 눌러서 사용합니다. 누구나 사용할 수 있습니다.
Dilip Trend Finding 2.0This is based on the Trend Finding Indicator.
The PC is originally taken as the change between the current price - the previous price. I substituted that with Rate of Change . Using a 1 period ROC it's quite similar to the Trend Finding Indicator and increasing the length results in a smoother Trend Finding Indicator.
I hope it helps,
Note: Since Trend Finding Indicator amounts vary across the board. The background height is set to readjust based on the highest bars. This lookback amount is adjustable by the user and it does not affect calculations what so ever.
I find, with the standard settings, it works best on the 1 hour timeframe as shown, but again, can be used on any time frame.
For access, send me a DM on TradingView

Highest high, Lowest low and Trend, MACD, RSI on CandlesticksHighest high, Lowest low and Trend, MACD, RSI on Candlesticks

Traders TrendTrader's Trend
This indicator basicly using 4 different calculations average.
And you can see this average as line on this script.
This Script has 2 functions
1. Buy and Sell Strategy
-İf the line colored BLUE this means you can BUY
-İf the line colored RED this means you can SELL
2. Support and Resistance Function
You can use the line as resistance and support.

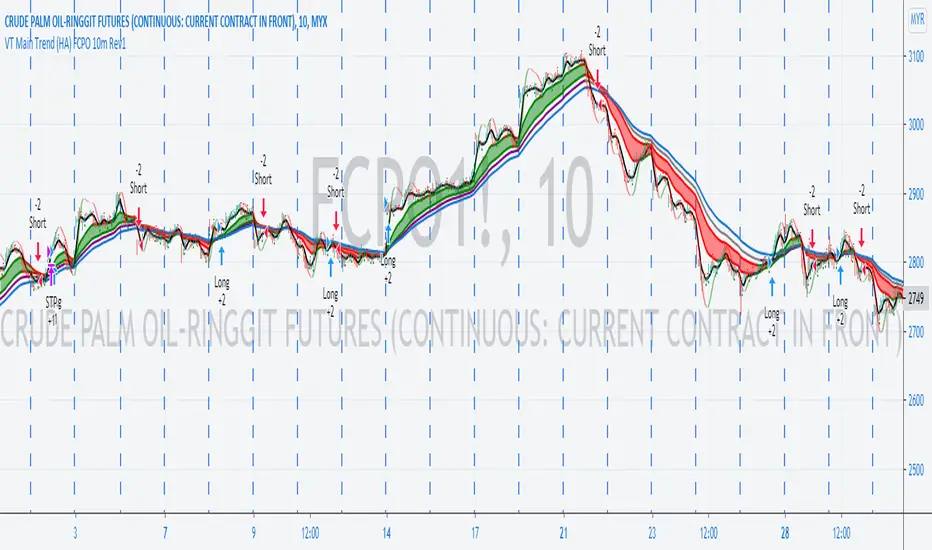
VT Main Trend (HA) FCPO 10 Minutes StrategyDescription of Victory Trend With Heikin Ashi Color's items. The Buy Sell strategy is based on the Main Trend item only and user required to input the related commission for different product.
This scritp also allow User to alter the Main Trend parameter for get better result when test at different products and different time frame.
VT Trend With Heikin Ashi Color indicator is formed by Green & Red Main Trend Band, Secondary Band, 4 days HLC Black color line, Mid Term line (Purple & Gray Color Line and Long Term Blue line. Green up arrow with "Buy" text and Red Down Arrow with "sell" text for alert the potential entry chances.
1) Green color Up Trend Main Trend Band with solid line : form by 2 moving average lines and in green color when fast moving average is above slow moving average line
2) Red Color Down Trend Main Trend Band with solid line form by 2 moving average lines and in red color when fast moving average is below slow moving average line
3) Green Up arrow with "buy" text appear : When red color down Trend Main Trend Band with solid line turn from red color to green color, mean potential buy entry
4) Red down arrow with "Sell" text appear : When green color up Trend Main Trend Band with solid line turn from Green color to red color, mean potential Sell entry
5) Black color line = 4 days HLC line
6) Mid term line = Purple color (when up) and gray color (when down)
7) Long term line = Coastal (Light blue) color
8) Stronger Up trend start = When Mid term line cross up Long term line
9) Stronger down trend start = When Mid term line cross down Long term line
10)Background color which represent the Up/down trend and stronger Up/down trend ,
a) lighten Green = Main trend in uptrend but Main trend's slow moving average line haven't cross up mid term line
b) Green =Main trend in uptrend and Main trend's slow moving average line had cross up mid term line
c) lighten Red = Main trend in down trend but Main trend's slow moving average line haven't cross down mid term line
d) Red = Main trend in down trend and Main trend's slow moving average line had cross down mid term line
11) When Up green color triangle appear: mean the candlestick closing price is cross up Black color line (4 days HLC line) & price have potential continue up in short term
When Down Red color triangle appear: mean the candlestick closing price is cross down Black color line (4 days HLC line) & price have potential continue down in short term
12) Green color Up Trend Secondary Trend Band with solid line : form by 2 moving average lines and in green color when fast moving average is above slow moving average line
13) Red Color Down Trend Secondary Trend Band with solid line form by 2 moving average lines and in red color when fast moving average is below slow moving average line
Buy entry strategy No.1:
When Green arrow with "Buy" text appear and wait for the candlestick closed, and enter buy position on next candlestick .
Cut Loss exit: When Main trend turn into red color with Red down Arrow with "sell" text appear.
Target price no.1 : For hold over night. To close position When for Main trend turn into red color band and Red down Arrow with "sell" text appear.
Target price no.2 : For Intraday trade. To close position When price close below the black line
Buy entry strategy No.2:
After green up arrow appear and to add more position when Mid term purple line cross up Long term Blue line.
Cut Loss exit: When Main trend turn into red color with Red down Arrow with "sell" text appear.
Target price no.1 : For hold over night. To close position When for Main trend turn into red color band and Red down Arrow with "sell" text appear.
Target price no.2 : For Intraday trade. To close position When price close below the black line
Sell entry strategy No.1:
When Red arrow with "Sell" text appear and wait for the candlestick closed, and enter sell position on next candlestick .
Cut Loss exit: When Main trend turn into green color with green Up Arrow with "buy" text appear.
Target price no.1 : For hold over night. To close position When for Main trend turn into green color band and green Up Arrow with "Buy" text appear.
Target price no.2 : For Intraday trade. To close position When price close up the black line
Sell entry strategy No.2:
After Red Down arrow appear and to add more position when Mid term Gray color line cross down Long term Blue line.
Cut Loss exit: When Main trend turn into green color with green Up Arrow with "buy" text appear.
Target price no.1 : For hold over night. To close position When for Main trend turn into green color band and green Up Arrow with "Buy" text appear.
Target price no.2 : For Intraday trade. To close position When price close up the black line
"Use the link below to contact Owner for obtain access to this indicator"
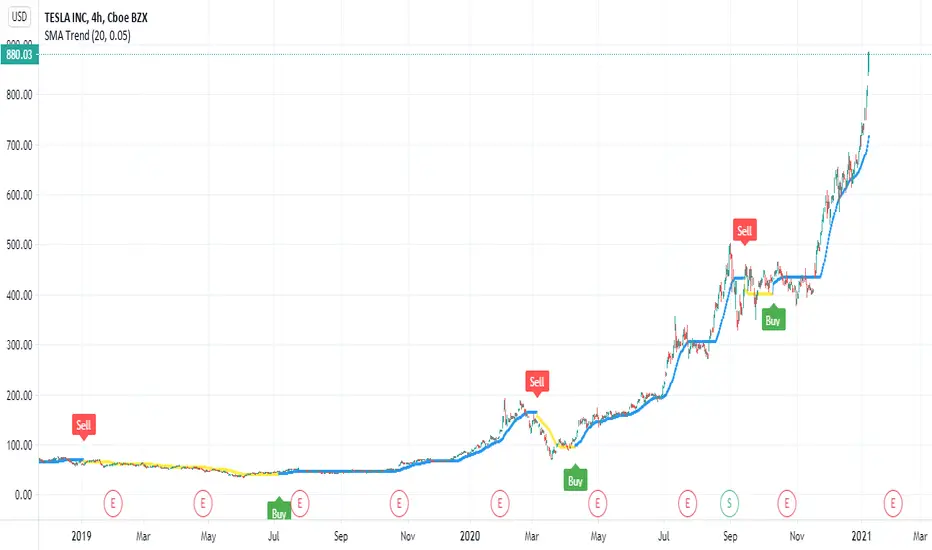
SMA TrendThis is SMA based trend with some twist . you can control it via length of the SMA currently set to 20 or by factor that control sensitivity set 0.05 and you can change it to any value that you like
the indicator have signal and alerts
blue line is uptrend
yellow line is down trend
I try to optimize it for stocks but it can work on any asset that you like ' probably need to change settings
btc
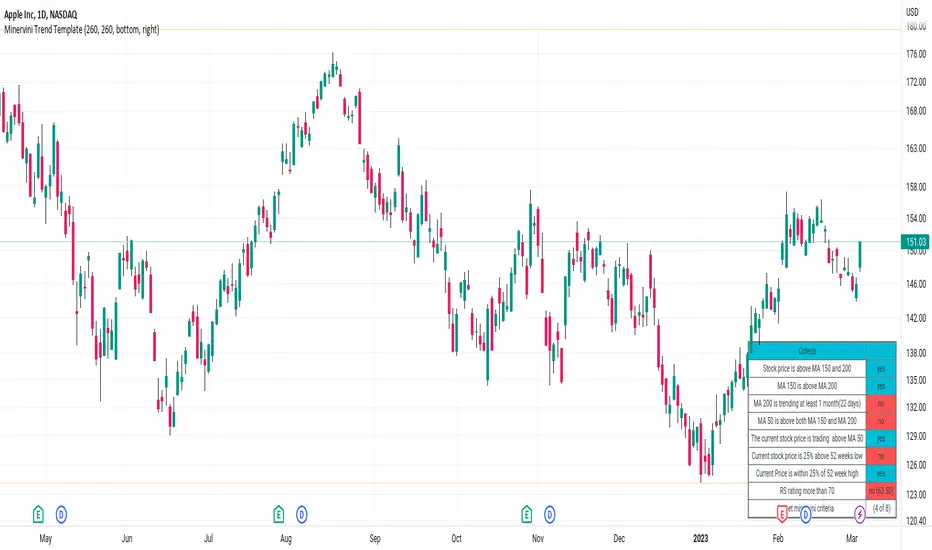
Minervini Trend TemplateMinervini Trend Template
1. Stock price is above MA 150 and 200
2. MA 150 is above MA 200
3. MA 200 is trending at least 1 month(22 days)
4. MA 50 is above both MA 150 and MA 200
5. Current stock price is 25% above 52 weeks low
6. Current Price is within 25% of 52 week high
7. RS Ratings
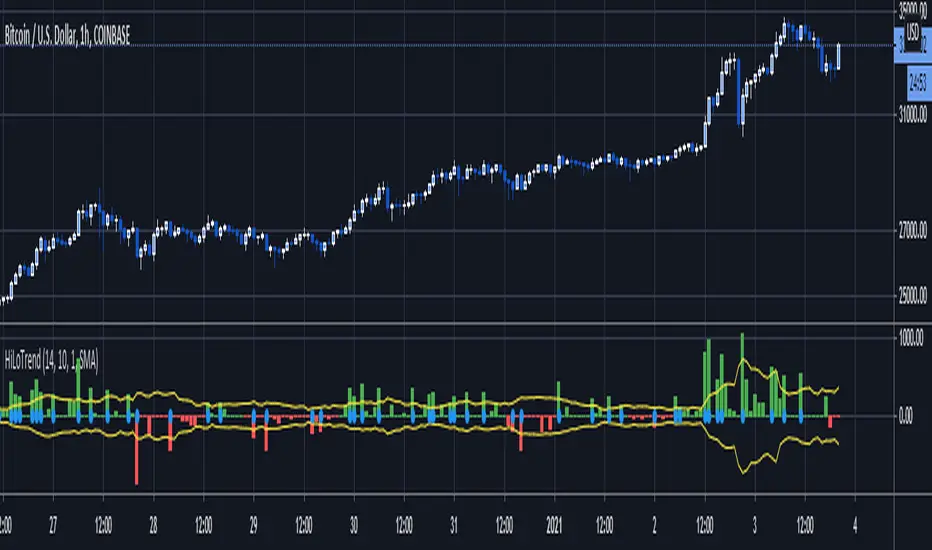
Hi-Lo TrendThis script uses the most recent low/high and candle size to determine trend breakouts.
The trend is determined buy whether the most recent price extreme within the Lookback period is a high or low. If it is a most recent high, it is an uptrend, if it is a lwo, a downtrend.
Bands are created using the average absolute difference of current minus previous close over the MABandPeriod, multiplied by the MABandMultiplier.
If the current close minus previous close is above/below the band, then a blue dot is painted and it is a breakout.
a buy alert fires when a downtrend becomes an uptrend and a breakout above the bands happens.
A sell alert fires when an uptrend becomes a downtrend and a breakout below the bands happns.
VT Main Trend (HA) StrategyDescription of Victory Trend With Heikin Ashi Color's items. The Buy Sell strategy is based on the Main Trend item only and user required to input the related commission for different product.
This scritp also allow User to alter the Main Trend parameter for get better result when test at different products and different time frame.
VT Trend With Heikin Ashi Color indicator is formed by Green & Red Main Trend Band, Secondary Band, 4 days HLC Black color line, Mid Term line (Purple & Gray Color Line and Long Term Blue line. Green up arrow with "Buy" text and Red Down Arrow with "sell" text for alert the potential entry chances.
1) Green color Up Trend Main Trend Band with solid line : form by 2 moving average lines and in green color when fast moving average is above slow moving average line
2) Red Color Down Trend Main Trend Band with solid line form by 2 moving average lines and in red color when fast moving average is below slow moving average line
3) Green Up arrow with "buy" text appear : When red color down Trend Main Trend Band with solid line turn from red color to green color, mean potential buy entry
4) Red down arrow with "Sell" text appear : When green color up Trend Main Trend Band with solid line turn from Green color to red color, mean potential Sell entry
5) Black color line = 4 days HLC line
6) Mid term line = Purple color (when up) and gray color (when down)
7) Long term line = Coastal (Light blue) color
8) Stronger Up trend start = When Mid term line cross up Long term line
9) Stronger down trend start = When Mid term line cross down Long term line
10)Background color which represent the Up/down trend and stronger Up/down trend ,
a) lighten Green = Main trend in uptrend but Main trend's slow moving average line haven't cross up mid term line
b) Green =Main trend in uptrend and Main trend's slow moving average line had cross up mid term line
c) lighten Red = Main trend in down trend but Main trend's slow moving average line haven't cross down mid term line
d) Red = Main trend in down trend and Main trend's slow moving average line had cross down mid term line
11) When Up green color triangle appear: mean the candlestick closing price is cross up Black color line (4 days HLC line) & price have potential continue up in short term
When Down Red color triangle appear: mean the candlestick closing price is cross down Black color line (4 days HLC line) & price have potential continue down in short term
12) Green color Up Trend Secondary Trend Band with solid line : form by 2 moving average lines and in green color when fast moving average is above slow moving average line
13) Red Color Down Trend Secondary Trend Band with solid line form by 2 moving average lines and in red color when fast moving average is below slow moving average line
Buy entry strategy No.1:
When Green arrow with "Buy" text appear and wait for the candlestick closed, and enter buy position on next candlestick .
Cut Loss exit: When Main trend turn into red color with Red down Arrow with "sell" text appear.
Target price no.1 : For hold over night. To close position When for Main trend turn into red color band and Red down Arrow with "sell" text appear.
Target price no.2 : For Intraday trade. To close position When price close below the black line
Buy entry strategy No.2:
After green up arrow appear and to add more position when Mid term purple line cross up Long term Blue line.
Cut Loss exit: When Main trend turn into red color with Red down Arrow with "sell" text appear.
Target price no.1 : For hold over night. To close position When for Main trend turn into red color band and Red down Arrow with "sell" text appear.
Target price no.2 : For Intraday trade. To close position When price close below the black line
Sell entry strategy No.1:
When Red arrow with "Sell" text appear and wait for the candlestick closed, and enter sell position on next candlestick .
Cut Loss exit: When Main trend turn into green color with green Up Arrow with "buy" text appear.
Target price no.1 : For hold over night. To close position When for Main trend turn into green color band and green Up Arrow with "Buy" text appear.
Target price no.2 : For Intraday trade. To close position When price close up the black line
Sell entry strategy No.2:
After Red Down arrow appear and to add more position when Mid term Gray color line cross down Long term Blue line.
Cut Loss exit: When Main trend turn into green color with green Up Arrow with "buy" text appear.
Target price no.1 : For hold over night. To close position When for Main trend turn into green color band and green Up Arrow with "Buy" text appear.
Target price no.2 : For Intraday trade. To close position When price close up the black line
"Use the link below to contact Owner for obtain access to this indicator"

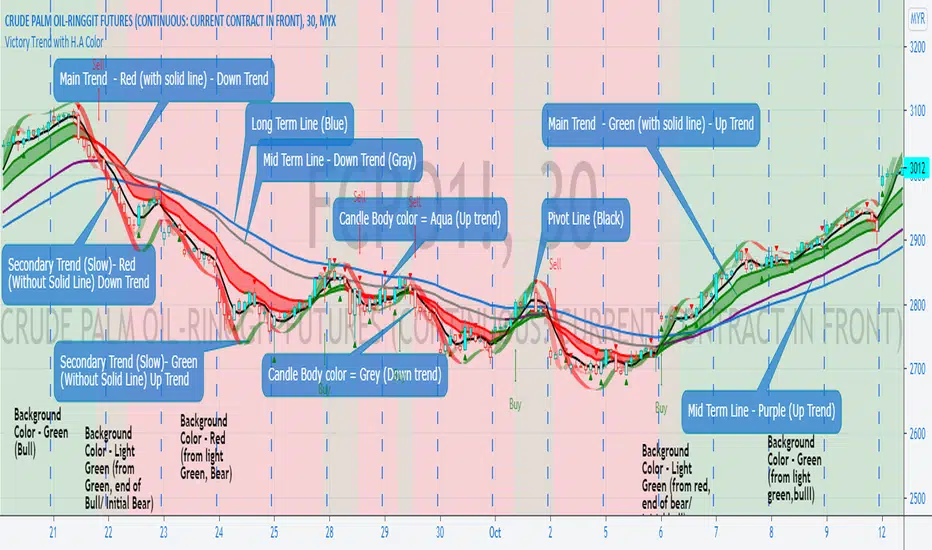
Victory Trend with H.A ColorDescription of Victory Trend With Heikin Ashi Color's items
VT Trend With Heikin Ashi Color indicator is formed by Green & Red Main Trend Band, Secondary Band, 4 days HLC Black color line, Mid Term line (Purple & Gray Color Line and Long Term Blue line. Green up arrow with "Buy" text and Red Down Arrow with "sell" text for alert the potential entry chances.
1) Green color Up Trend Main Trend Band with solid line : form by 2 moving average lines and in green color when fast moving average is above slow moving average line
2) Red Color Down Trend Main Trend Band with solid line form by 2 moving average lines and in red color when fast moving average is below slow moving average line
3) Green Up arrow with "buy" text appear : When red color down Trend Main Trend Band with solid line turn from red color to green color, mean potential buy entry
4) Red down arrow with "Sell" text appear : When green color up Trend Main Trend Band with solid line turn from Green color to red color, mean potential Sell entry
5) Black color line = 4 days HLC line
6) Mid term line = Purple color (when up) and gray color (when down)
7) Long term line = Coastal (Light blue) color
8) Stronger Up trend start = When Mid term line cross up Long term line
9) Stronger down trend start = When Mid term line cross down Long term line
10)Background color which represent the Up/down trend and stronger Up/down trend ,
a) lighten Green = Main trend in uptrend but Main trend's slow moving average line haven't cross up mid term line
b) Green =Main trend in uptrend and Main trend's slow moving average line had cross up mid term line
c) lighten Red = Main trend in down trend but Main trend's slow moving average line haven't cross down mid term line
d) Red = Main trend in down trend and Main trend's slow moving average line had cross down mid term line
11) When Up green color triangle appear: mean the candlestick closing price is cross up Black color line (4 days HLC line) & price have potential continue up in short term
When Down Red color triangle appear: mean the candlestick closing price is cross down Black color line (4 days HLC line) & price have potential continue down in short term
12) Green color Up Trend Secondary Trend Band with solid line : form by 2 moving average lines and in green color when fast moving average is above slow moving average line
13) Red Color Down Trend Secondary Trend Band with solid line form by 2 moving average lines and in red color when fast moving average is below slow moving average line
Buy entry strategy No.1:
When Green arrow with "Buy" text appear and wait for the candlestick closed, and enter buy position on next candlestick .
Cut Loss exit: When Main trend turn into red color with Red down Arrow with "sell" text appear.
Target price no.1 : For hold over night. To close position When for Main trend turn into red color band and Red down Arrow with "sell" text appear.
Target price no.2 : For Intraday trade. To close position When price close below the black line
Buy entry strategy No.2:
After green up arrow appear and to add more position when Mid term purple line cross up Long term Blue line.
Cut Loss exit: When Main trend turn into red color with Red down Arrow with "sell" text appear.
Target price no.1 : For hold over night. To close position When for Main trend turn into red color band and Red down Arrow with "sell" text appear.
Target price no.2 : For Intraday trade. To close position When price close below the black line
Sell entry strategy No.1:
When Red arrow with "Sell" text appear and wait for the candlestick closed, and enter sell position on next candlestick .
Cut Loss exit: When Main trend turn into green color with green Up Arrow with "buy" text appear.
Target price no.1 : For hold over night. To close position When for Main trend turn into green color band and green Up Arrow with "Buy" text appear.
Target price no.2 : For Intraday trade. To close position When price close up the black line
Sell entry strategy No.2:
After Red Down arrow appear and to add more position when Mid term Gray color line cross down Long term Blue line.
Cut Loss exit: When Main trend turn into green color with green Up Arrow with "buy" text appear.
Target price no.1 : For hold over night. To close position When for Main trend turn into green color band and green Up Arrow with "Buy" text appear.
Target price no.2 : For Intraday trade. To close position When price close up the black line
"Use the link below to contact Owner for obtain access to this indicator"
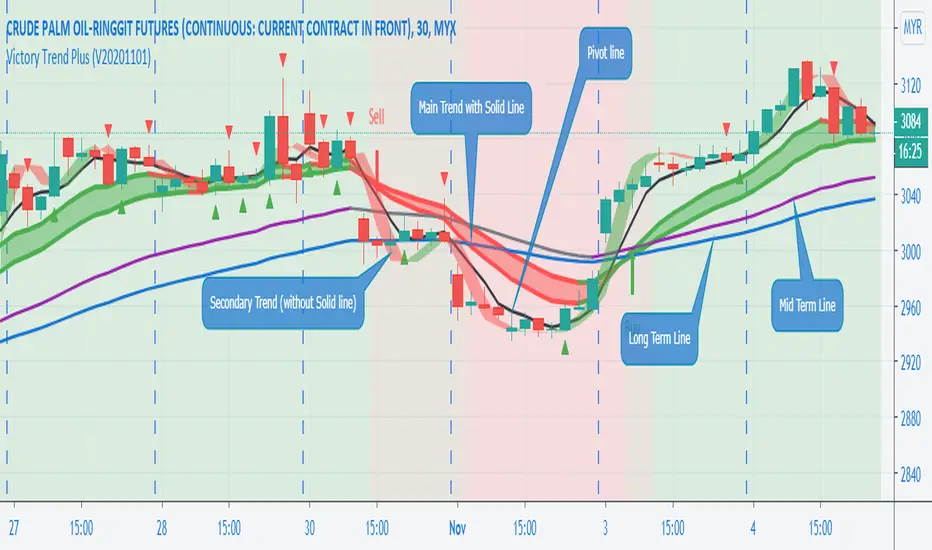
Victory Trend Plus (V20201101)Description of Victory Trend Plus's items
VT Trend indicator is formed by Green & Red Main Trend Band, Secondary Band, 4 days HLC Black color line, Mid Term line (Purple & Gray Color Line and Long Term Blue line. Green up arrow with "Buy" text and Red Down Arrow with "sell" text for alert the potential entry chances.
1) Green color Up Trend Main Trend Band with solid line : form by 2 moving average lines and in green color when fast moving average is above slow moving average line
2) Red Color Down Trend Main Trend Band with solid line form by 2 moving average lines and in red color when fast moving average is below slow moving average line
3) Green Up arrow with "buy" text appear : When red color down Trend Main Trend Band with solid line turn from red color to green color, mean potential buy entry
4) Red down arrow with "Sell" text appear : When green color up Trend Main Trend Band with solid line turn from Green color to red color, mean potential Sell entry
5) Black color line = 4 days HLC line
6) Mid term line = Purple color (when up) and gray color (when down)
7) Long term line = Coastal (Light blue) color
8) Stronger Up trend start = When Mid term line cross up Long term line
9) Stronger down trend start = When Mid term line cross down Long term line
10)Background color which represent the Up/down trend and stronger Up/down trend ,
a) lighten Green = Main trend in uptrend but Main trend's slow moving average line haven't cross up mid term line
b) Green =Main trend in uptrend and Main trend's slow moving average line had cross up mid term line
c) lighten Red = Main trend in down trend but Main trend's slow moving average line haven't cross down mid term line
d) Red = Main trend in down trend and Main trend's slow moving average line had cross down mid term line
11) When Up green color triangle appear: mean the candlestick closing price is cross up Black color line (4 days HLC line) & price have potential continue up in short term
When Down Red color triangle appear: mean the candlestick closing price is cross down Black color line (4 days HLC line) & price have potential continue down in short term
12) Green color Up Trend Secondary Trend Band with solid line : form by 2 moving average lines and in green color when fast moving average is above slow moving average line
13) Red Color Down Trend Secondary Trend Band with solid line form by 2 moving average lines and in red color when fast moving average is below slow moving average line
Buy entry strategy No.1:
When Green arrow with "Buy" text appear and wait for the candlestick closed, and enter buy position on next candlestick .
Cut Loss exit: When Main trend turn into red color with Red down Arrow with "sell" text appear.
Target price no.1 : For hold over night. To close position When for Main trend turn into red color band and Red down Arrow with "sell" text appear.
Target price no.2 : For Intraday trade. To close position When price close below the black line
Buy entry strategy No.2:
After green up arrow appear and to add more position when Mid term purple line cross up Long term Blue line.
Cut Loss exit: When Main trend turn into red color with Red down Arrow with "sell" text appear.
Target price no.1 : For hold over night. To close position When for Main trend turn into red color band and Red down Arrow with "sell" text appear.
Target price no.2 : For Intraday trade. To close position When price close below the black line
Sell entry strategy No.1:
When Red arrow with "Sell" text appear and wait for the candlestick closed, and enter sell position on next candlestick .
Cut Loss exit: When Main trend turn into green color with green Up Arrow with "buy" text appear.
Target price no.1 : For hold over night. To close position When for Main trend turn into green color band and green Up Arrow with "Buy" text appear.
Target price no.2 : For Intraday trade. To close position When price close up the black line
Sell entry strategy No.2:
After Red Down arrow appear and to add more position when Mid term Gray color line cross down Long term Blue line.
Cut Loss exit: When Main trend turn into green color with green Up Arrow with "buy" text appear.
Target price no.1 : For hold over night. To close position When for Main trend turn into green color band and green Up Arrow with "Buy" text appear.
Target price no.2 : For Intraday trade. To close position When price close up the black line
"Use the link below to contact Owner for obtain access to this indicator"
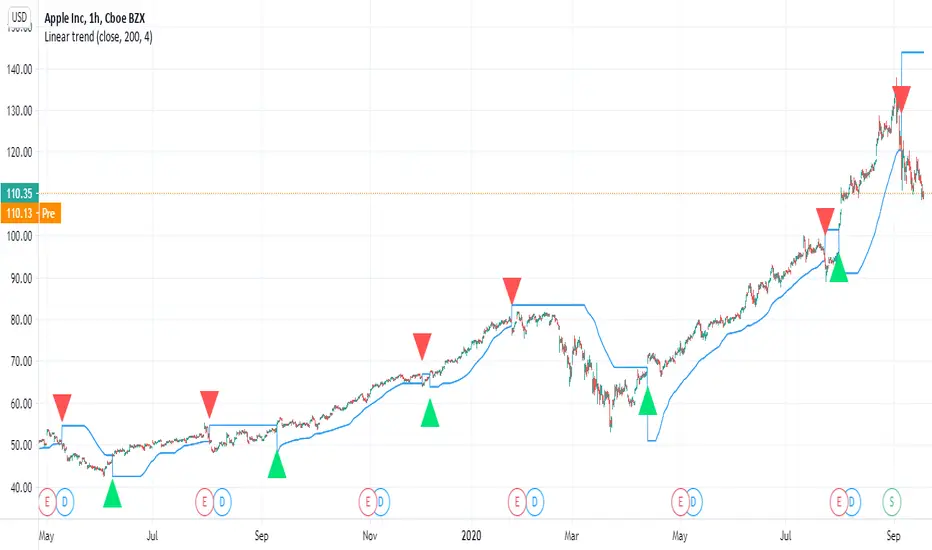
Linear trendBy request of a user
I just put this indicator which is a linear regression that work on same logic as super trend
the control is by length (len) and the deviation
there is alerts and signals
try to find best settings according to your needs
it can done in a different way as well
this one seems to work nice on stocks
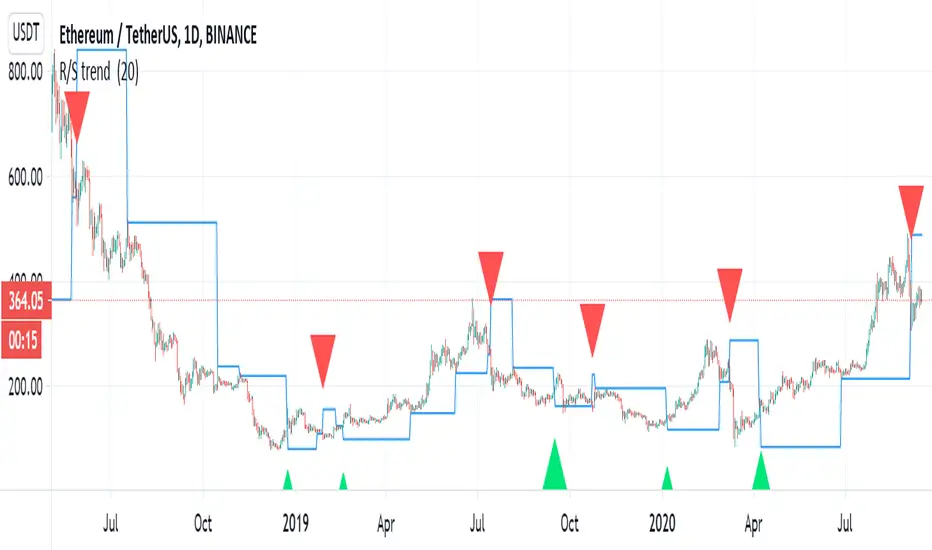
R/S trend my stupid country go to lockdown again due to covid 19, so at least i can play with some scripts:)
This is not super trend but by the same logic, we can make a trend based on support and resistance.
r =length so if you want it to buy more make it shorter or vice versa
alerts inclusded plus signals
the trend based o finding highest high and lowest low
i hope you like this one
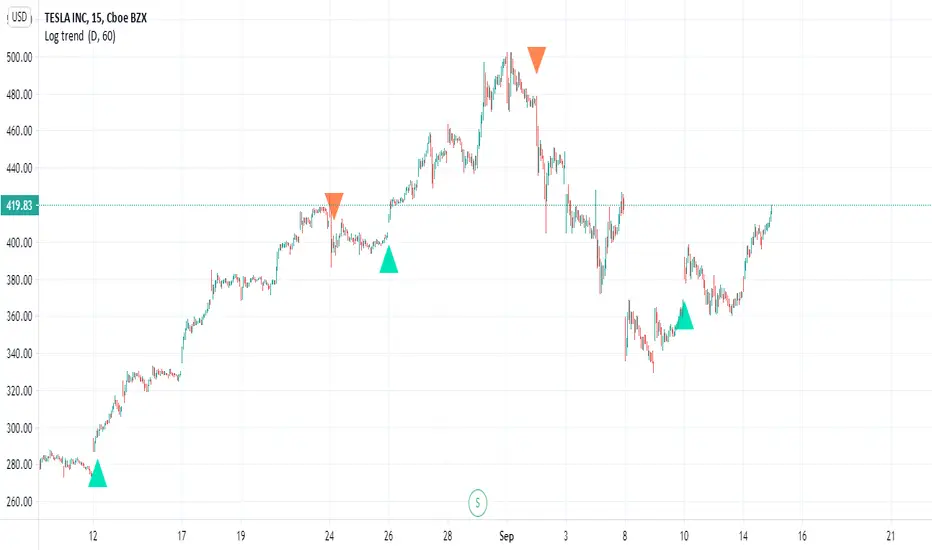
tesla
Log trend Very nice Log trend with alerts, signals
this version is MTF version with no repaint
i just took the logic of a super trend and converted it to a log type trend
you will find in menue (MTF - this for control of trend up or down)
HTF (no security type ) for close
try to play with either to find best settings
alerts are activated by alerts menue
RSI SUPER TREND V1very simple script of RSI super trend based on super trend V
(can be found in my open scripts
buy period is green
sell period is red
you can change length by min time (now set to 240 min)
you can change output by RSI length or the supertrend ATR
very easy to add signal or alert to it
i may do it later

cardi - trend followingTrading strategy tries to get involved in trends at the beginning in the low time frame. Instead of staying flat, the statistical components in the algorithm help strategy to stay in the trend as long as it predicts that buyers or sellers will continue to profit.
Backtest is calculated by using 10% of equity and 0.075% market fee is defined as default. Commission may differ depending on the preferred exchange to trade.
PM us to obtain access.

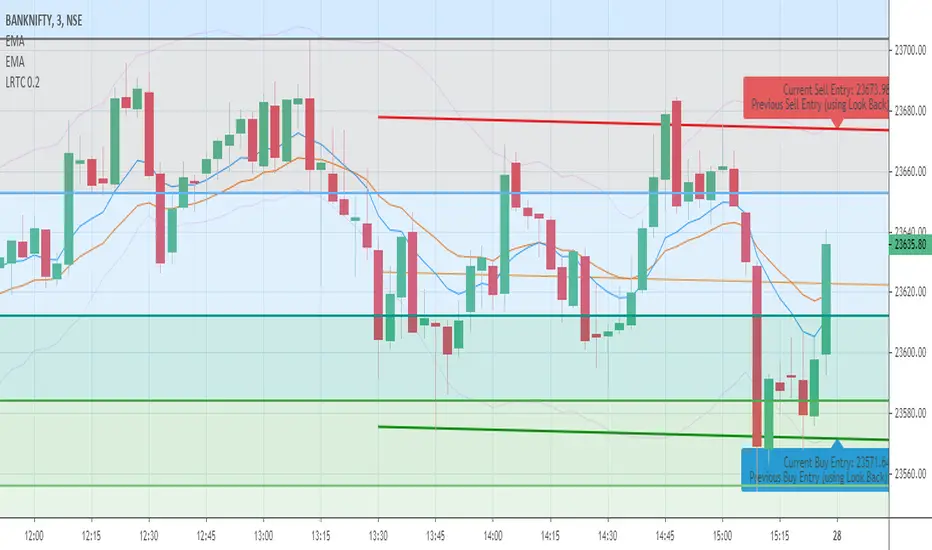
Linear Regression Trend Channel with Entries & Alerts-vinayLinear Regression Trend Channel with Entries & Alerts-vinay
Profit Accumulator Trend IndicatorTREND INDICATOR (PATC)
This is a support indicator to the Main Indicator which has also been published.
This indicator uses a number of tools to assess for trend direction and where to place Take Profit and Stop Loss points. There are no alerts with this indicator.
I've been using this successfully on the one hour FX charts, but seems to work equally as well on higher or lower time frames (not less than 15min).
This indicator has a number of tools in the settings that can be used to assist with trading. This includes
Multi-Timeframe Support and Resistance points. The thicker the line is, the greater the timeframe that youre dealing with. In the 1hr chart on this script, the S&R is set at 1hr, 4hr and 1D time periods.
Trend Direction points. Note that these have a massive tendency to repaint, however when used with something like Bollinger Bands (as in the Main Indicator) you can identify turning points (i.e. when the close of the candle is at the upper or lower boundary levels).
Risk Management provides a high level tool for managing money based on relative ATR multiplier points.
The other indicators which are part of the suite are shown on the website which is highlighted in my signature at the bottom of the page. Purchase of the main indicator gives access to the full suite of eight indicators. I use the other indicators to confirm the direction of the trade and to determine if I want to trade or not. I use it along with the 2min, 15min and 4hr timeframes to identify the best entry window and how long I'm likely to be in the trade.
Support can be provided via private message or in the comments below.
The links are provided below for access to the indicator.

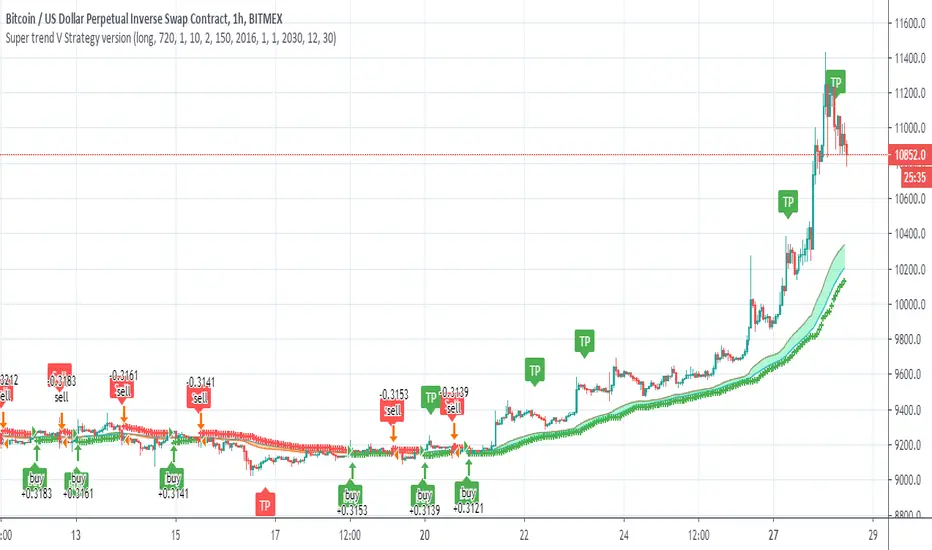
Super trend V Strategy versionThis is the strategy of Super trend V indicator
it not calculating the TP points which can make it much more proftible in theory
just the buy and sell of the super trend
youy can choose long only
short only
or both directions