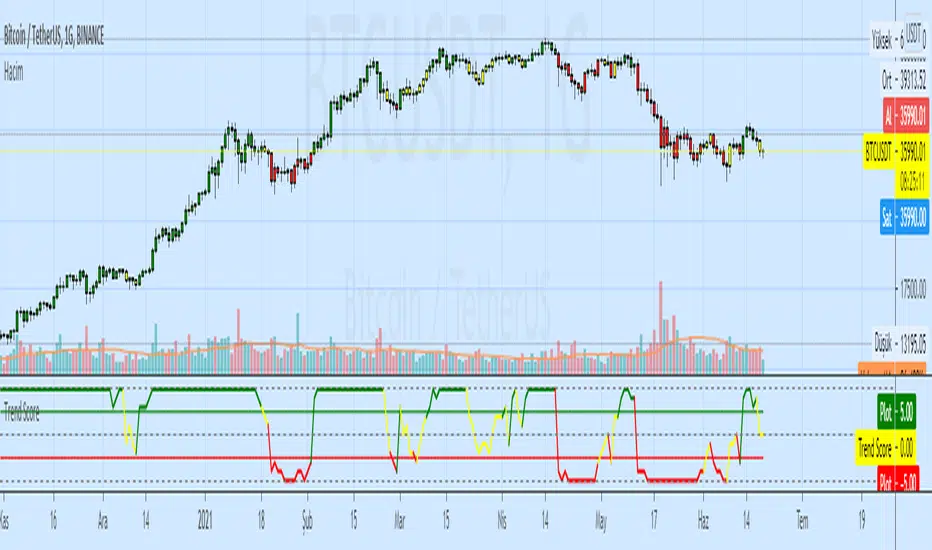
Trend MeterUse as a supplementary Indicator to confirm your entries, but it is as good on it's own.
When you first apply the indicator to your chart make sure you shrink it down It looks a lot better that way
The indicator consists of 3 different Trend Meters and a Trend Bar which are used to confirm trend
As a bonus Possible Momentum Setup entries based on Stochastics are marked as well, these are very Powerful however please use with caution
How to Use
The more Trend meters are lit up the better
Look for Support or Resistance Levels for price to be attracted to
Find confluence with other indicators
Enter Long above the Setup Bar
Enter Short Below the Setup Bar
在腳本中搜尋"trend"

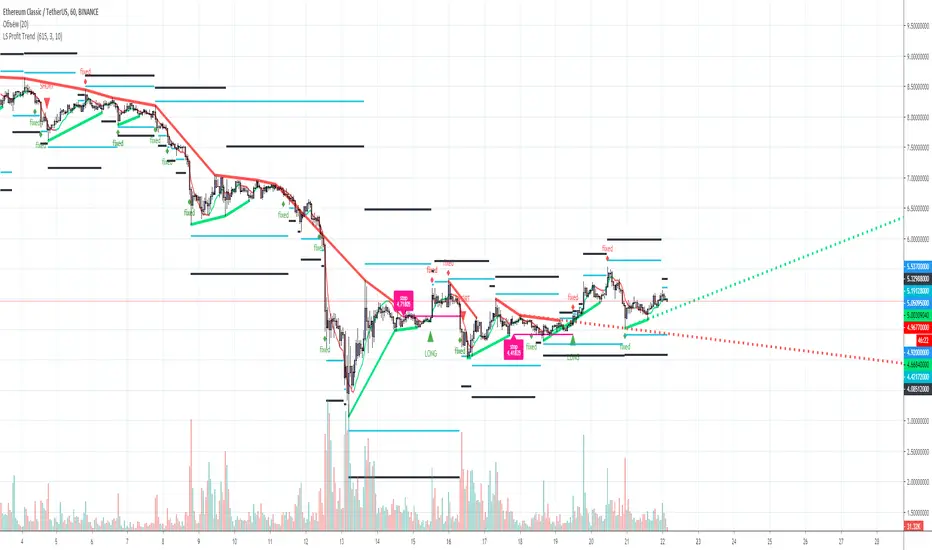
L&S PROFIT TREND Trend indicator for TF from 1 hour and above, for any trading pair, any exchange, binary options. Signals+ Take profit levels. 90% good signal and take profit 1.
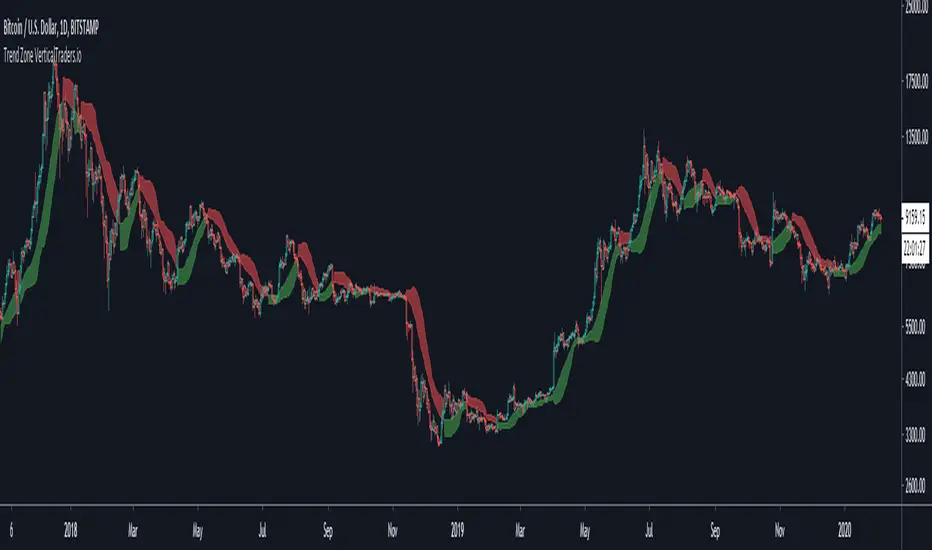
Trend ZoneTrend Zone
- Shows the risk areas to continue in a trend
- Trend Indicator for Long and Short entries
- It can be used as a trend indicator or as a trailing stop loss
- Long and Short Labels and Alerts
- Configurable in Periods and the type of MA for the calculation
Trend ProTrend Pro
- Trend Indicator for Long and Short entries
- It can be used as a trend indicator or as a trailing stop loss
- Long and Short Labels and Alerts
- Configurable in volatility values and periods

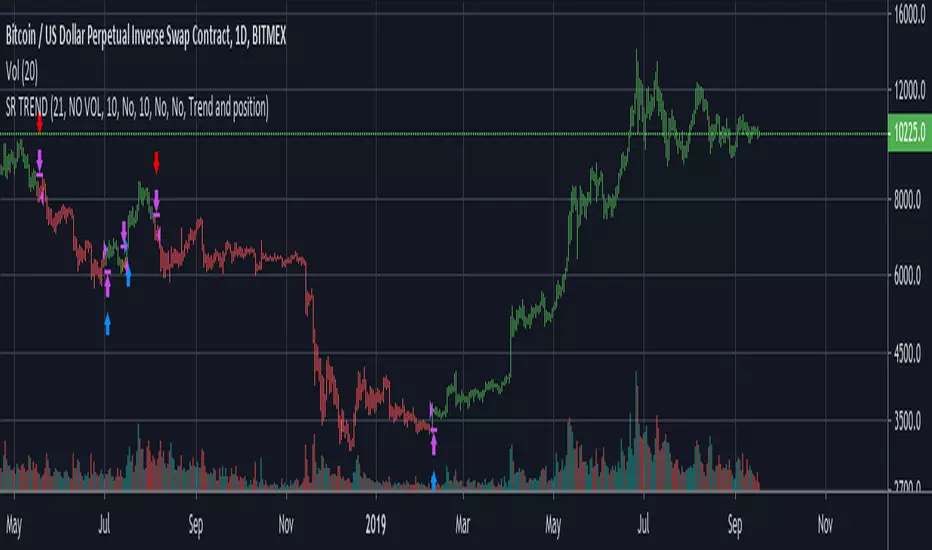
Trend SR based strategyIt is a logical continuation of my Trend SR based indicator
Algo of strategy is next
1)Detect SR levels
2)Calculate separate channels for SR made by highs and lows
3)it takes position if the current SR is breaking and close price is not in opposite channel zone
4)It closes position if prise leave current channel zone or as an option (stoploss) if SR is breaking in an opposite direction
-uses //@version=4
-no volume needed for detecting SR breaking and entering a long position
-volume confirmation of SR breaking may be used in the option section
-volume has an option to use smoothing with MA: SMA, AHMA, VIDYA
-volume has option to use volume pump as confirmation of SR breaking (simple dev function)
-stoploss as option
-uses barstate.isconfirmed (returns true if the script is calculating the last (closing) update of the current bar) for entering position on current bar close
-as an option, all or only current SR levels detected by algo can be plotted
-option to plot SR as a channel - as FILTERED whole SR history, in a long or short position it plots only stoploss level and entering opposite position level, in no position it plots long and short entering levels
It works well on 1D
For using on 4h or lower timeframes - Volume confirmation with VIDYA or AHMA may give better results
For better work especially on LTF algo needs better detection of highs and lows, now it uses fractal filter of last bars

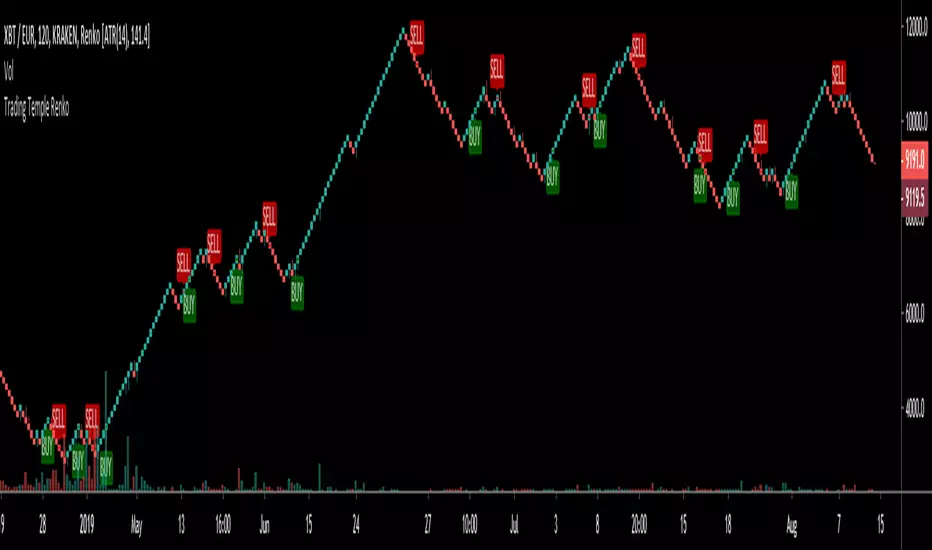
Trading Temple Trend Tracker Renko v1Trend Tracker to be used for trades following the current trend.
To be used with Renko bricks based on ATR and intraday charts (below 1D)
Trend Lines by VolumeA variant of the Trend Lines indicator; this one relies on volume highs and lows to dictate the trend.

trend analysisdaily trade call on the basis of trend analysis
this is a beta version hence use at ur own risk

MultiTF Trend BiasTrend Bias based on 12 time frames.
Should be used on the lowest time frame (1 minute)

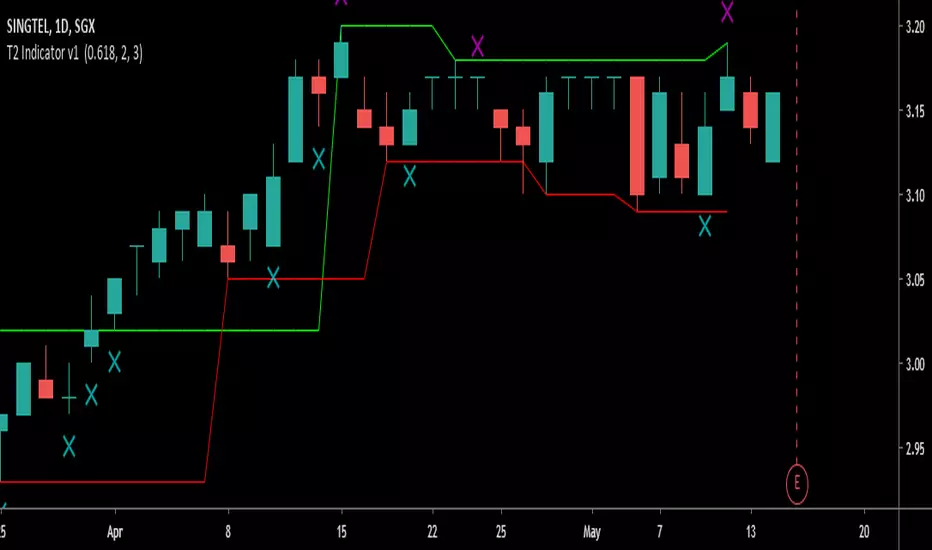
Trend Tracking Indicator v1The Purpose of this Script is to help the user track the trend by
1) Defining clearly Entry and Exit levels
2) Profit Protection Levels
3) Stay in a trend as long as possible
It automatically draws and updates the boxes dynamically as the trend progresses in Stair Stepping Behaviour in uptrend or downtrend
a) Darvas Box (5 Bar System)
b) Fractal Boxes (5 bar System)
There is a switch at the indicator interface for user to choose between Fractal or Darvas boxes to better represent the stock/Crypto/Commodity/Forex
pair the user is trading.
In the event that the trend gears up and runs up in a parabolic behaviour
Alternate Profit Protection Levels based on 2 Bar System is there to provide an alternative to tracking the trend and protecting profits.
In general being a price action indicator, it can apply to any assets or timeframe.
by Crypto DanX.

Trend TraderSummary:
Based on the script by Chris Moody. Using HLC3 candles and a default of 50EMA, changes candle colours to determine buy or sell signals.
How it works:
- When the candle closes above the 50EMA, the candle will turn green, open a long (close a short).
- When the candle closes below the 50EMA, the candle will turn red, open a short (close a long).
Quite a conservative strategy, not for day trading. Comes into it's own in trending markets as long as you stick to the signals. Is definitely not for knife catching.
Trade with momentum and set take profits.
I've used it with success on 1D and 4H timeframes.
Use the green and red crossover lines to set alerts when the candle closes (can be automated pretty easily with AutoView).

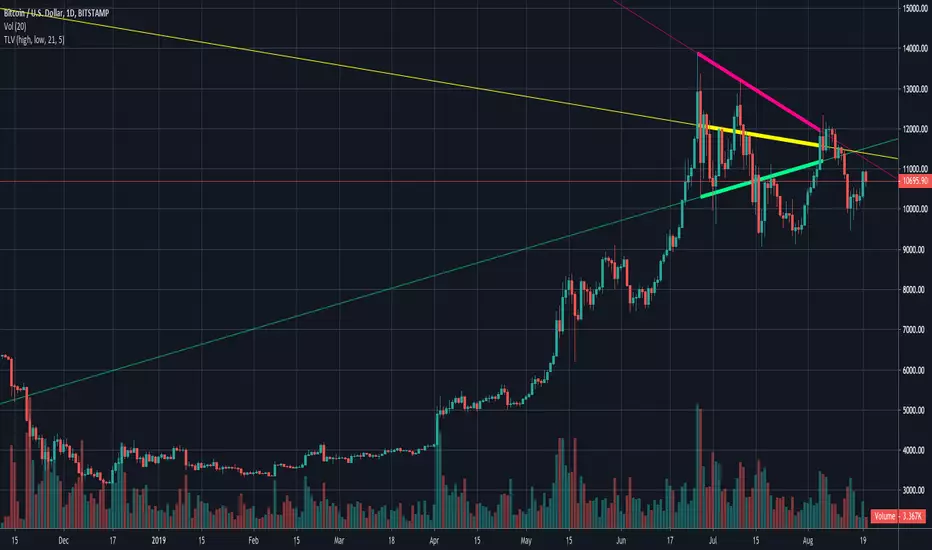
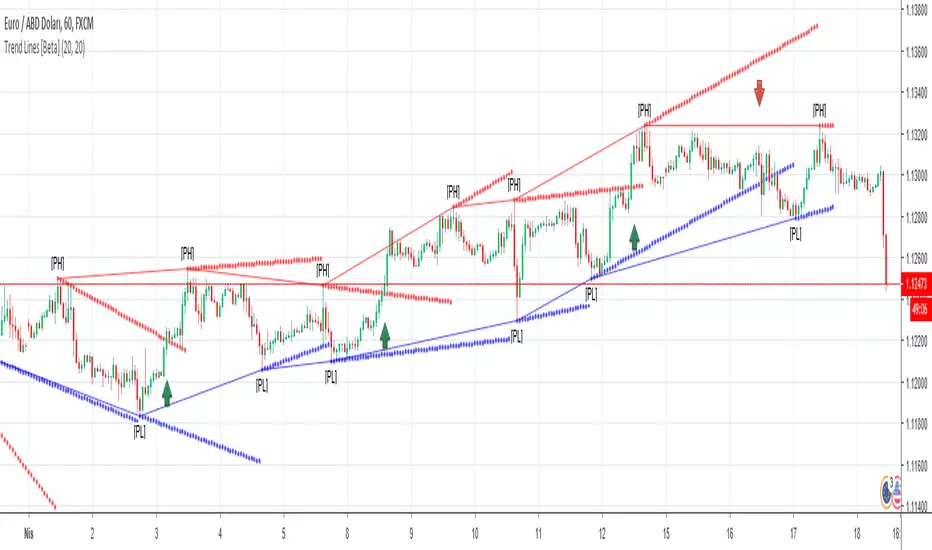
Trend Lines [Beta version]This script finds Pivot high and Pivot low points according to parameters left bar and right bar and then draws trend lines. with this you can see the trend and trend reversals.
This is beta version, please do not hesitate to add comments.
If you find my works useful, please consider a donation
BTC: 16XRqyS3Vgh1knAU1tCcruqhUrVm4QWWmR
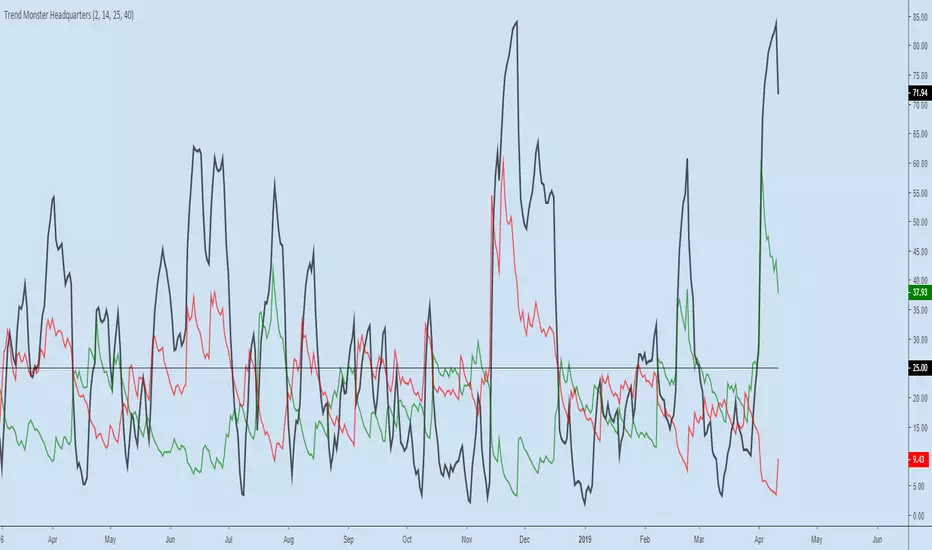
Trend Monster HeadquartersADX-DMI enhanced & modified for faster reaction
ADX (black line) above 80 = mega-trend peaked, reversal imminent, rare case scenario
ADX (black line) above 60 = trend topping out, reversal possible, depending on other indicators
ADX (black line) above 25 threshold = trend strenghening
DMI- (red line) - above 25 - bear trend strenghening
DMI+ (green line) - above 25 - bull trend strenghening
DMI- (red line) - coming off the bottom - bull trend weakening
DMI+ (green line) - coming off the bottom - bear trend weakening

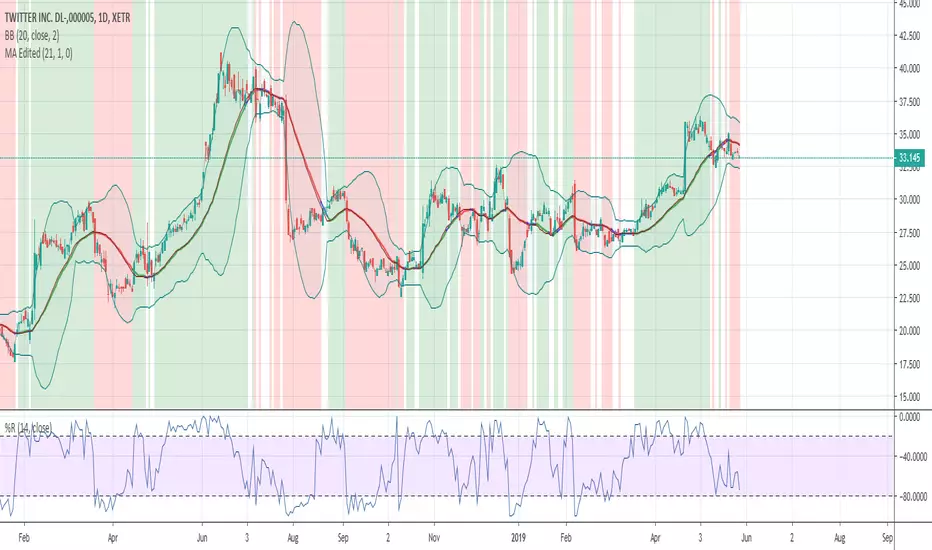
Trend Validation | www.cryptoalphaindicators.comThis indicator is designed to run in the background and provide a bird's eye view of what the prevailing trend is currently (positive/negative).
The navy blue background color indicates a positive trend underway and conversely the red background color indicates a negative trend has been detected.
Formulated with Ehler's Force Index and the Exponential Moving average.
The areas absent of color indicate that no satisfiable correlation was found between price (ema) and the price-to-volume indicator Ehler's Force Index (EFI).
The Trend Validation indicator is available for purchase at www.cryptoalphaindicators.com

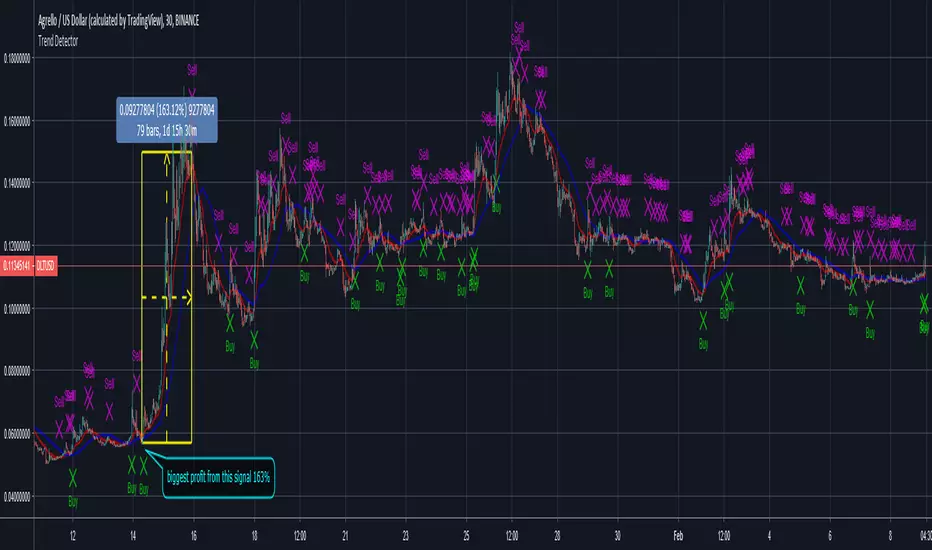
Trend Detector
New indicator for today called Trend Detector, follows the trend. It shows buy signals when coin is going up, sell signals when it is going down. Indicator showed plenty of Buy and Sell signals at the right times for buying and selling DLT . This indicator works on real time so you get the alerts on time so you can action it. Works on other cypto and stocks.
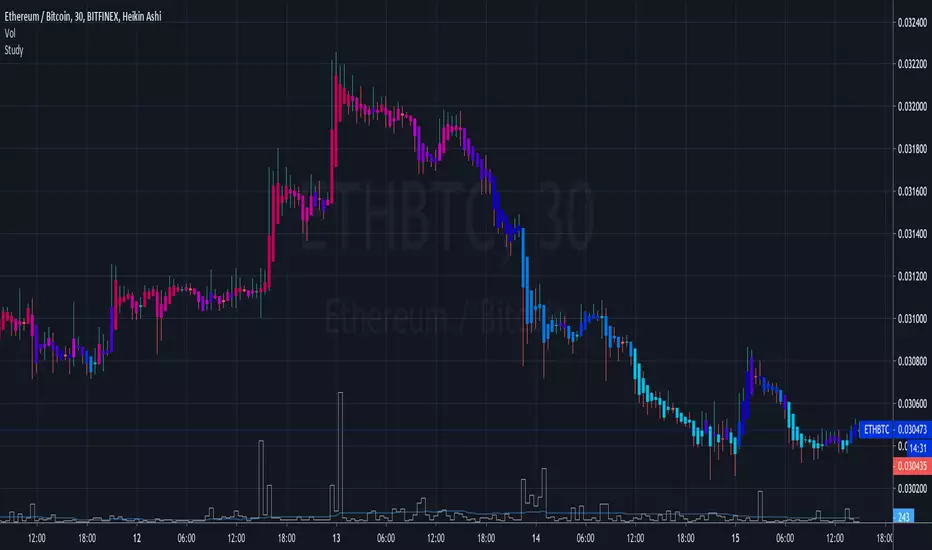
BG-Trend AnalysisTrend Analysis:
Settings for Source:
Chart Period: 1 Hour / 1 Day
Bar Style: Line with Break -
Source: HLC3
