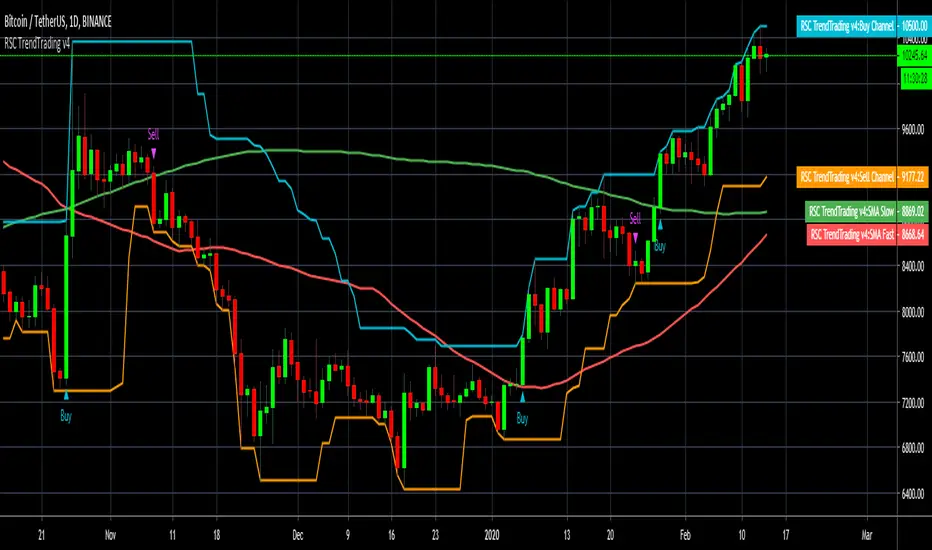
RSC TrendTrading Indicator v4.0Note: this v4.0 is an updated version with improved alert handling and updated to Pine script version. You can easily add alerts (see the end for an explanation).
This indicator combines 4 indicators as one indicator (assuming you are looking at the daily chart ) and adds alerts:
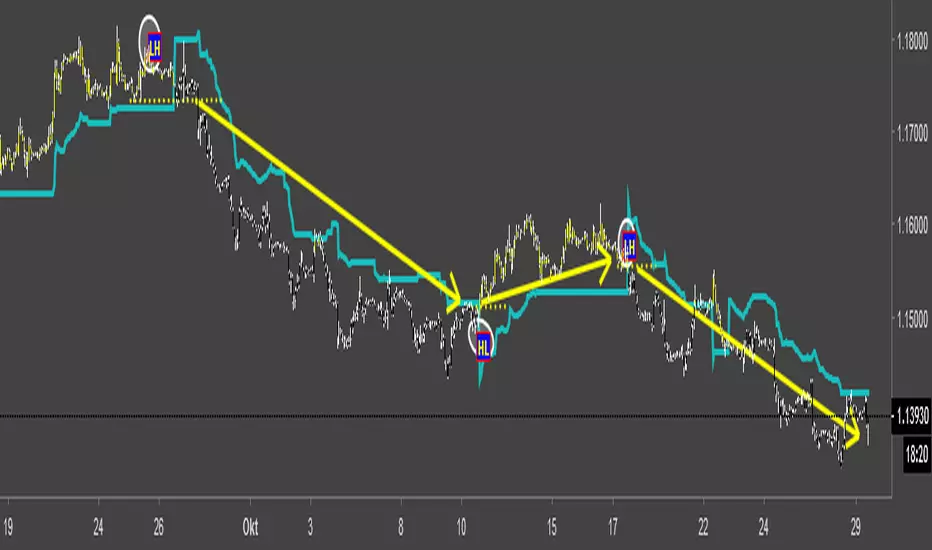
An Upper Donchian Channel of 20 days (default) or more, used to indicate buy signals
A Lower Donchian Channel of 10 days (default) or more, used to indicate exit signals
A 50 day Simple Moving Average (for entry filtering)
A 200 day Simple Moving Average (for entry filtering)
This strategy works best on daily.
You can create alerts by selecting " RSC TrendTrading... " and "Buy Signal" or "Sell Signal" for the condition, then Buy or Sell. I recommend you select "Once Per Bar Close" to avoid getting multiple signals per bar.
This is a combined indicator for those who are familiar with Doc Severson's Trend Trading Class. It is published with permission.
There is way more than just adding the indicators to utilise this trading strategy successfully. You need to attend the Doc's class to understand how this indicator can be used to your advantage.
Please Like, Share, Comment, if you like this indicator.
I have also published a Strategy based on this to allow backtesting!
Please follow me and like, if you use this indicator.
Warning
The Buy and Sell calls are meaningless and must not be auctioned without a thorough understanding of this trading strategy and the full consideration of the entry and exit conditions.
Please use this indicator at your own risk. The publisher does not accept any responsibility for its performance or any implications.
在腳本中搜尋"trend"
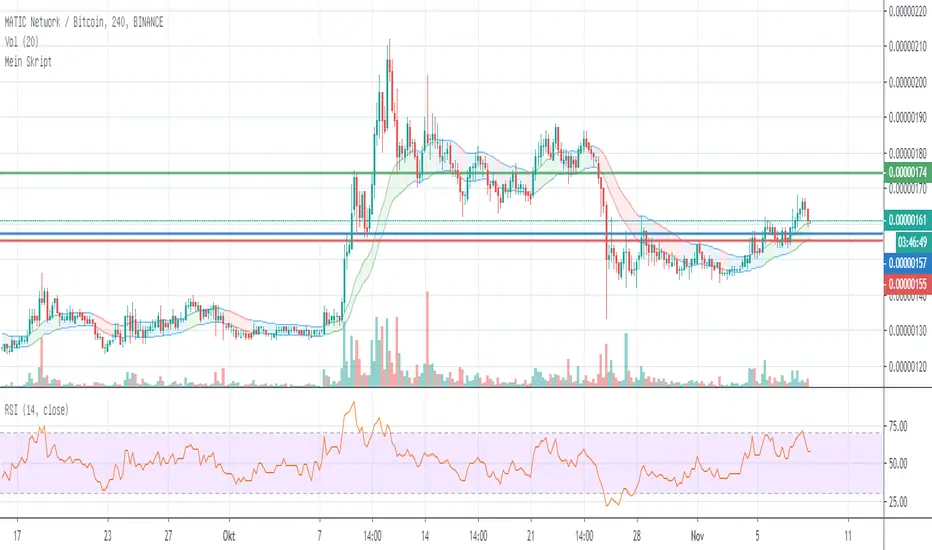
[CryptoWho] Trend-BandsSimple Script to get a better view of trends. The colored band indicates if the market is in a trend or sideways action.
BINANCE:BATBTC
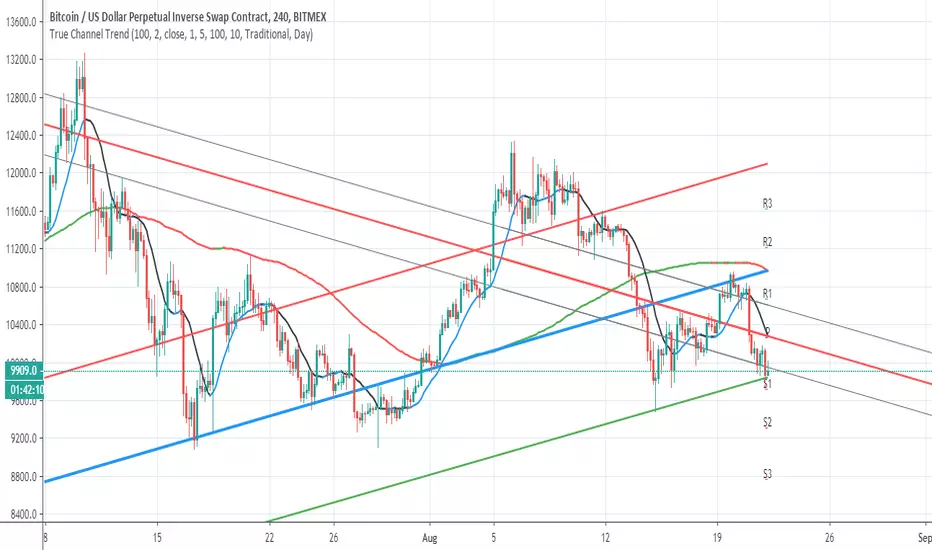
True Channel TrendSo I make hybrid using Alex Grover and follow the trend line script
I think it more accurate this way to show channels of trends
The length of the curve set to 100 , you can make it smaller if you want to see smaller channels for analysis
here on daily chart you can see how accurate it show the trend reverse from march to bullish trend
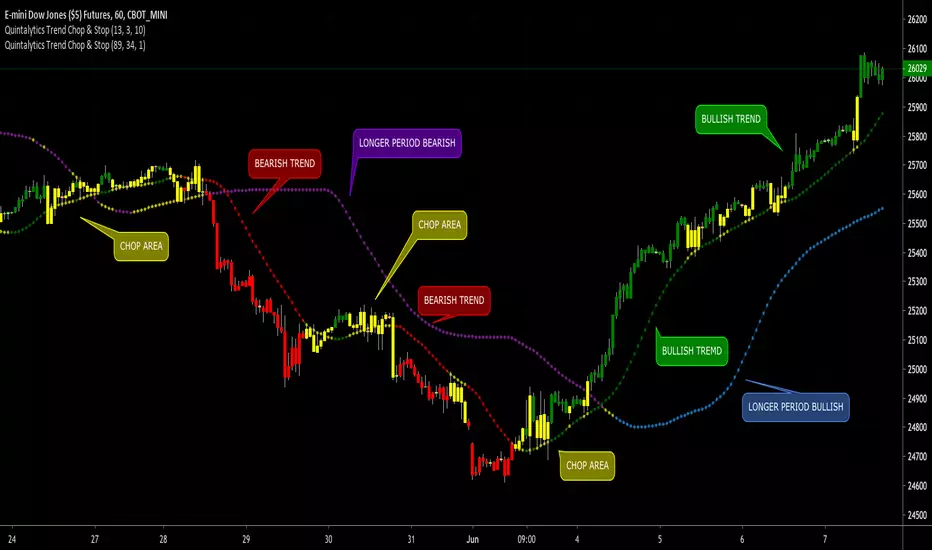
Quintalytics Trend Chop & Stop 19Quintalytics Trend Chop & Stop is a combination of a Trend, Sideways/Chop Detection, and Trailing Stop Loss indicator. This indicator is suitable for use in all timeframes and markets.
COLORS
The Color GREEN indicates the presence of a Bullish Trend.
The Color RED indicates the presence of a Bearish Trend.
The Color YELLOW indicates that the market is Sideways a.k.a. Flat a.k.a. Choppy.
You have the option of COLORING the BAR to match the Current TrailingStop color.
You also have the option of applying a Smoothing to the TrailingStop line.
SETTINGS
The indicator has three parameters: Alpha, Beta, and Gamma. Changing these settings individually or in combination will yield varying results.
Adjusting ALPHA will affect the overall level of TREND detection.
Adjusting BETA will control the DISTANCE of the line away from the current market price.
Adjusting Gamma will control the level of CHOP detection.
TTPro Trend+ATR V9TTPro Trend+ATR identifies trends and helps to establish optimal entyry and exit points once a trend has been established. The indicator can also assist in establishing relevant stop loss levels.

Zaigi Trend SignalEnter with the trend:
Go long when signal line is above 50
Go short when signal line is below 50

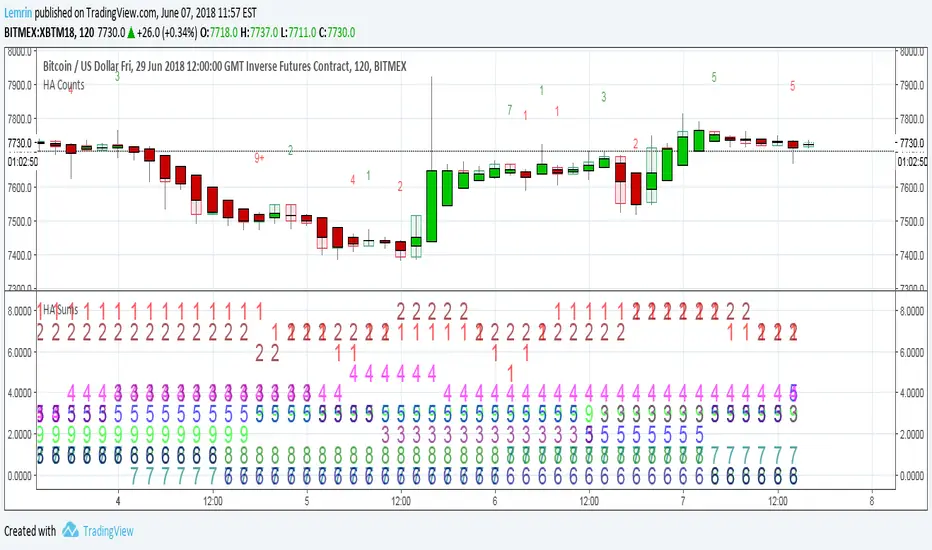
Heikin Ashi Trend Count SumsProvides the number of uninterrupted HA candle color trends over the past x bars that lasted 1, 2, 3, 4, 5, 6, 7, 8, or 9+ bars, where x is an input.
Plotchar is messy, so this is best used with Chart Options->Background->Indicator Values checked. Numbers in order, from lime to red, are the binned number of 9+, 8, 7, 6, 5, 4, 3, 2, and 1 trends that ended within the last x bars.
HA Line + Trend Oklar//@version=5
indicator("HA Line + Trend Oklar", overlay=true)
// Heiken Ashi hesaplamaları
haClose = (open + high + low + close) / 4
var float haOpen = na
haOpen := na(haOpen) ? (open + close) / 2 : (haOpen + haClose ) / 2
haHigh = math.max(high, math.max(haOpen, haClose))
haLow = math.min(low, math.min(haOpen, haClose))
// Trend yönüne göre renk
haColor = haClose >= haClose ? color.green : color.red
// HA kapanış çizgisi
plot(haClose, color=haColor, linewidth=3, title="HA Close Line")
// Agresif oklar ile trend gösterimi
upArrow = ta.crossover(haClose, haClose )
downArrow = ta.crossunder(haClose, haClose )
plotshape(upArrow, title="Up Arrow", location=location.belowbar, color=color.green, style=shape.triangleup, size=size.large)
plotshape(downArrow, title="Down Arrow", location=location.abovebar, color=color.red, style=shape.triangledown, size=size.large)

Basit Trend AL/SAT//@version=5
indicator("Basit Trend AL/SAT", overlay=true)
yesil = close > open
kirmizi = close < open
1 = yeşil, -1 = kırmızı, 0 = başlangıç
var int trend = 0
trend := yesil ? 1 : kirmizi ? -1 : trend
al = yesil and trend != 1
sat = kirmizi and trend != -1
plotshape(al, title="AL", location=location.belowbar, color=color.lime, style=shape.triangleup, size=size.large, text="AL")
plotshape(sat, title="SAT", location=location.abovebar, color=color.red, style=shape.triangledown, size=size.large, text="SAT")
bgcolor(trend == 1 ? color.new(color.green, 85) : trend == -1 ? color.new(color.red, 85) : na)

MTH Trend FinderMTH Trend Finder is an invite-only, advanced market analysis indicator developed by MarketToolHub for traders who want a complete intraday & scalping setup on their charts.
This indicator focuses on accurate trend identification combined with market strength analysis, helping traders avoid weak and false trade setups.
🔹 What It Offers
High-Accuracy Trend Detection
Market Strength Confirmation
False Signal Filtering
Auto-Plotted Trade Levels
Entry
Stop Loss
Targets
Non-Repainting Logic
Works Across All Timeframes
Supports Multiple Markets
Indian Markets | Global Stocks | Indices | Crypto | Commodities | Forex
🔹 How to Use
Apply the indicator to any instrument or timeframe
Trade in the direction of the identified trend
Use the auto-plotted Entry, SL, and Targets for structured risk management
Always confirm trades with proper discipline and risk control
🔹 Access Information
This is an invite-only script.
Access is provided to approved users only.
Redistribution, resale, or sharing access is strictly prohibited.
⚠️ Disclaimer:
This script is for educational and informational purposes only. It does not provide investment advice. Trading involves risk—use proper risk management at all times.


Mirror Trendline ToolThis indicator is an interactive mirror‑trendline drawing tool that uses three draggable points to build two related lines. Point One and Point Two define the primary (blue) trendline; Point Three defines the starting anchor for the mirrored line, which always has the opposite slope to the blue line and updates live as you move the anchor, giving continuous visual feedback while you drag it .
A color‑invert option automatically generates the mirrored line’s color by mathematically inverting the chosen base color while preserving its opacity, with a checkbox to disable inversion so both lines can share the same appearance . When “Stop at Intersection” is checked, both lines terminate exactly at their intersection, creating a clean V‑shaped construction that highlights the symmetry point between the reference move and its mirror . When the box is unchecked, both lines extend beyond that intersection, but their total duration is capped at no more than twice the original blue segment’s length, keeping projections proportionate and preventing excessively long rays from cluttering the chart .

MTF Trend Dashboard (PSAR, SuperTrend, 200EMA, 9/30 EMA)This script is a multi–timeframe trend dashboard designed to quickly show the market bias across several timeframes in one place.
It does not generate buy/sell signals – it is a visual decision tool to support your own strategy.
What it shows
For up to 5 selectable timeframes, the table displays:
Parabolic SAR – whether PSAR is below (bullish) or above (bearish) the candle.
Supertrend – whether the Supertrend line is below or above the price.
200 EMA status – whether price is trading above (bullish trend) or below (bearish trend) the 200 EMA.
9 / 30 EMA crossover – whether 9 EMA is above (bullish) or below (bearish) the 30 EMA.
Green cells represent bullish conditions, red cells represent bearish conditions.
How to use
Quickly check higher–timeframe trend alignment before entering trades.
Use it as a trend filter for scalping or intraday entries on lower timeframes.
Combine with your own price action / SMC / support–resistance rules for actual entries and exits.

Breakout Signal (Trend+ATR+ADX+Score)Breakout Signal – Trend + ATR + ADX + Strength Score
This indicator detects high-quality bullish breakout conditions using a multi-filter confirmation system designed to reduce false signals and highlight only strong momentum events.
A breakout signal triggers when all core conditions align:
📌 Breakout Conditions
1. Price Breakout
Breakout occurs when the current high exceeds the previous close by X%.
This avoids noisy open-based signals and focuses on genuine upward expansion.
2. Volume Spike
Current volume must be higher than the average volume × multiplier.
This ensures the breakout is supported by real trading activity.
3. Trend Filter (MA)
Price must be trading above a moving average.
This prevents counter-trend breakouts and focuses on momentum continuation.
4. ATR Rising
ATR must be rising relative to its own moving average.
A rising ATR confirms volatility expansion — a key ingredient of valid breakouts.
5. ADX Trend Strength
ADX must exceed a user-defined threshold (default: 20).
This confirms the market is in a strong trend environment, reducing false signals.
⭐ Breakout Strength Score (0–5)
Each of the 5 filters contributes 1 point:
Trend OK
Volume Spike
ATR Rising
ADX Strong
Price Breakout
A score label appears on valid breakouts:
5/5 → Very strong breakout
4/5 → Strong breakout
3/5 → Moderate breakout
0–2 → Weak / avoided signals

Smart Trail + Trend RibbonSmart Trail + Trend Ribbon
This script combines a smart trailing system with an EMA-based trend ribbon to help you quickly read trend direction, potential reversals and dynamic support/resistance zones.
1. Smart Trail
The Smart Trail module is based on an external library function getSmartTrail() and plots a dynamic trailing line that adapts to market conditions.
• The line switches its state between long and short depending on price action.
• When the direction is long , the trail is colored with the Up Color; when short , it uses the Down Color.
• The area between the main trail and the filler line is shaded to highlight the active bias and strength of the move.
Smart Trail inputs:
• Trail Period – base length for calculating the trail.
• Param A / Param B – additional sensitivity and smoothing parameters that control how fast the trail reacts to price changes.
• Up Color / Down Color – visual colors for long/short regimes.
Use it as a dynamic support/resistance reference or as a trailing level for managing open positions.
2. Trend Ribbon (EMA Ribbon)
The Trend Ribbon block uses two EMAs calculated on hlc3 (average of high, low and close) and creates a colored band between them.
• When EMA Ribbon 1 is above EMA Ribbon 2 , the area between them is filled with Uptrend Colors .
• When EMA Ribbon 1 is below EMA Ribbon 2 , the area is filled with Downtrend Colors .
• The ribbon is slightly expanded relative to the EMAs using the current price range to make the zone more visible on the chart.
Trend Ribbon inputs:
• EMA Ribbon 1 Period – faster EMA.
• EMA Ribbon 2 Period – slower EMA.
• Uptrend Color / Uptrend Color (2) – main and secondary colors for bullish conditions.
• Downtrend Color / Downtrend Color (2) – main and secondary colors for bearish conditions.
This gives you a clear visual filter of the current trend and helps avoid trading directly against the dominant direction.
How to use
• Combine the Smart Trail direction with the Trend Ribbon bias to confirm entries and exits.
• Long setups are stronger when the Smart Trail is in long mode and the Trend Ribbon shows an uptrend.
• Short setups are cleaner when the Smart Trail is in short mode and the Trend Ribbon shows a downtrend.
• Works on any symbol and timeframe; parameters can be tuned to your trading style (scalping, intraday, swing).
Disclaimer: This script is for educational and analytical purposes only and is not financial advice. Always manage your own risk.

Chartnes Trend StrategyChartnes Trend Strategy displays long entry setups with fixed price levels for Entry, Stop Loss and Take Profit directly on the chart.
Focus on calm, structured trading on daily timeframe.
No performance claims and no financial advice.
Chart visualization only.
Chartnes Trend Strategy zeigt Long-Entry Setups mit festen Preisniveaus für Entry, Stop Loss und Take Profit direkt im Chart.
Fokus auf strukturiertes, ruhiges Handeln im Daily-Bereich.
Keine Performance-Versprechen, keine Beratung. Darstellung reiner Chart-Information.

Chande Trend Meter (CTM) Here’s the English translation of your text:
**CTM (Chande Trend Meter)** is a comprehensive trend strength indicator that combines several technical indicators into a single "meter."
It shows how strong the current trend is (upward or downward) at any given moment.

Multi-TF 50 EMA Overlay (5m, 15m, 4H, 1D) + Trend TableThis script overlays the 50 EMA from four higher timeframes (5m, 15m, 4H, 1D) onto your current chart and shows a trend table so you can see at a glance whether each timeframe is Bullish, Bearish or Sideways.
What it does
Plots 50 EMA for:
5m (red)
15m (orange)
4H (blue)
1D (green)
Classifies each timeframe as:
Bullish – price above ema + band
Bearish – price below ema – band
Sideways – price inside a small band around the EMA
Displays a compact trend table in the top-right with timeframe + trend color.
How to use
Use the table to align your entries with higher-timeframe bias.
Look for confluence when multiple timeframes are Bullish or Bearish.
When most rows show Sideways, you may want to avoid new trades or lower risk.
Inputs
Sideways band % around EMA
Minimum number of agreeing timeframes for bias
This is a visual tool, it does not generate entries/exits — it’s designed to be combined with your own strategy or additional indicators.

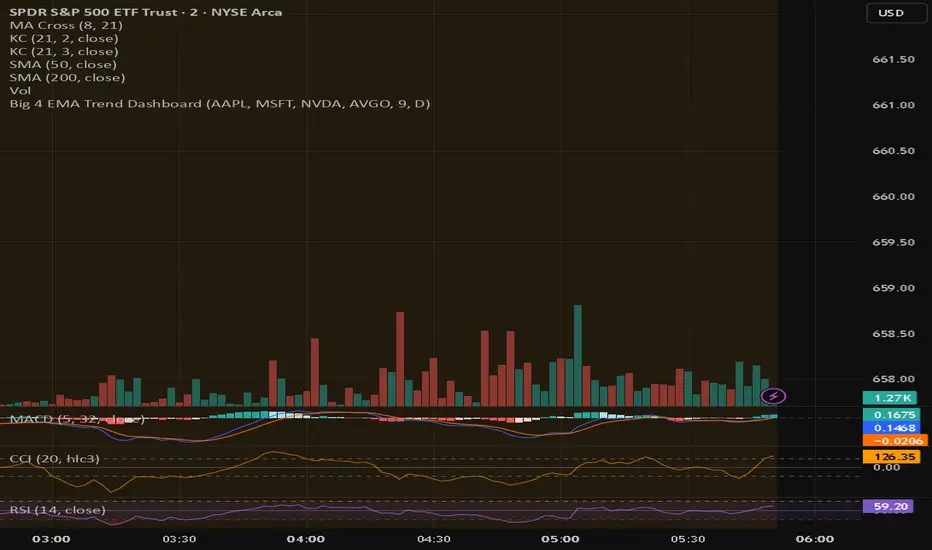
Big 4 EMA Trend DashboardQuickly see the trend direction of your top four stocks using a customizable EMA. Each stock shows as a colored tile: green if price is above the EMA, red if below. A summary label shows whether all four stocks are trending up, down, or mixed.
Key Features:
Track 4 user-defined symbols at a glance
Custom EMA length and optional timeframe override
Compact dashboard ideal for scalping and day trading

Visual Trend IndicatorVisual Trend Indicator v1
Combines SuperTrend + EMA Trend Score into a visual color-based overlay for candlestick charts.
Arrows appear when RSI(2) and SlowStochastic(8,3) are countertrend signals and represent good odds to buy the dip / sell the rip.

Composite Trend AverageThis indicator combines 6 advanced trend-following indicators into a single consensus system:
• HalfTrend
• T3 (Tillson T3)
• FRAMA (Fractal Adaptive Moving Average)
• MAMA (MESA Adaptive Moving Average)
• McGinley Dynamic
• KAMA (Kaufman Adaptive Moving Average)
Features:
- Composite average line (average of all 6 indicators)
- Consensus zone showing the range between highest and lowest indicator values
- Dynamic color coding: GREEN when price closes above ALL indicators, RED when price closes below ALL indicators
- Toggle options for individual indicators, composite line, and consensus zone
