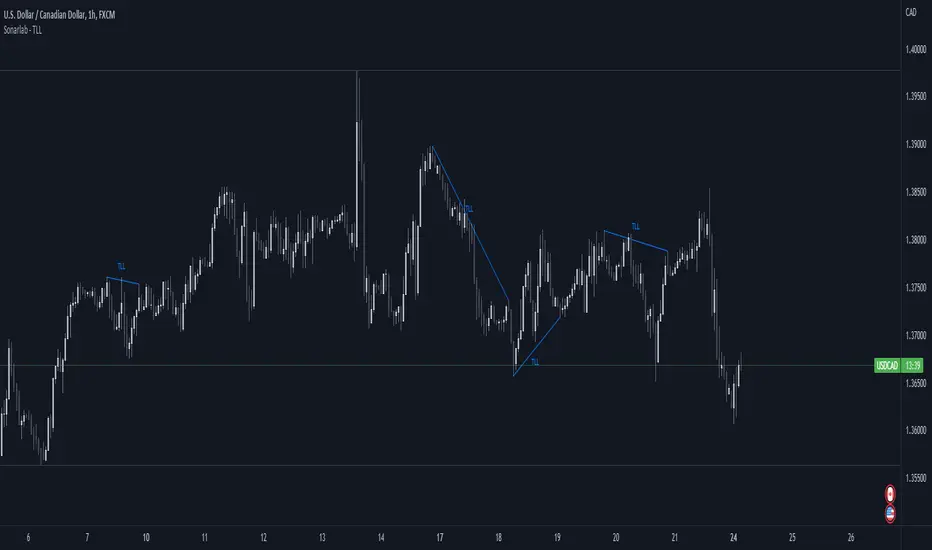
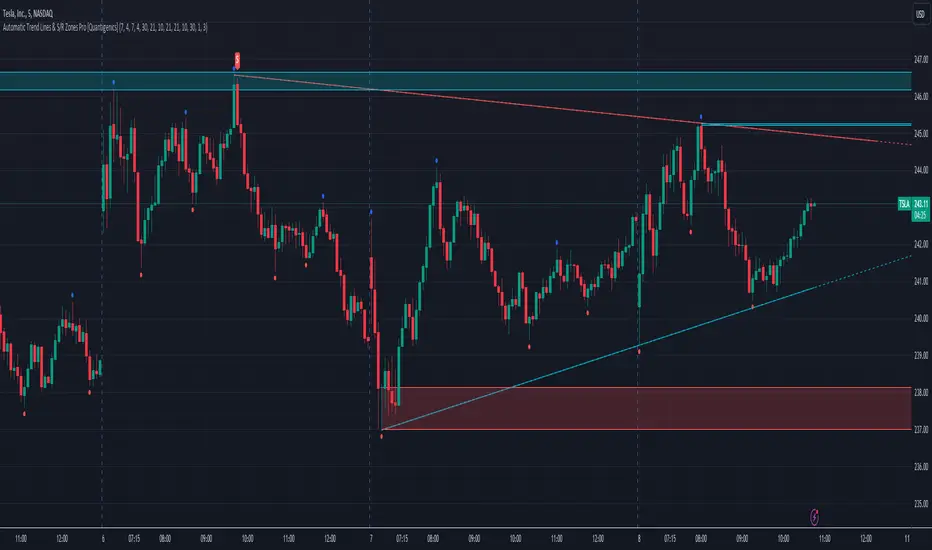
Automatic Trend Lines & S/R Zones Pro [Quantigenics]The “Automatic Trend Lines & S/R Zones Pro ” script is an innovative tool that integrates automated support and resistance zone identification with trend line generation. This script is an invaluable asset in technical analysis, adeptly identifying critical price reversal or breakout areas and drawing trend lines to gauge market direction and momentum. It generates trading signals based on support/resistance and trend line dynamics, making it a versatile standalone or complementary tool suitable for any market or time frame.
The "Automatic Trend Lines & S/R Zones Pro " script performs advanced financial chart analysis by algorithmically identifying support/resistance zones and generating trend lines It analyzes historical data, applying calculations like the highest and lowest price points over specified periods (defined by 'PeakOverBar' and 'LowOverBar' settings) to determine potential support and resistance zones. Trend lines are drawn by connecting significant price peaks and troughs, calculated based on user-defined strength parameters. The script also produces trading signals by analyzing price interactions with these zones and trend lines, using algorithms to detect breakouts or rejections, thus aiding traders in informed decision-making.
Technical Composition: a
Support and Resistance Zone Detection : Mechanism: Utilizes historical price data to identify key levels indicative of intense trading activity, revealing potential price stalling or reversals. These levels are marked based on past market actions and supply-demand dynamics.
Visualization: Zones are highlighted with colored boxes, enabling traders to easily spot shifts in market sentiment.
Automatic Trend Line Generation : Methodology: Connects significant price highs and lows over a designated period, customizable through inputs like PeakOverBar and LowOverBar.
Utility : These trend lines act as crucial indicators of uptrend support and downtrend resistance, aiding in the recognition of potential breakout or reversal zones and trend directions.
Customization and Flexibility : Adjustable Parameters: Includes customization options for peak/trough identification periods, trend line visibility, and extent of support/resistance zones.
Enhanced User Experience : Designed to be intuitive and adaptable, catering to diverse trading styles and strategies.
Usage in Trading :
Entry and Exit Points: The trade signals plotted at the support/resistance zones can be used for identifying both entry and exit points, in anticipation of price stalling and potentially reversing, and breakout signals plotted as price breaks trendlines can be used for breakout trading strategies, as well as stop loss areas.
Signal Alerts: Real-time alerts for significant interactions with trend lines or S/R zones, vital for both entry and exit strategies.
Integration with Other Systems: While effective as a standalone tool, it can also be used alongside other indicators for a more robust trading method.
Input Parameter Settings :
Intra-Bar Signal Generation (IntraBar) : Allows toggling between immediate signal generation within the current bar or after bar closure.
Peak and Low Over Bar (PeakOverBar, LowOverBar) : Sets the bar count for identifying market peaks and lows, adjustable for analyzing different market trends.
Strongest Peaks and Lows Period (StrongestFromPeaks, StrongestFromLows) : Determines the period for identifying significant market peaks and lows.
Show S/R Zones (ShowSRZones) : Enables the display of Support/Resistance zones for better market insight.
Trend Line Type (TrendLineType) : Offers options for trend line styles, like "One Line" or "Triple Lines."
Extend Trend Lines (ExtendTrendLines) : Configures the extension length of trend lines, useful for predicting future trends.
Peak and Low Trend Line Settings (ShowPeakTrendLine, ShowLowTrendLine, etc.) : Manage the display and characteristics of specific trend lines.
Signal Settings (ShowLabels, ShowBreakSignals, ShowPopUPSignals, etc.) : Customizes the appearance and frequency of signals and alerts.
Alert Settings (ShowTrendBreakSignals, ShowTrendPopSignals, etc.) : Configures alerts for significant market events like trend line breaks or rejections.
The "Automatic Trend Lines & S/R Zones Pro" script stands out as an essential tool for traders, offering comprehensive support/resistance and trend line analysis in a single package. Its automatic features, combined with customizable options, make it a key element in elevating market analysis and informed trading decision-making.
As always, remember that trading involves risks and past performance is not indicative of future results.
You can see the “Author’s instructions below to get immediate access to Automatic Trend Lines & S/R Zones Pro & the rest of the “Quantigenics Premium Indicator Suite”.
在腳本中搜尋"trend"
Trend FinderThe "𝙏𝙍𝙀𝙉𝘿 𝙁𝙄𝙉𝘿𝙀𝙍" indicator is a powerful tool designed to detect trends and identify potential reversal points in asset prices. It operates as both a trend-following and mean reversion indicator, offering insights into market movements.
Trend Identification:
Trend Detection:
This indicator primarily identifies trends in asset prices.
When the "𝙏𝙍𝙀𝙉𝘿 𝙁𝙄𝙉𝘿𝙀𝙍" value is above the middle line, it typically indicates an upward trend in the asset's price.
Color Coding: During an upward trend, the bars are colored green, signaling strength in the upward movement. Conversely, during a downtrend, the bars turn red, indicating a potential downward movement in the asset's price.
Calculation Process:
Moving Averages: The calculation involves using multiple Simple Moving Averages (SMAs) based on the open and close prices of the asset.
Incremental SMA Lengths: These SMAs are calculated with increasing lengths, creating a series of comparisons between closing and opening SMAs. If the closing SMA exceeds the opening SMA, a value of 1 is assigned; otherwise, it's assigned as 0.
Aggregation: All these SMA values are compiled into an array and processed to derive an average, emphasizing the trend direction and strength.
Application:
Trend Strength: The indicator's value reflects the overall strength and direction of the trend. Higher values suggest an end or reversing of trend, while lower values what crosses over or under Midline may indicate a trend changing and indicate incrising of trend strength.
Reversal Indication: Besides identifying trends, it can also serve as a mean reversion indicator, potentially pinpointing potential tops and bottoms in the market.
Midline: Additional in settings can be changed a position of midline to up or down to your personal preference.
The "𝙏𝙍𝙀𝙉𝘿 𝙁𝙄𝙉𝘿𝙀𝙍" indicator amalgamates moving averages and trend analysis, offering a comprehensive view of market trends and potential reversal points. Its adaptability through parameter adjustments allows for fine-tuning to suit various market conditions.

RMI Trend Sync - Strategy [presentTrading]█ Introduction and How It Is Different
The "RMI Trend Sync - Strategy " combines the strength of the Relative Momentum Index (RMI) with the dynamic nature of the Supertrend indicator. This strategy diverges from traditional methodologies by incorporating a dual analytical framework, leveraging both momentum and trend indicators to offer a more holistic market perspective. The integration of the RMI provides an enhanced understanding of market momentum, while the Super Trend indicator offers clear insights into the end of market trends, making this strategy particularly effective in diverse market conditions.
BTC 4h long/short performance
█ Strategy: How It Works - Detailed Explanation
- Understanding the Relative Momentum Index (RMI)
The Relative Momentum Index (RMI) is an adaptation of the traditional Relative Strength Index (RSI), designed to measure the momentum of price movements over a specified period. While RSI focuses on the speed and change of price movements, RMI incorporates the direction and magnitude of those movements, offering a more nuanced view of market momentum.
- Principle of RMI
Calculation Method: RMI is calculated by first determining the average gain and average loss over a given period (Length). It differs from RSI in that it uses the price change (close-to-close) rather than absolute gains or losses. The average gain is divided by the average loss, and this ratio is then normalized to fit within a 0-100 scale.
- Momentum Analysis in the Strategy
Thresholds for Decision Making: The strategy uses predetermined thresholds (pmom for positive momentum and nmom for negative momentum) to trigger trading decisions. When RMI crosses above the positive threshold and other conditions align (e.g., a bullish trend), it signals a potential long entry. Similarly, crossing below the negative threshold in a bearish trend may trigger a short entry.
- Super Trend and Trend Analysis
The Super Trend indicator is calculated based on a higher time frame, providing a broader view of the market trend. This indicator uses the Average True Range (ATR) to adapt to market volatility, making it an effective tool for identifying trend reversals.
The strategy employs a Volume Weighted Moving Average (VWMA) alongside the Super Trend, enhancing its capability to identify significant trend shifts.
ETH 4hr long/short performance
█ Trade Direction
The strategy offers flexibility in selecting the trading direction: long, short, or both. This versatility allows traders to adapt to their market outlook and risk tolerance, whether looking to capitalize on bullish trends, bearish trends, or a combination of both.
█ Usage
To effectively use the "RMI Trend Sync" strategy, traders should first set their preferred trading direction and adjust the RMI and Super Trend parameters according to their risk appetite and trading goals.
The strategy is designed to adapt to various market conditions, making it suitable for different asset classes and time frames.
█ Default Settings
RMI Settings: Length: 21, Positive Momentum Threshold: 70, Negative Momentum Threshold: 30
Super Trend Settings: Length: 10, Higher Time Frame: 480 minutes, Super Trend Factor: 3.5, MA Source: WMA
Visual Settings: Display Range MA: True, Bullish Color: #00bcd4, Bearish Color: #ff5252
Additional Settings: Band Length: 30, RWMA Length: 20

Double AI Super Trend Trading - Strategy [PresentTrading]█ Introduction and How It is Different
The Double AI Super Trend Trading Strategy is a cutting-edge approach that leverages the power of not one, but two AI algorithms, in tandem with the SuperTrend technical indicator. The strategy aims to provide traders with enhanced precision in market entry and exit points. It is designed to adapt to market conditions dynamically, offering the flexibility to trade in both bullish and bearish markets.
*The KNN part is mainly referred from @Zeiierman.
BTCUSD 8hr performance
ETHUSD 8hr performance
█ Strategy, How It Works: Detailed Explanation
1. SuperTrend Calculation
The SuperTrend is a popular indicator that captures market trends through a combination of the Volume-Weighted Moving Average (VWMA) and the Average True Range (ATR). This strategy utilizes two sets of SuperTrend calculations with varying lengths and factors to capture both short-term and long-term market trends.
2. KNN Algorithm
The strategy employs k-Nearest Neighbors (KNN) algorithms, which are supervised machine learning models. Two sets of KNN algorithms are used, each focused on different lengths of historical data and number of neighbors. The KNN algorithms classify the current SuperTrend data point as bullish or bearish based on the weighted sum of the labels of the k closest historical data points.
3. Signal Generation
Based on the KNN classifications and the SuperTrend indicator, the strategy generates signals for the start of a new trend and the continuation of an existing trend.
4. Trading Logic
The strategy uses these signals to enter long or short positions. It also incorporates dynamic trailing stops for exit conditions.
Local picture
█ Trade Direction
The strategy allows traders to specify their trading direction: long, short, or both. This enables the strategy to be versatile and adapt to various market conditions.
█ Usage
ToolTips: Comprehensive tooltips are provided for each parameter to guide the user through the customization process.
Inputs: Traders can customize numerous parameters including the number of neighbors in KNN, ATR multiplier, and types of moving averages.
Plotting: The strategy also provides visual cues on the chart to indicate bullish or bearish trends.
Order Execution: Based on the generated signals, the strategy will execute buy or sell orders automatically.
█ Default Settings
The default settings are configured to offer a balanced approach suitable for most scenarios:
Initial Capital: $10,000
Default Quantity Type: 10% of equity
Commission: 0.1%
Slippage: 1
Currency: USD
These settings can be modified to suit various trading styles and asset classes.

Trendline Breakouts With Targets [ChartPrime]The Trendline Breakouts With Targets indicator is meticulously crafted to improve trading decision-making by pinpointing trendline breakouts and breakdowns through pivot point analysis.
Here's a comprehensive look at its primary functionalities:
Upon the occurrence of a breakout or breakdown, a signal is meticulously assessed against a false signal condition/filter, after which the indicator promptly generates a trading signal. Additionally, it conducts precise calculations to determine potential target levels and then exhibits them graphically on the price chart.
🔷 Key Features:
🔸 Trendline Drawing: The indicator automatically plots trendlines based on significant pivot points and wick data, visually representing the prevailing trend.
🔸 Breakout and Breakdown Signals : It triggers trading signals when a breakout (price moves above the trendline) or a breakdown (price moves below the trendline) is detected, helping traders identify potential entry points.
🔸 False Breakout/ Breakdown Filter ✔️: To enhance accuracy, the indicator incorporates a filter to reduce false breakout and breakdown signals, helping traders avoid premature entries.
🔸 Target Calculation: The indicator performs target-level calculations, a critical aspect of trade management.
These calculated target levels are visually displayed on the price chart, helping traders set precise profit targets and make well-informed trading decisions.
🔸 Color-Change Labels: The indicator features label color changes to provide quick visual cues. Labels are initially displayed in orange. When a take profit (TP) level is reached, the label changes to green, indicating a successful trade. Conversely, if a stop-loss (SL) level is hit, the label turns red, signaling a losing trade.
🔸 Settings :
This indicator combines technical analysis, trendline identification, breakout/breakdown signals, and risk management tools to assist traders in making more informed and efficient trading decisions. It can be a valuable addition to any trader's toolkit, helping them identify potential trade opportunities and manage risk effectively.

GKD-C Trend Direction [Loxx]The Giga Kaleidoscope GKD-C Trend Direction is a confirmation module included in Loxx's "Giga Kaleidoscope Modularized Trading System."
█ GKD-C Trend Direction
Trend Direction relies both on the Average True Range (ATR) – a measure of market volatility – and the market's closing price. If ATR Smoothing is set to greater than 0, the ATR is smoothed using an Exponential Moving Average (EMA). This ATR is then multiplied by a factor to derive a threshold. Using this threshold and the market's close price, the code determines the position of the plotted line. The plotted line's color changes based on the close price's relationship to this derived value: green if the close price is above, and red if below, signifying the trend's upward or downward direction respectively.
█ Giga Kaleidoscope Modularized Trading System
Core components of an NNFX algorithmic trading strategy
The NNFX algorithm is built on the principles of trend, momentum, and volatility. There are six core components in the NNFX trading algorithm:
1. Volatility - price volatility; e.g., Average True Range, True Range Double, Close-to-Close, etc.
2. Baseline - a moving average to identify price trend
3. Confirmation 1 - a technical indicator used to identify trends
4. Confirmation 2 - a technical indicator used to identify trends
5. Continuation - a technical indicator used to identify trends
6. Volatility/Volume - a technical indicator used to identify volatility/volume breakouts/breakdown
7. Exit - a technical indicator used to determine when a trend is exhausted
8. Metamorphosis - a technical indicator that produces a compound signal from the combination of other GKD indicators*
*(not part of the NNFX algorithm)
What is Volatility in the NNFX trading system?
In the NNFX (No Nonsense Forex) trading system, ATR (Average True Range) is typically used to measure the volatility of an asset. It is used as a part of the system to help determine the appropriate stop loss and take profit levels for a trade. ATR is calculated by taking the average of the true range values over a specified period.
True range is calculated as the maximum of the following values:
-Current high minus the current low
-Absolute value of the current high minus the previous close
-Absolute value of the current low minus the previous close
ATR is a dynamic indicator that changes with changes in volatility. As volatility increases, the value of ATR increases, and as volatility decreases, the value of ATR decreases. By using ATR in NNFX system, traders can adjust their stop loss and take profit levels according to the volatility of the asset being traded. This helps to ensure that the trade is given enough room to move, while also minimizing potential losses.
Other types of volatility include True Range Double (TRD), Close-to-Close, and Garman-Klass
What is a Baseline indicator?
The baseline is essentially a moving average, and is used to determine the overall direction of the market.
The baseline in the NNFX system is used to filter out trades that are not in line with the long-term trend of the market. The baseline is plotted on the chart along with other indicators, such as the Moving Average (MA), the Relative Strength Index (RSI), and the Average True Range (ATR).
Trades are only taken when the price is in the same direction as the baseline. For example, if the baseline is sloping upwards, only long trades are taken, and if the baseline is sloping downwards, only short trades are taken. This approach helps to ensure that trades are in line with the overall trend of the market, and reduces the risk of entering trades that are likely to fail.
By using a baseline in the NNFX system, traders can have a clear reference point for determining the overall trend of the market, and can make more informed trading decisions. The baseline helps to filter out noise and false signals, and ensures that trades are taken in the direction of the long-term trend.
What is a Confirmation indicator?
Confirmation indicators are technical indicators that are used to confirm the signals generated by primary indicators. Primary indicators are the core indicators used in the NNFX system, such as the Average True Range (ATR), the Moving Average (MA), and the Relative Strength Index (RSI).
The purpose of the confirmation indicators is to reduce false signals and improve the accuracy of the trading system. They are designed to confirm the signals generated by the primary indicators by providing additional information about the strength and direction of the trend.
Some examples of confirmation indicators that may be used in the NNFX system include the Bollinger Bands, the MACD (Moving Average Convergence Divergence), and the MACD Oscillator. These indicators can provide information about the volatility, momentum, and trend strength of the market, and can be used to confirm the signals generated by the primary indicators.
In the NNFX system, confirmation indicators are used in combination with primary indicators and other filters to create a trading system that is robust and reliable. By using multiple indicators to confirm trading signals, the system aims to reduce the risk of false signals and improve the overall profitability of the trades.
What is a Continuation indicator?
In the NNFX (No Nonsense Forex) trading system, a continuation indicator is a technical indicator that is used to confirm a current trend and predict that the trend is likely to continue in the same direction. A continuation indicator is typically used in conjunction with other indicators in the system, such as a baseline indicator, to provide a comprehensive trading strategy.
What is a Volatility/Volume indicator?
Volume indicators, such as the On Balance Volume (OBV), the Chaikin Money Flow (CMF), or the Volume Price Trend (VPT), are used to measure the amount of buying and selling activity in a market. They are based on the trading volume of the market, and can provide information about the strength of the trend. In the NNFX system, volume indicators are used to confirm trading signals generated by the Moving Average and the Relative Strength Index. Volatility indicators include Average Direction Index, Waddah Attar, and Volatility Ratio. In the NNFX trading system, volatility is a proxy for volume and vice versa.
By using volume indicators as confirmation tools, the NNFX trading system aims to reduce the risk of false signals and improve the overall profitability of trades. These indicators can provide additional information about the market that is not captured by the primary indicators, and can help traders to make more informed trading decisions. In addition, volume indicators can be used to identify potential changes in market trends and to confirm the strength of price movements.
What is an Exit indicator?
The exit indicator is used in conjunction with other indicators in the system, such as the Moving Average (MA), the Relative Strength Index (RSI), and the Average True Range (ATR), to provide a comprehensive trading strategy.
The exit indicator in the NNFX system can be any technical indicator that is deemed effective at identifying optimal exit points. Examples of exit indicators that are commonly used include the Parabolic SAR, the Average Directional Index (ADX), and the Chandelier Exit.
The purpose of the exit indicator is to identify when a trend is likely to reverse or when the market conditions have changed, signaling the need to exit a trade. By using an exit indicator, traders can manage their risk and prevent significant losses.
In the NNFX system, the exit indicator is used in conjunction with a stop loss and a take profit order to maximize profits and minimize losses. The stop loss order is used to limit the amount of loss that can be incurred if the trade goes against the trader, while the take profit order is used to lock in profits when the trade is moving in the trader's favor.
Overall, the use of an exit indicator in the NNFX trading system is an important component of a comprehensive trading strategy. It allows traders to manage their risk effectively and improve the profitability of their trades by exiting at the right time.
What is an Metamorphosis indicator?
The concept of a metamorphosis indicator involves the integration of two or more GKD indicators to generate a compound signal. This is achieved by evaluating the accuracy of each indicator and selecting the signal from the indicator with the highest accuracy. As an illustration, let's consider a scenario where we calculate the accuracy of 10 indicators and choose the signal from the indicator that demonstrates the highest accuracy.
The resulting output from the metamorphosis indicator can then be utilized in a GKD-BT backtest by occupying a slot that aligns with the purpose of the metamorphosis indicator. The slot can be a GKD-B, GKD-C, or GKD-E slot, depending on the specific requirements and objectives of the indicator. This allows for seamless integration and utilization of the compound signal within the GKD-BT framework.
How does Loxx's GKD (Giga Kaleidoscope Modularized Trading System) implement the NNFX algorithm outlined above?
Loxx's GKD v2.0 system has five types of modules (indicators/strategies). These modules are:
1. GKD-BT - Backtesting module (Volatility, Number 1 in the NNFX algorithm)
2. GKD-B - Baseline module (Baseline and Volatility/Volume, Numbers 1 and 2 in the NNFX algorithm)
3. GKD-C - Confirmation 1/2 and Continuation module (Confirmation 1/2 and Continuation, Numbers 3, 4, and 5 in the NNFX algorithm)
4. GKD-V - Volatility/Volume module (Confirmation 1/2, Number 6 in the NNFX algorithm)
5. GKD-E - Exit module (Exit, Number 7 in the NNFX algorithm)
6. GKD-M - Metamorphosis module (Metamorphosis, Number 8 in the NNFX algorithm, but not part of the NNFX algorithm)
(additional module types will added in future releases)
Each module interacts with every module by passing data to A backtest module wherein the various components of the GKD system are combined to create a trading signal.
That is, the Baseline indicator passes its data to Volatility/Volume. The Volatility/Volume indicator passes its values to the Confirmation 1 indicator. The Confirmation 1 indicator passes its values to the Confirmation 2 indicator. The Confirmation 2 indicator passes its values to the Continuation indicator. The Continuation indicator passes its values to the Exit indicator, and finally, the Exit indicator passes its values to the Backtest strategy.
This chaining of indicators requires that each module conform to Loxx's GKD protocol, therefore allowing for the testing of every possible combination of technical indicators that make up the six components of the NNFX algorithm.
What does the application of the GKD trading system look like?
Example trading system:
Backtest: Multi-Ticker CC Backtest
Baseline: Hull Moving Average
Volatility/Volume: Hurst Exponent
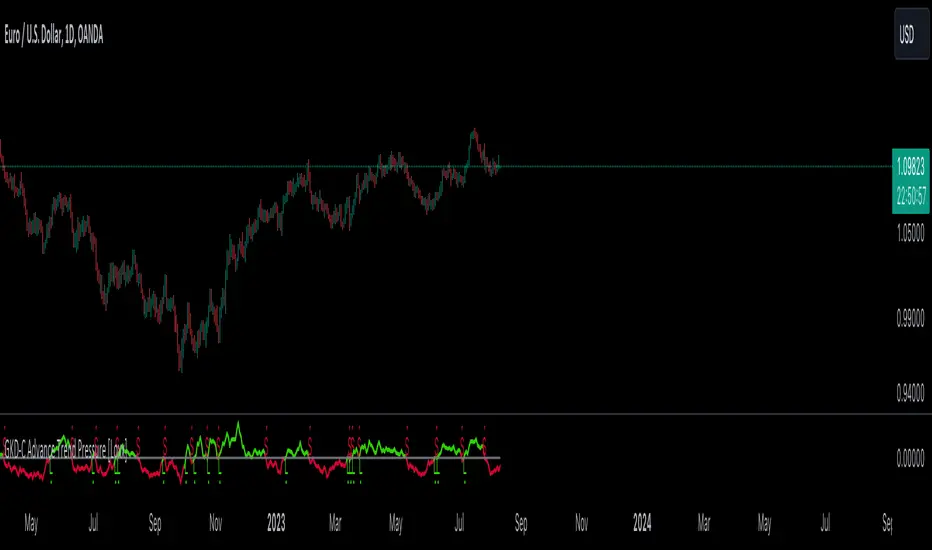
Confirmation 1: Advance Trend Pressure as shown on the chart above
Confirmation 2: uf2018
Continuation: Coppock Curve
Exit: Rex Oscillator
Metamorphosis: Baseline Optimizer
Each GKD indicator is denoted with a module identifier of either: GKD-BT, GKD-B, GKD-C, GKD-V, GKD-M, or GKD-E. This allows traders to understand to which module each indicator belongs and where each indicator fits into the GKD system.
█ Giga Kaleidoscope Modularized Trading System Signals
Standard Entry
1. GKD-C Confirmation gives signal
2. Baseline agrees
3. Price inside Goldie Locks Zone Minimum
4. Price inside Goldie Locks Zone Maximum
5. Confirmation 2 agrees
6. Volatility/Volume agrees
1-Candle Standard Entry
1a. GKD-C Confirmation gives signal
2a. Baseline agrees
3a. Price inside Goldie Locks Zone Minimum
4a. Price inside Goldie Locks Zone Maximum
Next Candle
1b. Price retraced
2b. Baseline agrees
3b. Confirmation 1 agrees
4b. Confirmation 2 agrees
5b. Volatility/Volume agrees
Baseline Entry
1. GKD-B Baseline gives signal
2. Confirmation 1 agrees
3. Price inside Goldie Locks Zone Minimum
4. Price inside Goldie Locks Zone Maximum
5. Confirmation 2 agrees
6. Volatility/Volume agrees
7. Confirmation 1 signal was less than 'Maximum Allowable PSBC Bars Back' prior
1-Candle Baseline Entry
1a. GKD-B Baseline gives signal
2a. Confirmation 1 agrees
3a. Price inside Goldie Locks Zone Minimum
4a. Price inside Goldie Locks Zone Maximum
5a. Confirmation 1 signal was less than 'Maximum Allowable PSBC Bars Back' prior
Next Candle
1b. Price retraced
2b. Baseline agrees
3b. Confirmation 1 agrees
4b. Confirmation 2 agrees
5b. Volatility/Volume agrees
Volatility/Volume Entry
1. GKD-V Volatility/Volume gives signal
2. Confirmation 1 agrees
3. Price inside Goldie Locks Zone Minimum
4. Price inside Goldie Locks Zone Maximum
5. Confirmation 2 agrees
6. Baseline agrees
7. Confirmation 1 signal was less than 7 candles prior
1-Candle Volatility/Volume Entry
1a. GKD-V Volatility/Volume gives signal
2a. Confirmation 1 agrees
3a. Price inside Goldie Locks Zone Minimum
4a. Price inside Goldie Locks Zone Maximum
5a. Confirmation 1 signal was less than 'Maximum Allowable PSVVC Bars Back' prior
Next Candle
1b. Price retraced
2b. Volatility/Volume agrees
3b. Confirmation 1 agrees
4b. Confirmation 2 agrees
5b. Baseline agrees
Confirmation 2 Entry
1. GKD-C Confirmation 2 gives signal
2. Confirmation 1 agrees
3. Price inside Goldie Locks Zone Minimum
4. Price inside Goldie Locks Zone Maximum
5. Volatility/Volume agrees
6. Baseline agrees
7. Confirmation 1 signal was less than 7 candles prior
1-Candle Confirmation 2 Entry
1a. GKD-C Confirmation 2 gives signal
2a. Confirmation 1 agrees
3a. Price inside Goldie Locks Zone Minimum
4a. Price inside Goldie Locks Zone Maximum
5a. Confirmation 1 signal was less than 'Maximum Allowable PSC2C Bars Back' prior
Next Candle
1b. Price retraced
2b. Confirmation 2 agrees
3b. Confirmation 1 agrees
4b. Volatility/Volume agrees
5b. Baseline agrees
PullBack Entry
1a. GKD-B Baseline gives signal
2a. Confirmation 1 agrees
3a. Price is beyond 1.0x Volatility of Baseline
Next Candle
1b. Price inside Goldie Locks Zone Minimum
2b. Price inside Goldie Locks Zone Maximum
3b. Confirmation 1 agrees
4b. Confirmation 2 agrees
5b. Volatility/Volume agrees
Continuation Entry
1. Standard Entry, 1-Candle Standard Entry, Baseline Entry, 1-Candle Baseline Entry, Volatility/Volume Entry, 1-Candle Volatility/Volume Entry, Confirmation 2 Entry, 1-Candle Confirmation 2 Entry, or Pullback entry triggered previously
2. Baseline hasn't crossed since entry signal trigger
4. Confirmation 1 agrees
5. Baseline agrees
6. Confirmation 2 agrees

GKD-C Advance Trend Pressure [Loxx]The Giga Kaleidoscope GKD-C Advance Trend Pressure is a confirmation module included in Loxx's "Giga Kaleidoscope Modularized Trading System."
█ GKD-C Advance Trend Pressure
The code computes the accumulated differences between various price points (open, close, high, low) over a specified range. Depending on the relationship between the closing and opening prices, it updates two accumulators of movement either up or down and then calculates the difference.
█ Giga Kaleidoscope Modularized Trading System
Core components of an NNFX algorithmic trading strategy
The NNFX algorithm is built on the principles of trend, momentum, and volatility. There are six core components in the NNFX trading algorithm:
1. Volatility - price volatility; e.g., Average True Range, True Range Double, Close-to-Close, etc.
2. Baseline - a moving average to identify price trend
3. Confirmation 1 - a technical indicator used to identify trends
4. Confirmation 2 - a technical indicator used to identify trends
5. Continuation - a technical indicator used to identify trends
6. Volatility/Volume - a technical indicator used to identify volatility/volume breakouts/breakdown
7. Exit - a technical indicator used to determine when a trend is exhausted
8. Metamorphosis - a technical indicator that produces a compound signal from the combination of other GKD indicators*
*(not part of the NNFX algorithm)
What is Volatility in the NNFX trading system?
In the NNFX (No Nonsense Forex) trading system, ATR (Average True Range) is typically used to measure the volatility of an asset. It is used as a part of the system to help determine the appropriate stop loss and take profit levels for a trade. ATR is calculated by taking the average of the true range values over a specified period.
True range is calculated as the maximum of the following values:
-Current high minus the current low
-Absolute value of the current high minus the previous close
-Absolute value of the current low minus the previous close
ATR is a dynamic indicator that changes with changes in volatility. As volatility increases, the value of ATR increases, and as volatility decreases, the value of ATR decreases. By using ATR in NNFX system, traders can adjust their stop loss and take profit levels according to the volatility of the asset being traded. This helps to ensure that the trade is given enough room to move, while also minimizing potential losses.
Other types of volatility include True Range Double (TRD), Close-to-Close, and Garman-Klass
What is a Baseline indicator?
The baseline is essentially a moving average, and is used to determine the overall direction of the market.
The baseline in the NNFX system is used to filter out trades that are not in line with the long-term trend of the market. The baseline is plotted on the chart along with other indicators, such as the Moving Average (MA), the Relative Strength Index (RSI), and the Average True Range (ATR).
Trades are only taken when the price is in the same direction as the baseline. For example, if the baseline is sloping upwards, only long trades are taken, and if the baseline is sloping downwards, only short trades are taken. This approach helps to ensure that trades are in line with the overall trend of the market, and reduces the risk of entering trades that are likely to fail.
By using a baseline in the NNFX system, traders can have a clear reference point for determining the overall trend of the market, and can make more informed trading decisions. The baseline helps to filter out noise and false signals, and ensures that trades are taken in the direction of the long-term trend.
What is a Confirmation indicator?
Confirmation indicators are technical indicators that are used to confirm the signals generated by primary indicators. Primary indicators are the core indicators used in the NNFX system, such as the Average True Range (ATR), the Moving Average (MA), and the Relative Strength Index (RSI).
The purpose of the confirmation indicators is to reduce false signals and improve the accuracy of the trading system. They are designed to confirm the signals generated by the primary indicators by providing additional information about the strength and direction of the trend.
Some examples of confirmation indicators that may be used in the NNFX system include the Bollinger Bands, the MACD (Moving Average Convergence Divergence), and the MACD Oscillator. These indicators can provide information about the volatility, momentum, and trend strength of the market, and can be used to confirm the signals generated by the primary indicators.
In the NNFX system, confirmation indicators are used in combination with primary indicators and other filters to create a trading system that is robust and reliable. By using multiple indicators to confirm trading signals, the system aims to reduce the risk of false signals and improve the overall profitability of the trades.
What is a Continuation indicator?
In the NNFX (No Nonsense Forex) trading system, a continuation indicator is a technical indicator that is used to confirm a current trend and predict that the trend is likely to continue in the same direction. A continuation indicator is typically used in conjunction with other indicators in the system, such as a baseline indicator, to provide a comprehensive trading strategy.
What is a Volatility/Volume indicator?
Volume indicators, such as the On Balance Volume (OBV), the Chaikin Money Flow (CMF), or the Volume Price Trend (VPT), are used to measure the amount of buying and selling activity in a market. They are based on the trading volume of the market, and can provide information about the strength of the trend. In the NNFX system, volume indicators are used to confirm trading signals generated by the Moving Average and the Relative Strength Index. Volatility indicators include Average Direction Index, Waddah Attar, and Volatility Ratio. In the NNFX trading system, volatility is a proxy for volume and vice versa.
By using volume indicators as confirmation tools, the NNFX trading system aims to reduce the risk of false signals and improve the overall profitability of trades. These indicators can provide additional information about the market that is not captured by the primary indicators, and can help traders to make more informed trading decisions. In addition, volume indicators can be used to identify potential changes in market trends and to confirm the strength of price movements.
What is an Exit indicator?
The exit indicator is used in conjunction with other indicators in the system, such as the Moving Average (MA), the Relative Strength Index (RSI), and the Average True Range (ATR), to provide a comprehensive trading strategy.
The exit indicator in the NNFX system can be any technical indicator that is deemed effective at identifying optimal exit points. Examples of exit indicators that are commonly used include the Parabolic SAR, the Average Directional Index (ADX), and the Chandelier Exit.
The purpose of the exit indicator is to identify when a trend is likely to reverse or when the market conditions have changed, signaling the need to exit a trade. By using an exit indicator, traders can manage their risk and prevent significant losses.
In the NNFX system, the exit indicator is used in conjunction with a stop loss and a take profit order to maximize profits and minimize losses. The stop loss order is used to limit the amount of loss that can be incurred if the trade goes against the trader, while the take profit order is used to lock in profits when the trade is moving in the trader's favor.
Overall, the use of an exit indicator in the NNFX trading system is an important component of a comprehensive trading strategy. It allows traders to manage their risk effectively and improve the profitability of their trades by exiting at the right time.
What is an Metamorphosis indicator?
The concept of a metamorphosis indicator involves the integration of two or more GKD indicators to generate a compound signal. This is achieved by evaluating the accuracy of each indicator and selecting the signal from the indicator with the highest accuracy. As an illustration, let's consider a scenario where we calculate the accuracy of 10 indicators and choose the signal from the indicator that demonstrates the highest accuracy.
The resulting output from the metamorphosis indicator can then be utilized in a GKD-BT backtest by occupying a slot that aligns with the purpose of the metamorphosis indicator. The slot can be a GKD-B, GKD-C, or GKD-E slot, depending on the specific requirements and objectives of the indicator. This allows for seamless integration and utilization of the compound signal within the GKD-BT framework.
How does Loxx's GKD (Giga Kaleidoscope Modularized Trading System) implement the NNFX algorithm outlined above?
Loxx's GKD v2.0 system has five types of modules (indicators/strategies). These modules are:
1. GKD-BT - Backtesting module (Volatility, Number 1 in the NNFX algorithm)
2. GKD-B - Baseline module (Baseline and Volatility/Volume, Numbers 1 and 2 in the NNFX algorithm)
3. GKD-C - Confirmation 1/2 and Continuation module (Confirmation 1/2 and Continuation, Numbers 3, 4, and 5 in the NNFX algorithm)
4. GKD-V - Volatility/Volume module (Confirmation 1/2, Number 6 in the NNFX algorithm)
5. GKD-E - Exit module (Exit, Number 7 in the NNFX algorithm)
6. GKD-M - Metamorphosis module (Metamorphosis, Number 8 in the NNFX algorithm, but not part of the NNFX algorithm)
(additional module types will added in future releases)
Each module interacts with every module by passing data to A backtest module wherein the various components of the GKD system are combined to create a trading signal.
That is, the Baseline indicator passes its data to Volatility/Volume. The Volatility/Volume indicator passes its values to the Confirmation 1 indicator. The Confirmation 1 indicator passes its values to the Confirmation 2 indicator. The Confirmation 2 indicator passes its values to the Continuation indicator. The Continuation indicator passes its values to the Exit indicator, and finally, the Exit indicator passes its values to the Backtest strategy.
This chaining of indicators requires that each module conform to Loxx's GKD protocol, therefore allowing for the testing of every possible combination of technical indicators that make up the six components of the NNFX algorithm.
What does the application of the GKD trading system look like?
Example trading system:
Backtest: Multi-Ticker CC Backtest
Baseline: Hull Moving Average
Volatility/Volume: Hurst Exponent
Confirmation 1: Advance Trend Pressure as shown on the chart above
Confirmation 2: uf2018
Continuation: Coppock Curve
Exit: Rex Oscillator
Metamorphosis: Baseline Optimizer
Each GKD indicator is denoted with a module identifier of either: GKD-BT, GKD-B, GKD-C, GKD-V, GKD-M, or GKD-E. This allows traders to understand to which module each indicator belongs and where each indicator fits into the GKD system.
█ Giga Kaleidoscope Modularized Trading System Signals
Standard Entry
1. GKD-C Confirmation gives signal
2. Baseline agrees
3. Price inside Goldie Locks Zone Minimum
4. Price inside Goldie Locks Zone Maximum
5. Confirmation 2 agrees
6. Volatility/Volume agrees
1-Candle Standard Entry
1a. GKD-C Confirmation gives signal
2a. Baseline agrees
3a. Price inside Goldie Locks Zone Minimum
4a. Price inside Goldie Locks Zone Maximum
Next Candle
1b. Price retraced
2b. Baseline agrees
3b. Confirmation 1 agrees
4b. Confirmation 2 agrees
5b. Volatility/Volume agrees
Baseline Entry
1. GKD-B Baseline gives signal
2. Confirmation 1 agrees
3. Price inside Goldie Locks Zone Minimum
4. Price inside Goldie Locks Zone Maximum
5. Confirmation 2 agrees
6. Volatility/Volume agrees
7. Confirmation 1 signal was less than 'Maximum Allowable PSBC Bars Back' prior
1-Candle Baseline Entry
1a. GKD-B Baseline gives signal
2a. Confirmation 1 agrees
3a. Price inside Goldie Locks Zone Minimum
4a. Price inside Goldie Locks Zone Maximum
5a. Confirmation 1 signal was less than 'Maximum Allowable PSBC Bars Back' prior
Next Candle
1b. Price retraced
2b. Baseline agrees
3b. Confirmation 1 agrees
4b. Confirmation 2 agrees
5b. Volatility/Volume agrees
Volatility/Volume Entry
1. GKD-V Volatility/Volume gives signal
2. Confirmation 1 agrees
3. Price inside Goldie Locks Zone Minimum
4. Price inside Goldie Locks Zone Maximum
5. Confirmation 2 agrees
6. Baseline agrees
7. Confirmation 1 signal was less than 7 candles prior
1-Candle Volatility/Volume Entry
1a. GKD-V Volatility/Volume gives signal
2a. Confirmation 1 agrees
3a. Price inside Goldie Locks Zone Minimum
4a. Price inside Goldie Locks Zone Maximum
5a. Confirmation 1 signal was less than 'Maximum Allowable PSVVC Bars Back' prior
Next Candle
1b. Price retraced
2b. Volatility/Volume agrees
3b. Confirmation 1 agrees
4b. Confirmation 2 agrees
5b. Baseline agrees
Confirmation 2 Entry
1. GKD-C Confirmation 2 gives signal
2. Confirmation 1 agrees
3. Price inside Goldie Locks Zone Minimum
4. Price inside Goldie Locks Zone Maximum
5. Volatility/Volume agrees
6. Baseline agrees
7. Confirmation 1 signal was less than 7 candles prior
1-Candle Confirmation 2 Entry
1a. GKD-C Confirmation 2 gives signal
2a. Confirmation 1 agrees
3a. Price inside Goldie Locks Zone Minimum
4a. Price inside Goldie Locks Zone Maximum
5a. Confirmation 1 signal was less than 'Maximum Allowable PSC2C Bars Back' prior
Next Candle
1b. Price retraced
2b. Confirmation 2 agrees
3b. Confirmation 1 agrees
4b. Volatility/Volume agrees
5b. Baseline agrees
PullBack Entry
1a. GKD-B Baseline gives signal
2a. Confirmation 1 agrees
3a. Price is beyond 1.0x Volatility of Baseline
Next Candle
1b. Price inside Goldie Locks Zone Minimum
2b. Price inside Goldie Locks Zone Maximum
3b. Confirmation 1 agrees
4b. Confirmation 2 agrees
5b. Volatility/Volume agrees
Continuation Entry
1. Standard Entry, 1-Candle Standard Entry, Baseline Entry, 1-Candle Baseline Entry, Volatility/Volume Entry, 1-Candle Volatility/Volume Entry, Confirmation 2 Entry, 1-Candle Confirmation 2 Entry, or Pullback entry triggered previously
2. Baseline hasn't crossed since entry signal trigger
4. Confirmation 1 agrees
5. Baseline agrees
6. Confirmation 2 agrees
[tradinghook] - Renko Trend Reversal Strategy V2Title: Renko Trend Reversal Strategy
Short Title: - Renko TRS
> Special thanks to for manually calculating `renkoClose` and `renkoOpen` values in order to remove the infamous repaint issue
Description:
The Renko Trend Reversal Strategy ( - Renko TRS) is a powerful and original trading approach designed to identify trend reversals in financial markets using Renko charts. Renko charts differ from traditional time-based charts, as they focus solely on price movements and ignore time, resulting in a clearer representation of market trends. This strategy leverages Renko charts in conjunction with the Average True Range (ATR) to capture trend reversals with high precision and effectiveness.
Key Concepts:
Renko Charts: Renko charts are unique chart types that only plot price movements beyond a predefined brick size, ignoring time and noise. By doing so, they provide a more straightforward depiction of market trends, eliminating insignificant price fluctuations and making it easier to spot trend reversals.
Average True Range (ATR): The strategy utilizes the ATR indicator, which measures market volatility and provides valuable insights into potential price movements. By setting the brick size of the Renko chart based on the ATR, the strategy adapts to changing market conditions, ensuring optimal performance across various instruments and timeframes.
How it Works:
The Renko Trend Reversal Strategy is designed to identify trend reversal points and generate buy or sell signals based on the following principles:
Renko Brick Generation: The strategy calculates the ATR over a user-defined period (ATR Length) and utilizes this value to determine the size of Renko bricks. Larger ATR values result in bigger bricks, capturing higher market volatility, while smaller ATR values create smaller bricks for calmer market conditions.
Buy and Sell Signals: The strategy generates buy signals when the Renko chart's open price crosses below the close price, indicating a potential bullish trend reversal. Conversely, sell signals are generated when the open price crosses above the close price, suggesting a bearish trend reversal. These signals help traders identify potential entry points to capitalize on market movements.
Stop Loss and Take Profit Management: To manage risk and protect profits, the strategy incorporates dynamic stop-loss and take-profit levels. The stop-loss level is calculated as a percentage of the Renko open price, ensuring a fixed risk amount for each trade. Similarly, the take-profit level is set as a percentage of the Renko open price to secure potential gains.
How to Use:
Inputs: Before using the strategy, traders can customize several parameters to suit their trading preferences. These inputs include the ATR Length, Stop Loss Percentage, Take Profit Percentage, Start Date, and End Date. Adjusting these settings allows users to optimize the strategy for different market conditions and risk tolerances.
Chart Setup: Apply the - Renko TRS script to your desired financial instrument and timeframe on TradingView. The Renko chart will dynamically adjust its brick size based on the ATR Length parameter.
Buy and Sell Signals: The strategy will generate green "Buy" labels below bullish reversal points and red "Sell" labels above bearish reversal points on the Renko chart. These labels indicate potential entry points for long and short trades, respectively.
Risk Management: The strategy automatically calculates stop-loss and take-profit levels based on the user-defined percentages. Traders can ensure proper risk management by using these levels to protect their capital and secure profits.
Backtesting and Optimization: Before implementing the strategy live, traders are encouraged to backtest it on historical data to assess its performance across various market conditions. Adjust the input parameters through optimization to find the most suitable settings for specific instruments and timeframes.
Conclusion:
The - Renko Trend Reversal Strategy is a unique and versatile tool for traders looking to identify trend reversals with greater accuracy. By combining Renko charts and the Average True Range (ATR) indicator, this strategy adapts to market dynamics and provides clear entry and exit signals. Traders can harness the power of Renko charts while effectively managing risk through stop-loss and take-profit levels. Before using the strategy in live trading, backtesting and optimization will help traders fine-tune the parameters for optimal performance. Start exploring trend reversals with the - Renko TRS and take your trading to the next level.
(Note: This description is for illustrative purposes only and does not constitute financial advice. Traders are advised to thoroughly test the strategy and exercise sound risk management practices when trading in real markets.)

Cumulative TrendThe "Cumulative Trend" indicator is designed to provide insights into the cumulative price trend while considering volume and volatility. It aims to identify potential shifts in the trend based on the relationship between price changes and these factors. Let's break down the steps involved: In the code, the term "previous" refers to the average of the previous data points over a defined length. Instead of considering the exact previous data point, the code calculates the average of a specific number of preceding data points. It enables the consideration of multiple preceding values, resulting in a smoother representation of trends and a more robust analysis of the data
Calculation of Volume and Volatility Adjusted Price Change:
The indicator starts by calculating the price change as a percentage relative to the previous opening price.
It determines the standard deviation of the close prices, providing a measure of price volatility.
The coefficient of variation is calculated by comparing the standard deviation to the previous close price.
Intraday volatility is calculated as the difference between the high and low prices divided by the close price.
Various ratios are derived by comparing the current volume to the previous volume and relating the intraday volatility to the coefficient of variation.
Cumulative Sum:
The Volume and Volatility Adjusted Price Change values are cumulatively summed to form the cumulative sum.
This cumulative sum represents the overall trend of the price changes, incorporating the impact of volume and volatility.
Average Cumulative Sum:
The average cumulative sum is calculated by applying a simple moving average to the cumulative sum over a specified window size.
This moving average helps smooth out the cumulative trend and highlights the general direction of the price changes.
Average Cumulative Sum Change:
The change in the average cumulative sum is determined by subtracting the previous average cumulative sum value from the current value.
This calculation provides insights into the rate of change in the cumulative trend.
Color Determination:
Thresholds are introduced to define levels at which the trend is considered to change.
The average cumulative sum change is compared against these thresholds.
If the average cumulative sum change exceeds the upper threshold, the color is set to green, indicating a potential upward trend.
If the average cumulative sum change falls below the lower threshold, the color is set to red, indicating a potential downward trend.
If the average cumulative sum change is within the threshold range, the color is set to a yellowish tone, indicating a neutral or transitional phase.
Plotting:
The average cumulative sum is plotted as a line on the chart.
The color of the line is determined based on the calculated color value, reflecting the perceived trend direction.
In summary, the Cumulative Trend indicator integrates volume, volatility, and price changes to provide a cumulative perspective on the trend. It tracks the cumulative price changes, calculates the average trend, and visually represents potential trend shifts through color changes. Traders and analysts can utilize this indicator to identify and monitor changes in the underlying trend, aiding in decision-making and market analysis.

Trend Correlation HeatmapHello everyone!
I am excited to release my trend correlation heatmap, or trend heatmap for short.
Per usual, I think its important to explain the theory before we get into the use of the indicator, so let's get into the theory!
The theory:
So what is a correlation?
Correlation is the relationship one variable has to another. Correlations are the basis of everything I do as a quantitative trader. From the correlation between the same variables (i.e. autocorrelation), the correlation between other variables (i.e. VIX and SPY, SPY High and SPY Low, DXY and ES1! close, etc.) and, as well, the correlation between price and time (time series correlation).
This may sound very familiar to you, especially if you are a user, observer or follower of my ideas and/or indicators. Ninety-five percent of my indicators are a function of one of those three things. Whether it be a time series based indicator (i.e.my time series indicator), whether it be autocorrelation (my autoregressive cloud indicator or my autocorrelation oscillator) or whether it be regressive in nature (i.e. my SPY Volume weighted close, or even my expected move which uses averages in lieu of regressive approaches but is foundational in regression principles. Or even my VIX oscillator which relies on the premise of correlations between tickers.) So correlation is extremely important to me and while its true I am more of a regression trader than anything, I would argue that I am more of a correlation trader, because correlations are the backbone of how I develop math models of stocks.
What I am trying to stress here is the importance of correlations. They really truly are foundational to any type of quantitative analysis for stocks. And as such, understanding the current relationship a stock has to time is pivotal for any meaningful analysis to be conducted.
So what is correlation to time and what does it tell us?
Correlation to time, otherwise known and commonly referred to as "Time Series", is the relationship a ticker's price has to the passing of time. It is displayed in the traditional Pearson Correlation Coefficient or R value and can be any value from -1 (strong negative relationship, i.e. a strong downtrend) to + 1 (i.e. a strong positive relationship, i.e. a strong uptrend). The higher or lower the value the stronger the up or downtrend is.
As such, correlation to time tells us two very important things. These are:
a) The direction of the stock; and
b) The strength of the trend.
Let's take a look at an example:
Above we have a chart of QQQ. We can see a trendline that seems to fit well. The questions we ask as traders are:
1. What is the likelihood QQQ breaks down from this trendline?
2. What is the likelihood QQQ continues up?
3. What is the likelihood QQQ does a false breakdown?
There are numerous mathematical approaches we can take to answer these questions. For example, 1 and 2 can be answered by use of a Cumulative Distribution Density analysis (CDDA) or even a linear or loglinear regression analysis and 3 can be answered, more or less, with a linear regression analysis and standard error ascertainment, or even just a general comparison using a data science approach (such as cosine similarity or Manhattan distance).
But, the reality is, all 3 of these questions can be visualized, at least in some way, by simply looking at the correlation to time. Let's look at this chart again, this time with the correlation heatmap applied:
If we look at the indicator we can see some pivotal things. These are:
1. We have 4, very strong uptrends that span both higher AND lower timeframes. We have a strong uptrend of 0.96 on the 5 minute, 50 candle period. We have a strong uptrend at the 300 candle lookback period on the 1 minute, we have a strong uptrend on the 100 day lookback on the daily timeframe period and we have a strong uptrend on the 5 minute on the 500 candle lookback period.
2. By comparison, we have 3 downtrends, all of which have correlations less than the 4 uptrends. All of the downtrends have a correlation above -0.8 (which we would want lower than -0.8 to be very strong), and all of the uptrends are greater than + 0.80.
3. We can also see that the uptrends are not confined to the smaller timeframes. We have multiple uptrends on multiple timeframes and both short term (50 to 100 candles) and long term (up to 500 candles).
4. The overall trend is strengthening to the upside manifested by a positive Max Change and a Positive Min change (to be discussed later more in-depth).
With this, we can see that QQQ is actually very strong and likely will continue at least some upside. If we let this play out:
We continued up, had one test and then bounced.
Now, I want to specify, this indicator is not a panacea for all trading. And in relation to the 3 questions posed, they are best answered, at least quantitatively, not only by correlation but also by the aforementioned methods (CDDA, etc.) but correlation will help you get a feel for the strength or weakness present with a stock.
What are some tangible applications of the indicator?
For me, this indicator is used in many ways. Let me outline some ways I generally apply this indicator in my day and swing trading:
1. Gauging the strength of the stock: The indictor tells you the most prevalent behavior of the stock. Are there more downtrends than uptrends present? Are the downtrends present on the larger timeframes vs uptrends on the shorter indicating a possible bullish reversal? or vice versa? Are the trends strengthening or weakening? All of these things can be visualized with the indicator.
2. Setting parameters for other indicators: If you trade EMAs or SMAs, you may have a "one size fits all" approach. However, its actually better to adjust your EMA or SMA length to the actual trend itself. Take a look at this:
This is QQQ on the 1 hour with the 200 EMA with 200 standard deviation bands added. If we look at the heatmap, we can see, yes indeed 200 has a fairly strong uptrend correlation of 0.70. But the strongest hourly uptrend is actually at 400 candles, with a correlation of 0.91. So what happens if we change the EMA length and standard deviation to 400? This:
The exact areas are circled and colour coded. You can see, the 400 offers more of a better reference point of supports and resistances as well as a better overall trend fit. And this is why I never advocate for getting married to a specific EMA. If you are an EMA 200 lover or 21 or 51, know that these are not always the best depending on the trend and situation.
Components of the indicator:
Ah okay, now for the boring stuff. Let's go over the functionality of the indicator. I tried to keep it simple, so it is pretty straight forward. If we open the menu here are our options:
We have the ability to toggle whichever timeframes we want. We also have the ability to toggle on or off the legend that displays the colour codes and the Max and Min highest change.
Max and Min highest change: The max and min highest change simply display the change in correlation over the previous 14 candles. An increasing Max change means that the Max trend is strengthening. If we see an increasing Max change and an increasing Min change (the Min correlation is moving up), this means the stock is bullish. Why? Because the min (i.e. ideally a big negative number) is going up closer to the positives. Therefore, the downtrend is weakening.
If we see both the Max and Min declining (red), that means the uptrend is weakening and downtrend is strengthening. Here are some examples:
Final Thoughts:
And that is the indicator and the theory behind the indicator.
In a nutshell, to summarize, the indicator simply tracks the correlation of a ticker to time on multiple timeframes. This will allow you to make judgements about strength, sentiment and also help you adjust which tools and timeframes you are using to perform your analyses.
As well, to make the indicator more user friendly, I tried to make the colours distinctively different. I was going to do different shades but it was a little difficult to visualize. As such, I have included a toggle-able legend with a breakdown of the colour codes!
That's it my friends, I hope you find it useful!
Safe trades and leave your questions, comments and feedback below!

GKD-C Prevailing Trend [Loxx]The Giga Kaleidoscope GKD-C Prevailing Trend is a confirmation module included in Loxx's "Giga Kaleidoscope Modularized Trading System."
█ Giga Kaleidoscope GKD-C Prevailing Trend
Prevailing Trend is a simple indicator that compares close and open prices to derive trend information. This caculation is then passed through one of various smoothing functions to derive the final output. Prevailing Trend is a very fast indicator and therefore produces a lot of signals. This default settings for this indicator make it a suitable choice for a GKD-C Confirmation 1 indicator.
█ Giga Kaleidoscope Modularized Trading System
Core components of an NNFX algorithmic trading strategy
The NNFX algorithm is built on the principles of trend, momentum, and volatility. There are six core components in the NNFX trading algorithm:
1. Volatility - price volatility; e.g., Average True Range, True Range Double, Close-to-Close, etc.
2. Baseline - a moving average to identify price trend
3. Confirmation 1 - a technical indicator used to identify trends
4. Confirmation 2 - a technical indicator used to identify trends
5. Continuation - a technical indicator used to identify trends
6. Volatility/Volume - a technical indicator used to identify volatility/volume breakouts/breakdown
7. Exit - a technical indicator used to determine when a trend is exhausted
8. Metamorphosis - a technical indicator that produces a compound signal from the combination of other GKD indicators*
*(not part of the NNFX algorithm)
What is Volatility in the NNFX trading system?
In the NNFX (No Nonsense Forex) trading system, ATR (Average True Range) is typically used to measure the volatility of an asset. It is used as a part of the system to help determine the appropriate stop loss and take profit levels for a trade. ATR is calculated by taking the average of the true range values over a specified period.
True range is calculated as the maximum of the following values:
-Current high minus the current low
-Absolute value of the current high minus the previous close
-Absolute value of the current low minus the previous close
ATR is a dynamic indicator that changes with changes in volatility. As volatility increases, the value of ATR increases, and as volatility decreases, the value of ATR decreases. By using ATR in NNFX system, traders can adjust their stop loss and take profit levels according to the volatility of the asset being traded. This helps to ensure that the trade is given enough room to move, while also minimizing potential losses.
Other types of volatility include True Range Double (TRD), Close-to-Close, and Garman-Klass
What is a Baseline indicator?
The baseline is essentially a moving average, and is used to determine the overall direction of the market.
The baseline in the NNFX system is used to filter out trades that are not in line with the long-term trend of the market. The baseline is plotted on the chart along with other indicators, such as the Moving Average (MA), the Relative Strength Index (RSI), and the Average True Range (ATR).
Trades are only taken when the price is in the same direction as the baseline. For example, if the baseline is sloping upwards, only long trades are taken, and if the baseline is sloping downwards, only short trades are taken. This approach helps to ensure that trades are in line with the overall trend of the market, and reduces the risk of entering trades that are likely to fail.
By using a baseline in the NNFX system, traders can have a clear reference point for determining the overall trend of the market, and can make more informed trading decisions. The baseline helps to filter out noise and false signals, and ensures that trades are taken in the direction of the long-term trend.
What is a Confirmation indicator?
Confirmation indicators are technical indicators that are used to confirm the signals generated by primary indicators. Primary indicators are the core indicators used in the NNFX system, such as the Average True Range (ATR), the Moving Average (MA), and the Relative Strength Index (RSI).
The purpose of the confirmation indicators is to reduce false signals and improve the accuracy of the trading system. They are designed to confirm the signals generated by the primary indicators by providing additional information about the strength and direction of the trend.
Some examples of confirmation indicators that may be used in the NNFX system include the Bollinger Bands, the MACD (Moving Average Convergence Divergence), and the MACD Oscillator. These indicators can provide information about the volatility, momentum, and trend strength of the market, and can be used to confirm the signals generated by the primary indicators.
In the NNFX system, confirmation indicators are used in combination with primary indicators and other filters to create a trading system that is robust and reliable. By using multiple indicators to confirm trading signals, the system aims to reduce the risk of false signals and improve the overall profitability of the trades.
What is a Continuation indicator?
In the NNFX (No Nonsense Forex) trading system, a continuation indicator is a technical indicator that is used to confirm a current trend and predict that the trend is likely to continue in the same direction. A continuation indicator is typically used in conjunction with other indicators in the system, such as a baseline indicator, to provide a comprehensive trading strategy.
What is a Volatility/Volume indicator?
Volume indicators, such as the On Balance Volume (OBV), the Chaikin Money Flow (CMF), or the Volume Price Trend (VPT), are used to measure the amount of buying and selling activity in a market. They are based on the trading volume of the market, and can provide information about the strength of the trend. In the NNFX system, volume indicators are used to confirm trading signals generated by the Moving Average and the Relative Strength Index. Volatility indicators include Average Direction Index, Waddah Attar, and Volatility Ratio. In the NNFX trading system, volatility is a proxy for volume and vice versa.
By using volume indicators as confirmation tools, the NNFX trading system aims to reduce the risk of false signals and improve the overall profitability of trades. These indicators can provide additional information about the market that is not captured by the primary indicators, and can help traders to make more informed trading decisions. In addition, volume indicators can be used to identify potential changes in market trends and to confirm the strength of price movements.
What is an Exit indicator?
The exit indicator is used in conjunction with other indicators in the system, such as the Moving Average (MA), the Relative Strength Index (RSI), and the Average True Range (ATR), to provide a comprehensive trading strategy.
The exit indicator in the NNFX system can be any technical indicator that is deemed effective at identifying optimal exit points. Examples of exit indicators that are commonly used include the Parabolic SAR, the Average Directional Index (ADX), and the Chandelier Exit.
The purpose of the exit indicator is to identify when a trend is likely to reverse or when the market conditions have changed, signaling the need to exit a trade. By using an exit indicator, traders can manage their risk and prevent significant losses.
In the NNFX system, the exit indicator is used in conjunction with a stop loss and a take profit order to maximize profits and minimize losses. The stop loss order is used to limit the amount of loss that can be incurred if the trade goes against the trader, while the take profit order is used to lock in profits when the trade is moving in the trader's favor.
Overall, the use of an exit indicator in the NNFX trading system is an important component of a comprehensive trading strategy. It allows traders to manage their risk effectively and improve the profitability of their trades by exiting at the right time.
What is an Metamorphosis indicator?
The concept of a metamorphosis indicator involves the integration of two or more GKD indicators to generate a compound signal. This is achieved by evaluating the accuracy of each indicator and selecting the signal from the indicator with the highest accuracy. As an illustration, let's consider a scenario where we calculate the accuracy of 10 indicators and choose the signal from the indicator that demonstrates the highest accuracy.
The resulting output from the metamorphosis indicator can then be utilized in a GKD-BT backtest by occupying a slot that aligns with the purpose of the metamorphosis indicator. The slot can be a GKD-B, GKD-C, or GKD-E slot, depending on the specific requirements and objectives of the indicator. This allows for seamless integration and utilization of the compound signal within the GKD-BT framework.
How does Loxx's GKD (Giga Kaleidoscope Modularized Trading System) implement the NNFX algorithm outlined above?
Loxx's GKD v2.0 system has five types of modules (indicators/strategies). These modules are:
1. GKD-BT - Backtesting module (Volatility, Number 1 in the NNFX algorithm)
2. GKD-B - Baseline module (Baseline and Volatility/Volume, Numbers 1 and 2 in the NNFX algorithm)
3. GKD-C - Confirmation 1/2 and Continuation module (Confirmation 1/2 and Continuation, Numbers 3, 4, and 5 in the NNFX algorithm)
4. GKD-V - Volatility/Volume module (Confirmation 1/2, Number 6 in the NNFX algorithm)
5. GKD-E - Exit module (Exit, Number 7 in the NNFX algorithm)
6. GKD-M - Metamorphosis module (Metamorphosis, Number 8 in the NNFX algorithm, but not part of the NNFX algorithm)
(additional module types will added in future releases)
Each module interacts with every module by passing data to A backtest module wherein the various components of the GKD system are combined to create a trading signal.
That is, the Baseline indicator passes its data to Volatility/Volume. The Volatility/Volume indicator passes its values to the Confirmation 1 indicator. The Confirmation 1 indicator passes its values to the Confirmation 2 indicator. The Confirmation 2 indicator passes its values to the Continuation indicator. The Continuation indicator passes its values to the Exit indicator, and finally, the Exit indicator passes its values to the Backtest strategy.
This chaining of indicators requires that each module conform to Loxx's GKD protocol, therefore allowing for the testing of every possible combination of technical indicators that make up the six components of the NNFX algorithm.
What does the application of the GKD trading system look like?
Example trading system:
Backtest: Multi-Ticker Full GKD Backtest
Baseline: Hull Moving Average
Volatility/Volume: Hurst Exponent
Confirmation 1: Prevailing Trend as shown on the chart above
Confirmation 2: uf2018
Continuation: Coppock Curve
Exit: Rex Oscillator
Metamorphosis: Baseline Optimizer
Each GKD indicator is denoted with a module identifier of either: GKD-BT, GKD-B, GKD-C, GKD-V, GKD-M, or GKD-E. This allows traders to understand to which module each indicator belongs and where each indicator fits into the GKD system.
█ Giga Kaleidoscope Modularized Trading System Signals
Standard Entry
1. GKD-C Confirmation gives signal
2. Baseline agrees
3. Price inside Goldie Locks Zone Minimum
4. Price inside Goldie Locks Zone Maximum
5. Confirmation 2 agrees
6. Volatility/Volume agrees
1-Candle Standard Entry
1a. GKD-C Confirmation gives signal
2a. Baseline agrees
3a. Price inside Goldie Locks Zone Minimum
4a. Price inside Goldie Locks Zone Maximum
Next Candle
1b. Price retraced
2b. Baseline agrees
3b. Confirmation 1 agrees
4b. Confirmation 2 agrees
5b. Volatility/Volume agrees
Baseline Entry
1. GKD-B Baseline gives signal
2. Confirmation 1 agrees
3. Price inside Goldie Locks Zone Minimum
4. Price inside Goldie Locks Zone Maximum
5. Confirmation 2 agrees
6. Volatility/Volume agrees
7. Confirmation 1 signal was less than 'Maximum Allowable PSBC Bars Back' prior
1-Candle Baseline Entry
1a. GKD-B Baseline gives signal
2a. Confirmation 1 agrees
3a. Price inside Goldie Locks Zone Minimum
4a. Price inside Goldie Locks Zone Maximum
5a. Confirmation 1 signal was less than 'Maximum Allowable PSBC Bars Back' prior
Next Candle
1b. Price retraced
2b. Baseline agrees
3b. Confirmation 1 agrees
4b. Confirmation 2 agrees
5b. Volatility/Volume agrees
Volatility/Volume Entry
1. GKD-V Volatility/Volume gives signal
2. Confirmation 1 agrees
3. Price inside Goldie Locks Zone Minimum
4. Price inside Goldie Locks Zone Maximum
5. Confirmation 2 agrees
6. Baseline agrees
7. Confirmation 1 signal was less than 7 candles prior
1-Candle Volatility/Volume Entry
1a. GKD-V Volatility/Volume gives signal
2a. Confirmation 1 agrees
3a. Price inside Goldie Locks Zone Minimum
4a. Price inside Goldie Locks Zone Maximum
5a. Confirmation 1 signal was less than 'Maximum Allowable PSVVC Bars Back' prior
Next Candle
1b. Price retraced
2b. Volatility/Volume agrees
3b. Confirmation 1 agrees
4b. Confirmation 2 agrees
5b. Baseline agrees
Confirmation 2 Entry
1. GKD-C Confirmation 2 gives signal
2. Confirmation 1 agrees
3. Price inside Goldie Locks Zone Minimum
4. Price inside Goldie Locks Zone Maximum
5. Volatility/Volume agrees
6. Baseline agrees
7. Confirmation 1 signal was less than 7 candles prior
1-Candle Confirmation 2 Entry
1a. GKD-C Confirmation 2 gives signal
2a. Confirmation 1 agrees
3a. Price inside Goldie Locks Zone Minimum
4a. Price inside Goldie Locks Zone Maximum
5a. Confirmation 1 signal was less than 'Maximum Allowable PSC2C Bars Back' prior
Next Candle
1b. Price retraced
2b. Confirmation 2 agrees
3b. Confirmation 1 agrees
4b. Volatility/Volume agrees
5b. Baseline agrees
PullBack Entry
1a. GKD-B Baseline gives signal
2a. Confirmation 1 agrees
3a. Price is beyond 1.0x Volatility of Baseline
Next Candle
1b. Price inside Goldie Locks Zone Minimum
2b. Price inside Goldie Locks Zone Maximum
3b. Confirmation 1 agrees
4b. Confirmation 2 agrees
5b. Volatility/Volume agrees
Continuation Entry
1. Standard Entry, 1-Candle Standard Entry, Baseline Entry, 1-Candle Baseline Entry, Volatility/Volume Entry, 1-Candle Volatility/Volume Entry, Confirmation 2 Entry, 1-Candle Confirmation 2 Entry, or Pullback entry triggered previously
2. Baseline hasn't crossed since entry signal trigger
4. Confirmation 1 agrees
5. Baseline agrees
6. Confirmation 2 agrees
█ Connecting to Backtests
All GKD indicators are chained indicators meaning you export the value of the indicators to specialized backtest to creat your GKD trading system. Each indicator contains a proprietary signal generation algo that will only work with GKD backtests. You can find these backtests using the links below.
GKD-BT Giga Confirmation Stack Backtest
GKD-BT Giga Stacks Backtest
GKD-BT Full Giga Kaleidoscope Backtest
GKD-BT Solo Confirmation Super Complex Backtest
GKD-BT Solo Confirmation Complex Backtest
GKD-BT Solo Confirmation Simple Backtest
GKD-M Baseline Optimizer
GKD-M Accuracy Alchemist
GKD-BT Multi-Ticker SCC Backtest
GKD-BT Multi-Ticker SCS Backtest
GKD-BT Multi-Ticker SCS Backtest
GKD-BT Multi-Ticker Full GKD Backtest

Prevailing Trend IndicatorOVERVIEW
The Prevailing Trend indicator is a technical indicator that gauges whether the price is currently trending up or down. The purpose of this indicator is to call and/or filter with-trend signals.
CONCEPTS
This indicator assists traders in identifying high-probability trend entries. The upper line (blue line on the indicator) is calculated by taking the average range (high-low) of all bullish candles. The lower line (red line on the indicator) is calculated by taking the average range of all bearish candles. When these two lines intersect and cross each other, a buy and sell signal is generated. For example, if the blue line crosses over the red line, this indicates that the average size of all bullish bars are larger than the average size of all bearish bars. This is a good sign that an uptrend might occur. Vice versa for downtrends.
HOW DO I READ THIS INDICATOR
As an entry indicator:
When the blue line crosses over the red line, go long.
When the red line crosses over the blue line, go short.
As a signal filter:
If the blue line is above the red line, only take long trades.
If the red line is above the blue line, only take short trades.

GKD-C Precision Trend [Loxx]The Giga Kaleidoscope GKD-C Precision Trend is a confirmation module included in Loxx's "Giga Kaleidoscope Modularized Trading System."
█ Giga Kaleidoscope GKD-C Precision Trend
The Precision Trend indicator is a type of price trend indicator that is calculated based on a certain period and sensitivity level. It uses a Simple Moving Average (SMA) and the range of price (high and low) within a specific period.
Here's a high-level conceptual overview of how it works:
Period & Sensitivity: The Precision Trend indicator first takes in two inputs: the period and sensitivity. The period specifies how many past periods (like days, hours, etc. based on the chart's timeframe) should be considered when calculating the indicator. Sensitivity is a factor that allows users to adjust how reactive the trend indicator is to price changes.
Calculate the SMA: The indicator starts by calculating the Simple Moving Average (SMA) of the price range (high minus low) over the defined period. This average is then scaled by the sensitivity.
Set Initial Variables: Several variables are initialized to represent the trend, adjusted closing price values, and other factors used in determining the trend.
Trend Determination: Based on whether the trend in the previous period was upwards, downwards, or non-existent, different logic is applied. Essentially, the algorithm checks the relationship between the current closing price and adjusted high and low values to determine if the trend should switch or continue.
If there was no trend previously, the closing price is compared to the adjusted high and low values. If the closing price is greater than the adjusted high value, an upward trend is established. If the closing price is less than the adjusted low value, a downward trend is established.
If the trend was upwards previously, it checks if the current closing price has dropped below the adjusted low value, which might signal a trend reversal to a downward trend.
If the trend was downwards previously, it checks if the current closing price has risen above the adjusted high value, which might signal a trend reversal to an upward trend.
The Precision Trend indicator gives traders an idea about the trend in the market, helping them decide when to enter or exit trades based on the trend direction and possible trend reversals.
█ Giga Kaleidoscope Modularized Trading System
Core components of an NNFX algorithmic trading strategy
The NNFX algorithm is built on the principles of trend, momentum, and volatility. There are six core components in the NNFX trading algorithm:
1. Volatility - price volatility; e.g., Average True Range, True Range Double, Close-to-Close, etc.
2. Baseline - a moving average to identify price trend
3. Confirmation 1 - a technical indicator used to identify trends
4. Confirmation 2 - a technical indicator used to identify trends
5. Continuation - a technical indicator used to identify trends
6. Volatility/Volume - a technical indicator used to identify volatility/volume breakouts/breakdown
7. Exit - a technical indicator used to determine when a trend is exhausted
8. Metamorphosis - a technical indicator that produces a compound signal from the combination of other GKD indicators*
*(not part of the NNFX algorithm)
What is Volatility in the NNFX trading system?
In the NNFX (No Nonsense Forex) trading system, ATR (Average True Range) is typically used to measure the volatility of an asset. It is used as a part of the system to help determine the appropriate stop loss and take profit levels for a trade. ATR is calculated by taking the average of the true range values over a specified period.
True range is calculated as the maximum of the following values:
-Current high minus the current low
-Absolute value of the current high minus the previous close
-Absolute value of the current low minus the previous close
ATR is a dynamic indicator that changes with changes in volatility. As volatility increases, the value of ATR increases, and as volatility decreases, the value of ATR decreases. By using ATR in NNFX system, traders can adjust their stop loss and take profit levels according to the volatility of the asset being traded. This helps to ensure that the trade is given enough room to move, while also minimizing potential losses.
Other types of volatility include True Range Double (TRD), Close-to-Close, and Garman-Klass
What is a Baseline indicator?
The baseline is essentially a moving average, and is used to determine the overall direction of the market.
The baseline in the NNFX system is used to filter out trades that are not in line with the long-term trend of the market. The baseline is plotted on the chart along with other indicators, such as the Moving Average (MA), the Relative Strength Index (RSI), and the Average True Range (ATR).
Trades are only taken when the price is in the same direction as the baseline. For example, if the baseline is sloping upwards, only long trades are taken, and if the baseline is sloping downwards, only short trades are taken. This approach helps to ensure that trades are in line with the overall trend of the market, and reduces the risk of entering trades that are likely to fail.
By using a baseline in the NNFX system, traders can have a clear reference point for determining the overall trend of the market, and can make more informed trading decisions. The baseline helps to filter out noise and false signals, and ensures that trades are taken in the direction of the long-term trend.
What is a Confirmation indicator?
Confirmation indicators are technical indicators that are used to confirm the signals generated by primary indicators. Primary indicators are the core indicators used in the NNFX system, such as the Average True Range (ATR), the Moving Average (MA), and the Relative Strength Index (RSI).
The purpose of the confirmation indicators is to reduce false signals and improve the accuracy of the trading system. They are designed to confirm the signals generated by the primary indicators by providing additional information about the strength and direction of the trend.
Some examples of confirmation indicators that may be used in the NNFX system include the Bollinger Bands, the MACD (Moving Average Convergence Divergence), and the MACD Oscillator. These indicators can provide information about the volatility, momentum, and trend strength of the market, and can be used to confirm the signals generated by the primary indicators.
In the NNFX system, confirmation indicators are used in combination with primary indicators and other filters to create a trading system that is robust and reliable. By using multiple indicators to confirm trading signals, the system aims to reduce the risk of false signals and improve the overall profitability of the trades.
What is a Continuation indicator?
In the NNFX (No Nonsense Forex) trading system, a continuation indicator is a technical indicator that is used to confirm a current trend and predict that the trend is likely to continue in the same direction. A continuation indicator is typically used in conjunction with other indicators in the system, such as a baseline indicator, to provide a comprehensive trading strategy.
What is a Volatility/Volume indicator?
Volume indicators, such as the On Balance Volume (OBV), the Chaikin Money Flow (CMF), or the Volume Price Trend (VPT), are used to measure the amount of buying and selling activity in a market. They are based on the trading volume of the market, and can provide information about the strength of the trend. In the NNFX system, volume indicators are used to confirm trading signals generated by the Moving Average and the Relative Strength Index. Volatility indicators include Average Direction Index, Waddah Attar, and Volatility Ratio. In the NNFX trading system, volatility is a proxy for volume and vice versa.
By using volume indicators as confirmation tools, the NNFX trading system aims to reduce the risk of false signals and improve the overall profitability of trades. These indicators can provide additional information about the market that is not captured by the primary indicators, and can help traders to make more informed trading decisions. In addition, volume indicators can be used to identify potential changes in market trends and to confirm the strength of price movements.
What is an Exit indicator?
The exit indicator is used in conjunction with other indicators in the system, such as the Moving Average (MA), the Relative Strength Index (RSI), and the Average True Range (ATR), to provide a comprehensive trading strategy.
The exit indicator in the NNFX system can be any technical indicator that is deemed effective at identifying optimal exit points. Examples of exit indicators that are commonly used include the Parabolic SAR, the Average Directional Index (ADX), and the Chandelier Exit.
The purpose of the exit indicator is to identify when a trend is likely to reverse or when the market conditions have changed, signaling the need to exit a trade. By using an exit indicator, traders can manage their risk and prevent significant losses.
In the NNFX system, the exit indicator is used in conjunction with a stop loss and a take profit order to maximize profits and minimize losses. The stop loss order is used to limit the amount of loss that can be incurred if the trade goes against the trader, while the take profit order is used to lock in profits when the trade is moving in the trader's favor.
Overall, the use of an exit indicator in the NNFX trading system is an important component of a comprehensive trading strategy. It allows traders to manage their risk effectively and improve the profitability of their trades by exiting at the right time.
What is an Metamorphosis indicator?
The concept of a metamorphosis indicator involves the integration of two or more GKD indicators to generate a compound signal. This is achieved by evaluating the accuracy of each indicator and selecting the signal from the indicator with the highest accuracy. As an illustration, let's consider a scenario where we calculate the accuracy of 10 indicators and choose the signal from the indicator that demonstrates the highest accuracy.
The resulting output from the metamorphosis indicator can then be utilized in a GKD-BT backtest by occupying a slot that aligns with the purpose of the metamorphosis indicator. The slot can be a GKD-B, GKD-C, or GKD-E slot, depending on the specific requirements and objectives of the indicator. This allows for seamless integration and utilization of the compound signal within the GKD-BT framework.
How does Loxx's GKD (Giga Kaleidoscope Modularized Trading System) implement the NNFX algorithm outlined above?
Loxx's GKD v2.0 system has five types of modules (indicators/strategies). These modules are:
1. GKD-BT - Backtesting module (Volatility, Number 1 in the NNFX algorithm)
2. GKD-B - Baseline module (Baseline and Volatility/Volume, Numbers 1 and 2 in the NNFX algorithm)
3. GKD-C - Confirmation 1/2 and Continuation module (Confirmation 1/2 and Continuation, Numbers 3, 4, and 5 in the NNFX algorithm)
4. GKD-V - Volatility/Volume module (Confirmation 1/2, Number 6 in the NNFX algorithm)
5. GKD-E - Exit module (Exit, Number 7 in the NNFX algorithm)
6. GKD-M - Metamorphosis module (Metamorphosis, Number 8 in the NNFX algorithm, but not part of the NNFX algorithm)
(additional module types will added in future releases)
Each module interacts with every module by passing data to A backtest module wherein the various components of the GKD system are combined to create a trading signal.
That is, the Baseline indicator passes its data to Volatility/Volume. The Volatility/Volume indicator passes its values to the Confirmation 1 indicator. The Confirmation 1 indicator passes its values to the Confirmation 2 indicator. The Confirmation 2 indicator passes its values to the Continuation indicator. The Continuation indicator passes its values to the Exit indicator, and finally, the Exit indicator passes its values to the Backtest strategy.
This chaining of indicators requires that each module conform to Loxx's GKD protocol, therefore allowing for the testing of every possible combination of technical indicators that make up the six components of the NNFX algorithm.
What does the application of the GKD trading system look like?
Example trading system:
Backtest: Multi-Ticker Full GKD Backtest
Baseline: Hull Moving Average
Volatility/Volume: Hurst Exponent
Confirmation 1: Precision Trendf as shown on the chart above
Confirmation 2: uf2018
Continuation: Coppock Curve
Exit: Rex Oscillator
Metamorphosis: Baseline Optimizer
Each GKD indicator is denoted with a module identifier of either: GKD-BT, GKD-B, GKD-C, GKD-V, GKD-M, or GKD-E. This allows traders to understand to which module each indicator belongs and where each indicator fits into the GKD system.
█ Giga Kaleidoscope Modularized Trading System Signals
Standard Entry
1. GKD-C Confirmation gives signal
2. Baseline agrees
3. Price inside Goldie Locks Zone Minimum
4. Price inside Goldie Locks Zone Maximum
5. Confirmation 2 agrees
6. Volatility/Volume agrees
1-Candle Standard Entry
1a. GKD-C Confirmation gives signal
2a. Baseline agrees
3a. Price inside Goldie Locks Zone Minimum
4a. Price inside Goldie Locks Zone Maximum
Next Candle
1b. Price retraced
2b. Baseline agrees
3b. Confirmation 1 agrees
4b. Confirmation 2 agrees
5b. Volatility/Volume agrees
Baseline Entry
1. GKD-B Baseline gives signal
2. Confirmation 1 agrees
3. Price inside Goldie Locks Zone Minimum
4. Price inside Goldie Locks Zone Maximum
5. Confirmation 2 agrees
6. Volatility/Volume agrees
7. Confirmation 1 signal was less than 'Maximum Allowable PSBC Bars Back' prior
1-Candle Baseline Entry
1a. GKD-B Baseline gives signal
2a. Confirmation 1 agrees
3a. Price inside Goldie Locks Zone Minimum
4a. Price inside Goldie Locks Zone Maximum
5a. Confirmation 1 signal was less than 'Maximum Allowable PSBC Bars Back' prior
Next Candle
1b. Price retraced
2b. Baseline agrees
3b. Confirmation 1 agrees
4b. Confirmation 2 agrees
5b. Volatility/Volume agrees
Volatility/Volume Entry
1. GKD-V Volatility/Volume gives signal
2. Confirmation 1 agrees
3. Price inside Goldie Locks Zone Minimum
4. Price inside Goldie Locks Zone Maximum
5. Confirmation 2 agrees
6. Baseline agrees
7. Confirmation 1 signal was less than 7 candles prior
1-Candle Volatility/Volume Entry
1a. GKD-V Volatility/Volume gives signal
2a. Confirmation 1 agrees
3a. Price inside Goldie Locks Zone Minimum
4a. Price inside Goldie Locks Zone Maximum
5a. Confirmation 1 signal was less than 'Maximum Allowable PSVVC Bars Back' prior
Next Candle
1b. Price retraced
2b. Volatility/Volume agrees
3b. Confirmation 1 agrees
4b. Confirmation 2 agrees
5b. Baseline agrees
Confirmation 2 Entry
1. GKD-C Confirmation 2 gives signal
2. Confirmation 1 agrees
3. Price inside Goldie Locks Zone Minimum
4. Price inside Goldie Locks Zone Maximum
5. Volatility/Volume agrees
6. Baseline agrees
7. Confirmation 1 signal was less than 7 candles prior
1-Candle Confirmation 2 Entry
1a. GKD-C Confirmation 2 gives signal
2a. Confirmation 1 agrees
3a. Price inside Goldie Locks Zone Minimum
4a. Price inside Goldie Locks Zone Maximum
5a. Confirmation 1 signal was less than 'Maximum Allowable PSC2C Bars Back' prior
Next Candle
1b. Price retraced
2b. Confirmation 2 agrees
3b. Confirmation 1 agrees
4b. Volatility/Volume agrees
5b. Baseline agrees
PullBack Entry
1a. GKD-B Baseline gives signal
2a. Confirmation 1 agrees
3a. Price is beyond 1.0x Volatility of Baseline
Next Candle
1b. Price inside Goldie Locks Zone Minimum
2b. Price inside Goldie Locks Zone Maximum
3b. Confirmation 1 agrees
4b. Confirmation 2 agrees
5b. Volatility/Volume agrees
Continuation Entry
1. Standard Entry, 1-Candle Standard Entry, Baseline Entry, 1-Candle Baseline Entry, Volatility/Volume Entry, 1-Candle Volatility/Volume Entry, Confirmation 2 Entry, 1-Candle Confirmation 2 Entry, or Pullback entry triggered previously
2. Baseline hasn't crossed since entry signal trigger
4. Confirmation 1 agrees
5. Baseline agrees
6. Confirmation 2 agrees
█ Connecting to Backtests
All GKD indicators are chained indicators meaning you export the value of the indicators to specialized backtest to creat your GKD trading system. Each indicator contains a proprietary signal generation algo that will only work with GKD backtests. You can find these backtests using the links below.
GKD-BT Giga Confirmation Stack Backtest
GKD-BT Giga Stacks Backtest
GKD-BT Full Giga Kaleidoscope Backtest
GKD-BT Solo Confirmation Super Complex Backtest
GKD-BT Solo Confirmation Complex Backtest
GKD-BT Solo Confirmation Simple Backtest
GKD-M Baseline Optimizer
GKD-M Accuracy Alchemist
GKD-BT Multi-Ticker SCC Backtest
GKD-BT Multi-Ticker SCS Backtest
GKD-BT Multi-Ticker SCS Backtest
GKD BT Multi-Ticker Full GKD Backtest
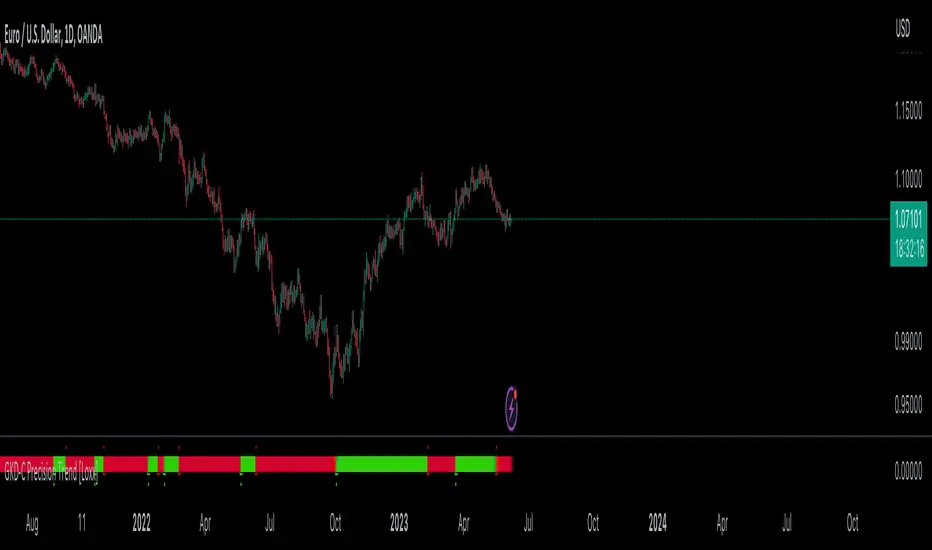
Diddly - Real Volume TrendDiddly Real Volume Trend is an indicator to help traders identify the real trending direction of an asset, it achieves this by using liquidity to assess the overall buying and selling volume sentiment of a market place.
What is Liquidity
Liquidity refers to the ability of an asset to be turned into cash. Cash is the more liquid form of any asset, whereas selling a house would take a little longer to liquidate and convert to cash. Liquidity in financial markets is in essence based on the same principle and refers to how easily an asset can be bought and sold.
Liquidity in simple terms is the volume of participants who are willing to be involved in the market at any given time. Markets are based on auction theory, the more participants who want to buy at a certain price than sell, will dictate that the price goes up. As a result it is important to understand the role that volume has in financial markets, as volume will directly correlate to liquidity and supply and demand.
What does it mean?
Although markets are based on auction theory, sadly we don't have the advantage of a traditional auction, where we are all sitting in a room putting our hands in the air when we are interested in paying x price for a particular item. In this environment it is very clear to see how popular the item for sale is and whether it is possible to pick up a bargain.
Being able to identify the prevailing direction of buying versus selling volume on a chart provides an insight into market sentiment. Also we have to consider that typically most retail traders participate in very liquid markets, where you can get in and out of a position with relative ease.
There are obviously exceptions, extremely low float stocks, but on the whole with liquid assets it takes some big orders to move price, especially with currencies and high float stocks. Understanding these principles helps us as retail traders identify where the big money is seeing a bargain, if buying or overpriced if selling.
However you identify liquidity, I hope you agree that it is an extremely important element to be considering before taking a trade. The last thing any trader wants to be doing if they can avoid it, is getting on the wrong side of the market.
Just as a side note, high and low "Float Stocks" refers to the number of shares in general circulation for buying and selling.
What is "Diddly Real Volume Trend"
This volume trend indicator in simple terms will display the combined accumulated bullish and bearish volume within a window below the main chart. What you will see is a line chart that will be doing one of three things. Either it could be stair stepping in an upwards direction, identifying that we are in a bullish trend or stepping down in a bearish trend. Alternatively it could just be going sideways, which would suggest a ranging market.
This enables traders to make an assessment of the market sentiment using the liquidity direction that it has identified. This can help form an overall daily bias for intra-day traders or help confirm a longer term trend for swing traders.
Although this indicator is not a true oscillator (where the limits of number are fixed between a known upper and lower limit) , it can still be extremely useful in identifying divergence in price and the volume sentiment. As well as assisting in the process of identifying and confirming peak formations and potential reversal points in a market.
How does it Work
The indicator is plotting the volume trend line based on the output of a set of volume calculations, which is confirmed on the close of each candle. The resultant output is either a positive (Bullish sentiment) or negative (Bearish Sentiment), which are all totalled up to show the next point on the graph. As a result the visual effect seen from this process is that the more bullish calculated volume identified than bearish, you will see a rising trend line and the reverse for a bearish market.
The algo calculation which is used on each candle and its related volume is using the following elements.
Volume
Rate of Change
Relative Strength
The indicator is not just looking at the volume total and saying this is a green candle and must provide a positive number. It is looking for the volume and liquidity extremes and filtering out the nothingness of a market that makes no difference to price either way. It is from using these extremes that the indicator is able to plot the activities and direction of the big money in the market.
What is the Indicator Showing me?
Examples:
Here on a stock VKTX, on a 1 minute chart the elements that make up the indicator are annotated on the chart.
There are 6 components highlighted in the above chart, these have been listed below.
Volume Trend Line
This is the indicator driving line and is the result of the calculations described in the previous section.
Fast Moving Average
This is the fast moving average of the "Volume Trend Line". The moving average type and length can be changed in the settings.
(Default = Exponential Moving Average, Length: 60)
Slow Moving Average
This is a slower moving average of the "Volume Trend Line". The moving average type and length can be changed in the settings.
(Default = Hull Moving Average, Length: 3500)
Long Term Moving Average
This is a long term moving average of the "Volume Trend Line". The moving average type and length can be changed in the settings.
(Default = Exponential Moving Average, Length: 400)
Bullish Confirmation
On the "Volume Trend Line", you will see coloured circles dotted along the line, the green circles signifying Bullish Confirmation.
Bearish Confirmation
On the "Volume Trend Line", you will see coloured circles dotted along the line, the red circles signifying Bearish Confirmation.
The Bullish and Bearish confirmation signals are not signals to take trades, they are there to highlight the predominant direction. Seeing one confirmation signal in isolation is not that helpful, but continued prints of confirmation in a single direction would be interesting.
There are a further two signal types that are displayed on the volume trend line, these should be seen infrequently across charts and represent potential extremes of price movement in a single direction. These signals act as a warning that price could stall in this area or potentially make a reversal. As with the other signals within this indicator they are not signals to buy or sell, they are there to provide warning alerts and should be considered with other pieces of information that you are working with.
Bullish Extreme
Plotted on the "Volume Trend Line", you will occasionally see a green coloured downwardly pointing triangle, this represents a Bullish Extreme.
GBPAUD Hourly chart October 2022
Bearish Extreme
Plotted on the "Volume Trend Line", you will occasionally see a red coloured upward pointing triangle, this represents a Bearish Extreme.
GBPAUD Daily chart (February - April) 2023
How Does It Help?
This indicator will compliment any existing strategy and is not intended to be used standalone.
It can be used on any chart from a monthly, one minute to one second, depending on your trading strategy. Using multiple time frame analysis can help traders with a number of decisions that need to be considered before taking entries.
What is my market direction bias?
This can be taken from an hourly for intraday trader or daily for swing traders. What that time frame is depends on your trading plan and objectives from the trades you take.
When do I take my trades?
Again depending on the trading strategy used will dictate many aspect of this decision, although using the volume trend on a lower time frame, can help confirm breakouts, reversals and divergence.
How should I manage my trade?
With any trade you should have a defined risk reward clearly defined, with stops and targets in mind before taking an entry.
The age old saying of "cut your losses quickly and let your winner run", is easier said than mastered. Once in a trade the volume trend can be really helpful to identify trades that could be real runners and allows you to change expectations after entering the trade. Maybe you want to take some profit at the original point and let the remaining run. Maybe there is such strength you want to add to the position. Being able to assess market sentiment once in a trade can help with optimising returns.
The "Volume Trend Line", which is the driving element of this indicator, will be doing one of three things. Either it could be stair stepping in an upwards direction, identifying that we are in a bullish trend, stepping down in a bearish trend or going sideways in a ranging market.
Bullish Volume Trending Market
Here is stock VKTX, on a 1 minute chart. Trend confirmation on price action is determined by Higher Highs and Higher Lows for an uptrend or Lower Lows and Lower Highs on a downtrend. The same principle applies for the volume trend line.
In this example we first see breakout volume on the indicator with the Bullish Break volume, following that the volume trend keeps making higher highs and higher lows, confirming that this asset has short-term upwards potential. (why short-term? this is the 1 minute chart, you would want to consult the daily or hourly for a longer term perspective).
Price also is making higher highs and higher lows, which is in alignment with the indicator and known as "convergence" and is a positive signal for a continued trend.
Bearish Market
So here on Tesla (TSLA) on the 4 hour chart we can see the big sell off that started in April 2022. Where it clearly shows a downward trend, with lots of confirmation for continuation.
Ranging Markets
On this example on the AUDJPY 1 Hour chart, we can see that price is in a ranging market. By drawing trend lines on price and the indicator, it is clear to see that price and the volume trend line are both showing a ranging market. What is more interesting is the structure of the ranges.
The price range at the top of the chart is in an upward direction, whereas the volume trend in the bottom window is showing a downward range. Giving us an early indication of what to expect from this asset.
Diverging Markets
"Divergence" is a very powerful mechanism for identifying potential reversal points in price actions. There is a wealth of published information on this topic which is well worth reviewing, if this is a new principle to you.
Here again on the same AUDJPY 1 Hour chart example, points of interest have been annotated on the chart where the historical range turns into a step down to the next level within the market cycle, as predicted by the divergence in range patterns, price point up and volume pointing down.
In the above example, after identifying the divergence the next most important element is an extremely fast accelerated move down which breaks the lower level of the range, this can be seen on the right side of the bottom window and is labelled "Bearish Breaking Volume".
What is interesting here is that the volume indicator has identified the range breakout when price was still above the lower level of the range. Following that break out volume signal, if we zoom out to a 4 hour chart to see what happened next.
The range breakout was confirmed and price and the volume trend continues to show a downward direction in the market. As for entries and stops that is not the intention of this indicator and will be down to other elements in your trading strategy or in our case other indicators.
Peak Formations
Peak formation refers to the point where an asset is over extended in one direction and there is a potential of change in direction, with a wider pullback or a reversal in the higher time frame trend. These formations are often seen with double bottoms (W patterns) or double tops (M patterns) . Unfortunately these patterns appear all over the chart and trading them in isolation will be challenging.
In this example of EURJPY on the 1 hour chart, we see price and the indicator in the bottom window for the first 3 weeks in March 2022. The pair is trending down which is confirmed by both price and the indicator. There are no signals points plotted on the volume trend line, until one appears on March 4th 2022.
Another one appeared on the next trading day of Monday the 7th and we now have these two signals relatively close to each other. This is interesting information, especially considering that there was no extreme signals for the previous couple of months.
Later that day the volume trend broke the previous volume level, after a W pattern was completed and a green bullish confirmation signal was printed. The following day another bullish confirmation signal is displayed to further confirm that we had made a peak formation reversal.
Please note that using the settings style tab, has enabled the change to the bearish extremes signal, changing the colour and shape to be an orange circle. Which for the purposes of this illustration is easier to see.
Another example of the same pair in August 2022, with a very similar confirmation sequence.
Stock Examples
Here on UBER on a 1 hour chart , is an example of how the indicator can be used in confluence with other trading strategies. If a trader was trading candle patterns, they may see this classic 1 hour bull flag pattern forming.
Without the volume trend analysis this looks like a good buy setup. Adding this analysis to the chart we clearly have a different view point.
Here is what subsequently happened to price and this is in a generally bullish market March 2023.
Scalping Entries
For those traders who work with super fast time frames like the 5 second or even on a 1 second charts, the volume indicator can be used to help time entries as a part of a wider trading strategy of trading a pullback or trading support and resistance levels.
Styling options in the indicator settings enabled this different view of the indicator output, which can be extremely useful for timing entries.
Here on this hot IPO stock, LUNR from February 16th 2023, we have an extremely strong move up from $13.80 to $18.00. One aspect of this move up, is that it is doing this on extremely light volume and the predominant market sentiment on the surface seems very bearish.
This would be a clear indication not to trade this stock at this moment in time, as a trader there would be lots of emotions of FOMO (fear of missing out) , seeing a stock making that kind off move on a new IPO - there is the sense that this stock will go to the moon and your not going to be involved.
As traders we have to consider the risk : reward potential. This stock could drop to $10.00 if someone put in a 50 k market sell order, as it is clear there are not the buyers to support that kind of liquidation.
The following charts are in the 5 second time frame, until otherwise stated
So we need to wait for some confirmation of buying liquidity before we can make any plans for taking an entry, which we get in the form of a couple of strong bullish candles on the chart below. Interestingly the price breaks the previous all time high for this stock, although the volume trend at this stage does not seem strong enough to consider an entry.
At this point we should be on the lookout for further buying liquidity, ideally to break the previous high volume line, which appears in the next chart. This would be the time to take an entry based on other aspects of a trading plan.
Having now taken an entry, we can use the indicator to understand the strength of the buying liquidity and identify areas where we should be looking to take profit or close out the trade. Looking at the volume trend profile shown in the chart below, there is no reason not to hold this stock for a wider move up.
In the next chart we see the first signs of some selling pressure, as the indicator shows signs of red. This would be the area to take some profit and look at a higher time frame perspective, to get the sense of whether to hold the remaining position.
Here on the 5 minute time frame the volume trend is still looking very strong to hold the remaining position. As it turned out it was a good place to take profit as it was just under the high of the day.
Knowing when an asset is going to reverse is not easy and this stock was way too over extended and a top had to finally come. This one minute view of the indicator, shows the point where you would see that the upward liquidity was over and you were now on the backside of the move, with no reason to trade further.
Here on a 15 minute chart you can see the full extent of the move and its reversal back to the original price. It provides a clear illustration that chasing trades through FOMO or holding and hoping is not a profitable approach. Being able to time your entries and exits, where you can clearly manage risk is one of the most important elements to any traders strategy.
This is an extreme example and not something you see every day in any market. It has been included within this narrative with the hope that it clearly illustrates the risk involved in trading and being able to mitigate them, has to be at the forefront of your mind.
Key Settings
Within the indicator settings there are a number of options that are available to users. All aspects of what you can see can either be changed or turned on or off in the "Style" tab as well as changing the colours and their transparency.
The available settings on the "Inputs" tab are for fine tuning the indicator to your style of trading. This fine tuning can be applied to the moving averages that can be displayed and follow the volume trend line as well as the volume filtering process.
The most important ones that are in need of explanation are outline below:
General Settings
"What type of asset is the Algo looking at" : Available Options = "Small Caps", "Large Caps", "Futures", "Currencies" (Default Setting = Currencies)
The indicator will make an assessment of the best settings to use as defaults for the volume filtering, confirmation and extremes signals. The defaults can be changed in the following sections using the override.
"Turn on Turbo Mode" : True or False (Default Settings = True)
This setting will give the indicator volume filtering processes a boost
Signal Settings
Based on the "Asset Type" from the general settings, the indicator will make an assessment of the best settings to use by default. These can be changed by using the settings below.
"Override Default Assessment Thresholds" = True / False
"Percentage Difference to Signify Trend Confirmation" = A percentage value that will tell the indicator how to identify the volume trend line swing points used to identify bullish or bearish confirmation signals. Values from 0.1 to 10 would make the most sense. A too high setting and you will not see any confirmation points plotted. Too low and you may see too many to be useful.
"Percentage Difference to Signify Extremes" = A percentage value that will tell the indicator how to identify the volume trend line swing points used to identify bullish or bearish confirmation signals. Values from 20 to 200 would make the most sense. A low a setting and you will see too many extreme points plotted.
Filter Settings
"Turn On Volume Assessment Filters" = True / False : The volume assessment filters are used to focus the "volume trend line" on higher volume extremes.
Based on the "Asset Type" from the general settings, the indicator will make an assessment of the best settings to use by default. These can be changed by using the settings below.
"Override Default Assessment Filters" = True / False
"Filter Volume using Setting" = The number used in this setting represents a value from 0 to 100. Zero will filter out no volume, whereas 100 would filter it all out. The default setting is 1, as there is a danger of setting this number too high and all you will see in the line chart is big steps up and down, with a plateaus in the middle. Which may be useful, although it would not be so helpful in divergence or volume line breaks.
Fast Moving Average
This is the fast moving average of the "Volume Trend Line".
"Moving Average Type" = The type of moving average calculation to be applied.
Default = "EMA"
Available Options: "SMA","EMA" ,"HMA" ,"SMMA (RMA)" ,"WMA" ,"VWMA"
Moving Average Key
SMA : Simple Moving Average
EMA : Exponential Moving Average
HMA : Hull Moving Average
SMMA (RMA) : Exponentially Weighted Moving Average (alpha = 1 / length.)
WMA : Weighted Moving Average
VWMA : Volume Weighted Moving Average
"Moving Average Length" = The number of candles back into the chart used to calculate the Moving Average. (The higher the number, the slower the moving average becomes)
Default Length = 60
"Apply Double Smoothing" = True or False : This is an option to turn on if an extra smoothing effect to the moving average if required.
Slow Moving Average
This is the slow moving average of the "Volume Trend Line".
"Moving Average Type" = The type of moving average calculation to be applied.
Default = "HMA"
Available Options: "SMA","EMA" ,"HMA" ,"SMMA (RMA)" ,"WMA" ,"VWMA"
(See moving average key)
"Moving Average Length" = The number of candles back into the chart used to calculate the Moving Average. (The higher the number, the slower the moving average becomes)
Default Length = 3500
(By default we have a higher number for the slow length compared to the long term length in the next setting. This is because using the Hull Moving Average, is an accelerated moving average that needs higher values to slow it down. If you were to change this to say an EMA, then you would need to change the length to something like 200, to put this slower moving average in context with the others).
Long Term Moving Average
This is a long term moving average of the "Volume Trend Line".
"Moving Average Type" = The type of moving average calculation to be applied.
Default = "EMA"
Available Options: "SMA","EMA" ,"HMA" ,"SMMA (RMA)" ,"WMA" ,"VWMA"
(See moving average key)
"Moving Average Length" = The number of candles back into the chart used to calculate the Moving Average. (The higher the number, the slower the moving average becomes)
Default Length = 400
"Apply Double Smoothing" = True or False : This is an option to turn on if an extra smoothing effect to the moving average if required.
Finally
We greatly appreciate the support and feedback from the Trading View community, and we are dedicated to continuing to improve our indicators with your support.
We want to help you manage risk, and that's why we emphasise that trading is risky and any technology used to support our trading decisions is based on information from the past. We encourage traders to take responsibility for their trading businesses and always prioritise risk management.

Steel Step Assistant: Trend Visualizer + Divergence Signal 1.0Disclaimer: Nobody should use this indicator as a confirmation signal for entry/exit for your trades. Please message me on how to use this indicator correctly. This indicator was designed to be used in conjunction with my Steel Step strategy, hence the name.
This indicator simply gives you a signal of trend reversals.
The trend visualizer is an ordinary table that shows you the trends of different time frames.
The signal is designed with the Steel Step strategy for determining the more important reversals/pivots.
Being an indicator, it is prone to a certain extent of inaccuracy. It is programmed to provide an accurate market trend reversal to the best of its abilities.
Always remember that the Steel Step strategy does not rely on indicators to trade.
This indicator can be used on all charts and markets; crypto, commodities, forex, stock, indices, etc.
It is suitable for intra-day traders. Another version with all time frames is being made as I publish this.
One way of using this is to enhance your information gathering on trends in order to understand the market structure or direction better.
This indicator helps educate users on the market structure. Users can quickly break down the market into layers, analyze the layers and connect them all to understand the market as a whole. After users understand the market, users need to decide and choose a specific trend they want to trade. The basic idea is to flow with the market.
This indicator can be combined with EW theory to understand the market structure easily.
When I understand the whole market structure, it boosts my trading performance to the maximum.
The user inputs (settings) should be very straightforward. The default settings produce directions that are very similar to what I use for my strategy. You can change the settings as desired.
The default settings are configured to show you the trend reversal or market direction of "one layer" above "the current time frame layer". You can find educational materials about the layer logic from my Steel Step strategy.
Find the instructions on how to view signals below.
***SIGNAL GUIDE***
To view signals/set signal alerts:
- To view 15min signals, use 3min chart
- To view 1H signals, use 15min chart
A second version to include more time frames and trends will be published soon. Look forward to it!
Please comment below or message me if you have any questions. Enjoy!
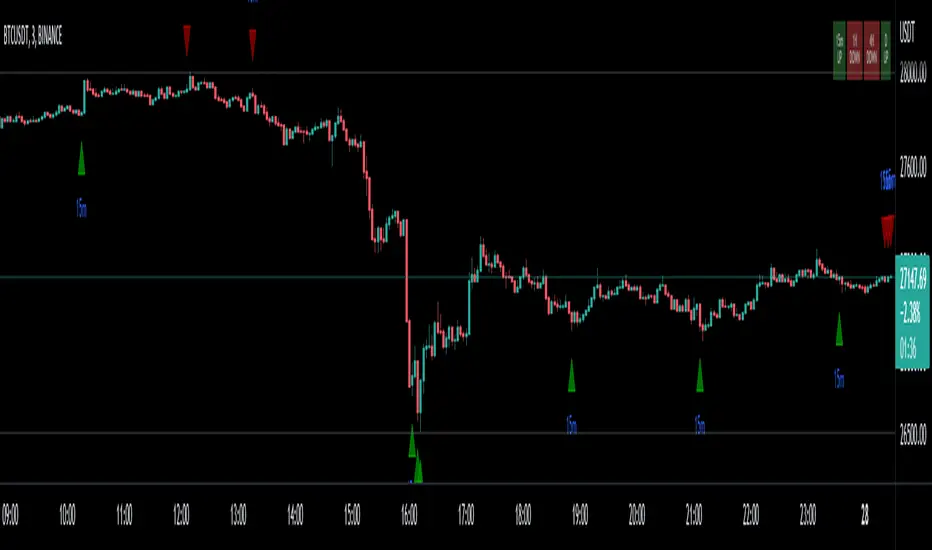
Pivot Trendlines with Breaks [HG]🧾 Pivot Trendlines and Breaks
A script meant to debut and provide an example usage of the Simple Trendlines library using Pine Script's built-in pivot system.
In under 50 lines of code, with inputs, plots, styling, and alerts included we're able to create trendlines with a breakout system.
▶️ How it works
Calculating pivot points helps traders identify moments at which the market's attitude can shift from bullish to bearish. In the background, the script tracks pivot events for trendlines and uses a system that prevents any leakage between the trendlines before they are drawn.
⚫️ Settings
Pivot Length
Color Adjustments
⚫️ Alerts

TRENDCATOR - Trend Of IndicatorsHello Traders :)
I am Only Fibonacci.
I would like to give you detailed information about this indicator that I have prepared.
With this tool you add to your chart, you can automatically draw the falling trend and rising trend lines of many indicators.
I've prepared a few extra nice things for you. With this indicator, you can see the instantaneous values of active trend lines and their distance from the indicator value.
We are now ready to introduce.
You can use this indicator in two languages. English and Turkish. The choice is yours.
When we enter the indicator settings, there is a group under the TREND heading. With the settings in this group, you can determine the sensitivity of the trends to be plotted. The lower the sensitivity, the less reliable the plotted trends will be. I am sure you will find the middle ground.
Trends are calculated by relationships between all detected peaks.
If you check the Show Data box, you can see the value of the active (unbroken) trends in the current candle. Sometimes it can create visual pollution. So you can remove it. Below will be a version view where the values of the trendlines are visible.
With this tool, you can add any indicator you choose from the settings section to the chart and draw the trend lines automatically.
You can add RSI, ATR, CCI, MFI, MOM and various moving averages to your chart and draw a trend line. Below will be an image of the Momentum indicator.
You can edit the following from the settings section of this tool:
The language you will use, EN-TR
Colors of trend texts
Trend sensitivity
Thickness and colors of downtrend and rising trendlines
Hide and show trends
Hide and show trend values
Changing the background and text color of the box where the indicator name appears
Determining the source of the selected indicator
Determining the period of the selected indicator
Determine the color of the line of the selected indicator
Note: If the period value is not used in the calculation formula of the indicator you selected, the period selected in the settings will not be included in the calculations.
Note 2: If the source value is not used in the calculation formula of the indicator you have chosen, the source value selected in the settings will not be used.
Broken, inactive trend lines disappear.

DEMO - FxCanli TrendEN - FxCanli Trend indicator will help you to show the way of the trend and give alerts when trend changed
DEMO VERSION of FXCANLI TREND Indicator work with any NZD or any DOGE symbols
TR - FxCanli Trend İndikatörü grafiklerinizde trendin yönünü veren ve trend değiştiğinde alarm veren TradingView indikatörüdür.
FXCANLI TREND indikatörünün DEMO VERSİYONUNU herhangi bir NZD veya DOGE sembolü ile kullanabilirsiniz.
EN - For Example | TR - Örnek
NZD|...
NZD|USD
NZD|CAD
NZD|CHF
NZD|JPY
DOGE|...
DOGE|USD
DOGE|USDT
DOGE|USDTPERP
DOGE|BTC
EN - FxCanli Trend indicator will help you to show the way of the trend and give alerts when trend changed
When the candles are;
Green Candles - Up Trend
Yellow Candles - Trend may Change
Red Candles - Down Trend
TR - FxCanli Trend İndikatörü grafiklerinizde trendin yönünü veren ve trend değiştiğinde alarm veren TradingView indikatörüdür.
Yeşil Mumlar - Yukarı Trend
Sarı Mumlar - Trend Dönebilir
Kırmızı Mumlar - Aşağı Trend
HOW TO USE BUY & SELL SIGNALS ?
(ALIŞ & SATIŞ SINYALLERI NASIL KULLANILIR?)
1) Never use BUY or SELL signals without any chart patterns. (Alış veya Satış sinyallerini asla formasyonsuz kullanmayın)
it can give good results with the candle color change when chart pattern triggered
(Formasyon gerçekleştiğinde, mum rengi değişimi takip edilmeli)
Ex 1) Wedge Pattern (Takoz Formasyonu) - BTC|USDT
Ex 2) Flag Pattern (Bayrak Formasyonu) - ETC|USDT
Ex 3) Head and Shoulders Pattern ( Omuz Baş Omuz Formasyonu)
Ex 4) Triangle Pattern ( Üçgen Formasyonu)
Features - Özellikler
1) Trend Panel - Trend Paneli
2)EN - Panel Width - to get better view at mobile phones and tablets
TR - Cep telefonları ve tabletlerde daha güzel görünüm için Panel Genişliği
3) Multi Timeframe Trend Tracking - Çoklu Zaman Dilimi Trend Takibi
4) Alert Control / Alarm Kontrolü
EN - Selected Alert - when all timeframes have same trend it will give selected time frame alert
TR - Seçilmiş Zaman Dilimi - Tüm seçilen zaman dilimleri aynı trend olunca, seçilmiş zaman dilimi alarmı verir
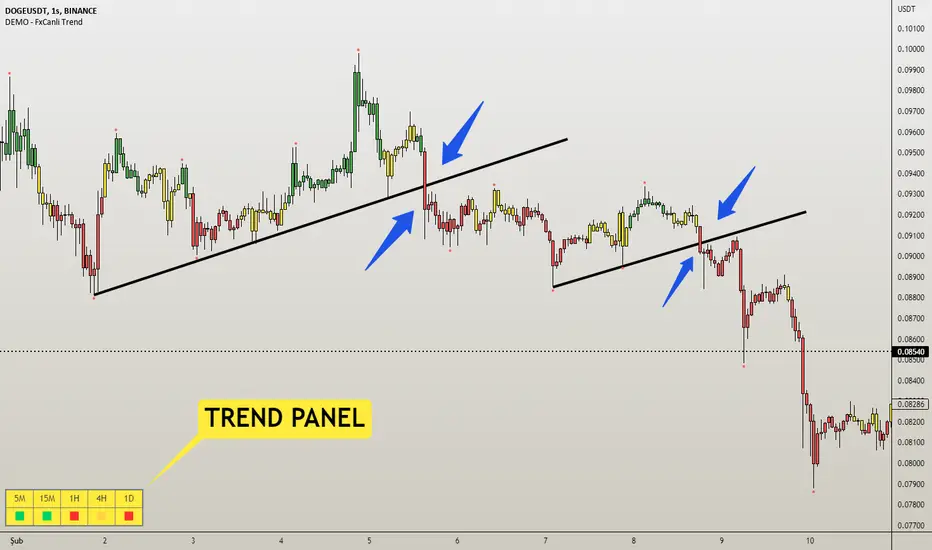
[@btc_charlie] Trader XO Macro Trend ScannerWhat is this script?
This script has two main functions focusing on EMAs (Exponential Moving Average) and Stochastic RSI.
EMAs
EMAs are typically used to give a view of bullish / bearish momentum. When the shorter EMA (calculated off more recent price action) crosses, or is above, the slower moving EMA (calculated off a longer period of price action), it suggests that the market is in an uptrend. This can be an indication to either go long on said asset, or that it is more preferable to take long setups over short setups. Invalidation on long setups is usually found via price action (e.g. previous lows) or simply waiting for an EMA cross in the opposite direction (i.e. shorter EMA crosses under longer term EMA).
This is not a perfect system for trade entry or exit, but it does give a good indication of market trends. The settings for the EMAs can be changed based on user inputs, and by default the candles are coloured based on the crosses to make it more visual. The default settings are based on “Trader XO’s” settings who is an exceptional swing trader.
RSI
Stochastic RSI is a separate indicator that has been added to this script. RSI measures Relative Strength (RSI = Relative Strength Index). When RSI is <20 it is considered oversold, and when >80 it is overbought. These conditions suggests that momentum is very strong in the direction of the trend.
If there is a divergence between the price (e.g. price is creating higher highs, and stoch RSI is creating lower highs) it suggests the strength of the trend is weakening. Whilst this script does not highlight divergences, what it does highlight is when the shorter term RSI (K) crosses over D (the average of last 3 periods). This can give an indication that the trend is losing strength.
Combination
The EMAs indicate when trend shifts (bullish or bearish).
The RSI indicates when the trend is losing momentum.
The combination of the two can be used to suggest when to prefer a directional bias, and subsequently shift in anticipation of a trend reversal.
Note that no signal is 100% accurate and an interpretation of market conditions and price action will need to be overlayed to
Why is it different to others?
I have not found other scripts that are available in this way visually including alerts when Stoch RSI crosses over/under the extremes; or the mid points.
Whilst these indicators are default, the combination of them and how they are presented is not and makes use of the TradingView colouring functionalities.
What are the features?
Customise the variables (averages) used in the script.
Display as one EMA or two EMAs (the crossing ones).
Alerts on EMA crosses.
Alerts on Stoch RSI crosses - slow/fast, upper, lower areas.
- Currently set on the chart to show alerts when Stoch RSI is above 80, then falls below 80 (and colours it red).
Customisable colours.
What are the best conditions for this?
It is designed for high timeframe charts and analysis in crypto, since crypto tends to trend.
It can however be used for lower timeframes.
Disclaimer/Notes:
I have noticed several videos appearing suggesting that this is a "100% win rate indicator" .
NO indicator has 100% win rate.
An indicator is an *indicator* that is all.
Please use responsibly and let me know if there are any mods or updates you would like to see.

GKD-C Trend Intensity Index [Loxx]Giga Kaleidoscope Trend Intensity Index is a Confirmation module included in Loxx's "Giga Kaleidoscope Modularized Trading System".
█ Giga Kaleidoscope Modularized Trading System
What is Loxx's "Giga Kaleidoscope Modularized Trading System"?
The Giga Kaleidoscope Modularized Trading System is a trading system built on the philosophy of the NNFX (No Nonsense Forex) algorithmic trading.
What is an NNFX algorithmic trading strategy?
The NNFX algorithm is built on the principles of trend, momentum, and volatility. There are six core components in the NNFX trading algorithm:
1. Volatility - price volatility; e.g., Average True Range, True Range Double, Close-to-Close, etc.
2. Baseline - a moving average to identify price trend
3. Confirmation 1 - a technical indicator used to identify trends
4. Confirmation 2 - a technical indicator used to identify trends
5. Continuation - a technical indicator used to identify trends
6. Volatility/Volume - a technical indicator used to identify volatility/volume breakouts/breakdown
7. Exit - a technical indicator used to determine when a trend is exhausted
How does Loxx's GKD (Giga Kaleidoscope Modularized Trading System) implement the NNFX algorithm outlined above?
Loxx's GKD v1.0 system has five types of modules (indicators/strategies). These modules are:
1. GKD-BT - Backtesting module (Volatility, Number 1 in the NNFX algorithm)
2. GKD-B - Baseline module (Baseline and Volatility/Volume, Numbers 1 and 2 in the NNFX algorithm)
3. GKD-C - Confirmation 1/2 and Continuation module (Confirmation 1/2 and Continuation, Numbers 3, 4, and 5 in the NNFX algorithm)
4. GKD-V - Volatility/Volume module (Confirmation 1/2, Number 6 in the NNFX algorithm)
5. GKD-E - Exit module (Exit, Number 7 in the NNFX algorithm)
(additional module types will added in future releases)
Each module interacts with every module by passing data between modules. Data is passed between each module as described below:
GKD-B => GKD-V => GKD-C(1) => GKD-C(2) => GKD-C(Continuation) => GKD-E => GKD-BT
That is, the Baseline indicator passes its data to Volatility/Volume. The Volatility/Volume indicator passes its values to the Confirmation 1 indicator. The Confirmation 1 indicator passes its values to the Confirmation 2 indicator. The Confirmation 2 indicator passes its values to the Continuation indicator. The Continuation indicator passes its values to the Exit indicator, and finally, the Exit indicator passes its values to the Backtest strategy.
This chaining of indicators requires that each module conform to Loxx's GKD protocol, therefore allowing for the testing of every possible combination of technical indicators that make up the six components of the NNFX algorithm.
What does the application of the GKD trading system look like?
Example trading system:
Backtest: Strategy with 1-3 take profits, trailing stop loss, multiple types of PnL volatility, and 2 backtesting styles
Baseline: Hull Moving Average as shown on the chart above
Volatility/Volume: Volatility Ratio as shown on the chart above
Confirmation 1: Trend Intensity Index as shown on the chart above
Confirmation 2: Williams Percent Range
Continuation: Fisher Transform
Exit: Rex Oscillator
Each GKD indicator is denoted with a module identifier of either: GKD-BT, GKD-B, GKD-C, GKD-V, or GKD-E. This allows traders to understand to which module each indicator belongs and where each indicator fits into the GKD protocol chain.
Giga Kaleidoscope Modularized Trading System Signals (based on the NNFX algorithm)
Standard Entry
1. GKD-C Confirmation 1 Signal
2. GKD-B Baseline agrees
3. Price is within a range of 0.2x Volatility and 1.0x Volatility of the Goldie Locks Mean
4. GKD-C Confirmation 2 agrees
5. GKD-V Volatility/Volume agrees
Baseline Entry
1. GKD-B Baseline signal
2. GKD-C Confirmation 1 agrees
3. Price is within a range of 0.2x Volatility and 1.0x Volatility of the Goldie Locks Mean
4. GKD-C Confirmation 2 agrees
5. GKD-V Volatility/Volume agrees
6. GKD-C Confirmation 1 signal was less than 7 candles prior
Continuation Entry
1. Standard Entry, Baseline Entry, or Pullback; entry triggered previously
2. GKD-B Baseline hasn't crossed since entry signal trigger
3. GKD-C Confirmation Continuation Indicator signals
4. GKD-C Confirmation 1 agrees
5. GKD-B Baseline agrees
6. GKD-C Confirmation 2 agrees
1-Candle Rule Standard Entry
1. GKD-C Confirmation 1 signal
2. GKD-B Baseline agrees
3. Price is within a range of 0.2x Volatility and 1.0x Volatility of the Goldie Locks Mean
Next Candle:
1. Price retraced (Long: close < close or Short: close > close )
2. GKD-B Baseline agrees
3. GKD-C Confirmation 1 agrees
4. GKD-C Confirmation 2 agrees
5. GKD-V Volatility/Volume agrees
1-Candle Rule Baseline Entry
1. GKD-B Baseline signal
2. GKD-C Confirmation 1 agrees
3. Price is within a range of 0.2x Volatility and 1.0x Volatility of the Goldie Locks Mean
4. GKD-C Confirmation 1 signal was less than 7 candles prior
Next Candle:
1. Price retraced (Long: close < close or Short: close > close )
2. GKD-B Baseline agrees
3. GKD-C Confirmation 1 agrees
4. GKD-C Confirmation 2 agrees
5. GKD-V Volatility/Volume Agrees
PullBack Entry
1. GKD-B Baseline signal
2. GKD-C Confirmation 1 agrees
3. Price is beyond 1.0x Volatility of Baseline
Next Candle:
1. Price is within a range of 0.2x Volatility and 1.0x Volatility of the Goldie Locks Mean
3. GKD-C Confirmation 1 agrees
4. GKD-C Confirmation 2 agrees
5. GKD-V Volatility/Volume Agrees
█ Trend Intensity Index
What is Trend Intensity Index?
The Trend Intensity Index (TTI) indicator can help determine the strength of the current market trend. The TII range is between 0 and 100, where typically a value above 50 is a bullish trend, and a value below 50 is a bearish trend.
Requirements
Inputs
Confirmation 1 and Solo Confirmation: GKD-V Volatility / Volume indicator
Confirmation 2: GKD-C Confirmation indicator
Outputs
Confirmation 2 and Solo Confirmation: GKD-E Exit indicator
Confirmation 1: GKD-C Confirmation indicator
Continuation: GKD-E Exit indicator
Additional features will be added in future releases.
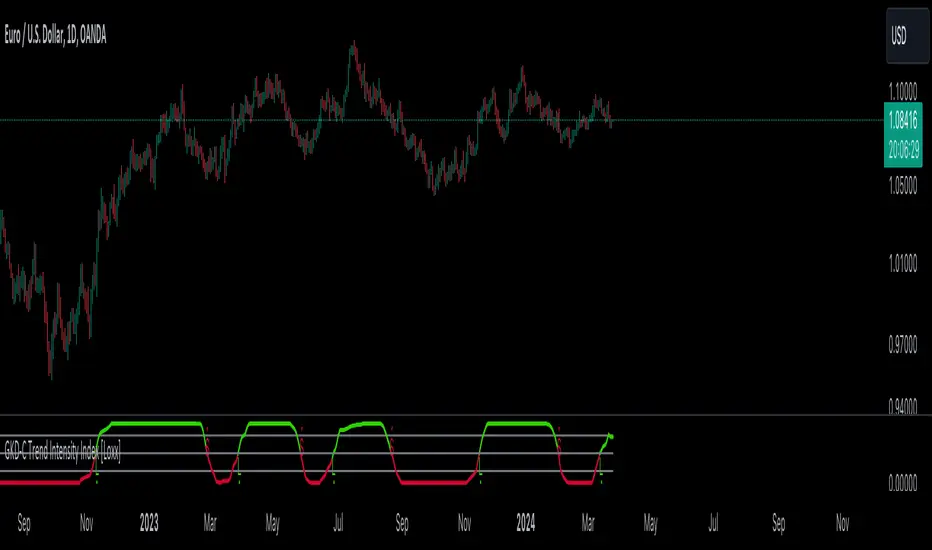
GKD-C Loxx Trend Strength [Loxx]Giga Kaleidoscope Loxx Trend Strength is a Confirmation module included in Loxx's "Giga Kaleidoscope Modularized Trading System".
█ Giga Kaleidoscope Modularized Trading System
What is Loxx's "Giga Kaleidoscope Modularized Trading System"?
The Giga Kaleidoscope Modularized Trading System is a trading system built on the philosophy of the NNFX (No Nonsense Forex) algorithmic trading.
What is an NNFX algorithmic trading strategy?
The NNFX algorithm is built on the principles of trend, momentum, and volatility. There are six core components in the NNFX trading algorithm:
1. Volatility - price volatility; e.g., Average True Range, True Range Double, Close-to-Close, etc.
2. Baseline - a moving average to identify price trend
3. Confirmation 1 - a technical indicator used to identify trends
4. Confirmation 2 - a technical indicator used to identify trends
5. Continuation - a technical indicator used to identify trends
6. Volatility/Volume - a technical indicator used to identify volatility/volume breakouts/breakdown
7. Exit - a technical indicator used to determine when a trend is exhausted
How does Loxx's GKD (Giga Kaleidoscope Modularized Trading System) implement the NNFX algorithm outlined above?
Loxx's GKD v1.0 system has five types of modules (indicators/strategies). These modules are:
1. GKD-BT - Backtesting module (Volatility, Number 1 in the NNFX algorithm)
2. GKD-B - Baseline module (Baseline and Volatility/Volume, Numbers 1 and 2 in the NNFX algorithm)
3. GKD-C - Confirmation 1/2 and Continuation module (Confirmation 1/2 and Continuation, Numbers 3, 4, and 5 in the NNFX algorithm)
4. GKD-V - Volatility/Volume module (Confirmation 1/2, Number 6 in the NNFX algorithm)
5. GKD-E - Exit module (Exit, Number 7 in the NNFX algorithm)
(additional module types will added in future releases)
Each module interacts with every module by passing data between modules. Data is passed between each module as described below:
GKD-B => GKD-V => GKD-C(1) => GKD-C(2) => GKD-C(Continuation) => GKD-E => GKD-BT
That is, the Baseline indicator passes its data to Volatility/Volume. The Volatility/Volume indicator passes its values to the Confirmation 1 indicator. The Confirmation 1 indicator passes its values to the Confirmation 2 indicator. The Confirmation 2 indicator passes its values to the Continuation indicator. The Continuation indicator passes its values to the Exit indicator, and finally, the Exit indicator passes its values to the Backtest strategy.
This chaining of indicators requires that each module conform to Loxx's GKD protocol, therefore allowing for the testing of every possible combination of technical indicators that make up the six components of the NNFX algorithm.
What does the application of the GKD trading system look like?
Example trading system:
Backtest: Strategy with 1-3 take profits, trailing stop loss, multiple types of PnL volatility, and 2 backtesting styles
Baseline: Hull Moving Average as shown on the chart above
Volatility/Volume: Volatility Ratio as shown on the chart above
Confirmation 1: Loxx Trend Strength as shown on the chart above
Confirmation 2: Williams Percent Range
Continuation: Fisher Transform
Exit: Rex Oscillator
Each GKD indicator is denoted with a module identifier of either: GKD-BT, GKD-B, GKD-C, GKD-V, or GKD-E. This allows traders to understand to which module each indicator belongs and where each indicator fits into the GKD protocol chain.
Giga Kaleidoscope Modularized Trading System Signals (based on the NNFX algorithm)
Standard Entry
1. GKD-C Confirmation 1 Signal
2. GKD-B Baseline agrees
3. Price is within a range of 0.2x Volatility and 1.0x Volatility of the Goldie Locks Mean
4. GKD-C Confirmation 2 agrees
5. GKD-V Volatility/Volume agrees
Baseline Entry
1. GKD-B Baseline signal
2. GKD-C Confirmation 1 agrees
3. Price is within a range of 0.2x Volatility and 1.0x Volatility of the Goldie Locks Mean
4. GKD-C Confirmation 2 agrees
5. GKD-V Volatility/Volume agrees
6. GKD-C Confirmation 1 signal was less than 7 candles prior
Continuation Entry
1. Standard Entry, Baseline Entry, or Pullback; entry triggered previously
2. GKD-B Baseline hasn't crossed since entry signal trigger
3. GKD-C Confirmation Continuation Indicator signals
4. GKD-C Confirmation 1 agrees
5. GKD-B Baseline agrees
6. GKD-C Confirmation 2 agrees
1-Candle Rule Standard Entry
1. GKD-C Confirmation 1 signal
2. GKD-B Baseline agrees
3. Price is within a range of 0.2x Volatility and 1.0x Volatility of the Goldie Locks Mean
Next Candle:
1. Price retraced (Long: close < close or Short: close > close )
2. GKD-B Baseline agrees
3. GKD-C Confirmation 1 agrees
4. GKD-C Confirmation 2 agrees
5. GKD-V Volatility/Volume agrees
1-Candle Rule Baseline Entry
1. GKD-B Baseline signal
2. GKD-C Confirmation 1 agrees
3. Price is within a range of 0.2x Volatility and 1.0x Volatility of the Goldie Locks Mean
4. GKD-C Confirmation 1 signal was less than 7 candles prior
Next Candle:
1. Price retraced (Long: close < close or Short: close > close )
2. GKD-B Baseline agrees
3. GKD-C Confirmation 1 agrees
4. GKD-C Confirmation 2 agrees
5. GKD-V Volatility/Volume Agrees
PullBack Entry
1. GKD-B Baseline signal
2. GKD-C Confirmation 1 agrees
3. Price is beyond 1.0x Volatility of Baseline
Next Candle:
1. Price is within a range of 0.2x Volatility and 1.0x Volatility of the Goldie Locks Mean
3. GKD-C Confirmation 1 agrees
4. GKD-C Confirmation 2 agrees
5. GKD-V Volatility/Volume Agrees
█ Loxx Trend Strength
What is Loxx Trend Strength?
Loxx Trend Strength is a momentum and trend indicator that uses a special version of RSI to decipher price trend. This special version of RSI is then smoothed using an EMA, a Kalman Filter, and a Kauffman adaptive filter.
Requirements
Inputs
Confirmation 1 and Solo Confirmation: GKD-V Volatility / Volume indicator
Confirmation 2: GKD-C Confirmation indicator
Outputs
Confirmation 2 and Solo Confirmation: GKD-E Exit indicator
Confirmation 1: GKD-C Confirmation indicator
Continuation: GKD-E Exit indicator
Additional features will be added in future releases.
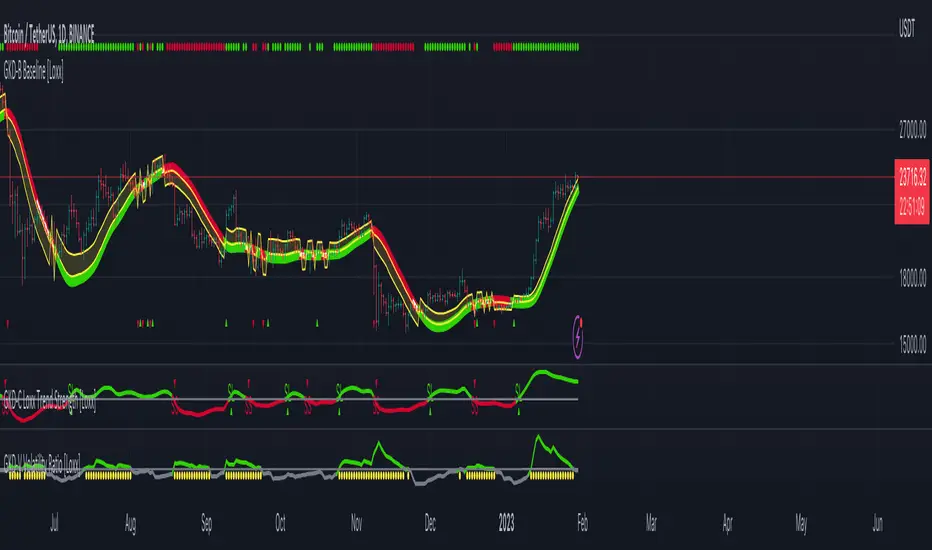
Trend line & pivot level
This script can plot pivot levels and trend lines that are haven't broke out.
In the setting, left and right means how to get the pivot. the pivot will be gotten based on the left candles and the right candles. boxes will be auto deleted after the box was broke.
Important: This is just a beta version, if you find some bug with using this script. Don't hesitate to contact me.
What the future version will have? Might be pattern scanner, multi trend line, levels in different time frame, break out alert, or better key level algorithm. Depends on when I have free time.

Sonarlab - Trendline Liquidity Indicator**This is not a normal Trend Line Indicator**
Most of the concepts we get thought online are to good to be true. Buy and sell off the touch of the trend line and you will be winning! You probably find out already that this ain't the way to trade. Trend lines mostly gets broken and you will be taken out.
he reason behind this is that the trend lines sparks the interests of Institutions. They use those area's to stop people out and use them as fuel for their positions: Liquidity.
TLL: Trend Line Liquidity
Lets show you an example on how to use these TLL markings 👇
In this example above we can see a beautiful example of the TLL indicator mapping out the TLL. The Imbalance Indicator shows us with the BPR (balanced price range) there is a sign of going short. The other confluence we can add is the TLL, which price likes to clear in these situations.
In this other example we also see two TLL resting on top. We see that price tried to break the SL (swing low), but the fake out detection showed us this was a grab on liquidity. After that we can see that on the LTF we get a displacement and we can assume that price is going to target the TLL.
Another example where price cleared the TLL and used is a targets.
This indicator will map the Trend Line Liquidity for you, so you are more aware of the liquidity that is resting around you. The Indicator has the following inputs:
Sensitivity A lower sensitivity create smaller trend lines, where a higher sensitivity creates bigger trend lines.
Display limit : The amount of lines you want the indicator to display
Line type/ text size (styling options)