Trend-Strong Candle - 3 EMAs with Filters# Trend-Strong Candle - Professional Trading Indicator
## 📊 What It Does
Identifies high-probability entries by combining triple EMA trend analysis with strong candle detection. Only signals when all conditions align for maximum accuracy.
## 🎯 Core Features
- Triple EMA System: Fast (20) / Medium (50) / Slow (200) for trend confirmation
- Strong Candle Filter: ATR-based sizing ensures genuine momentum
- Advanced Filters: EMA close validation + trend stability checks
- Live Alerts: Instant notifications for real-time signals
- Session Filter: Trade only during active EU/US market hours
## ⚡ Quick Setup
Scalping (1-5min): Default settings + enable session filter
Day Trading (15-60min): Default settings work perfectly
Swing Trading (4H+): Increase ATR multiplier to 0.8-1.0
## 📈 Trading Rules
Long Signals: Green triangle below candle
- Strong bullish candle during confirmed uptrend
- All EMAs properly aligned (Fast > Medium > Slow)
Short Signals: Red triangle above candle
- Strong bearish candle during confirmed downtrend
- All EMAs properly aligned (Fast < Medium < Slow)
## ⚠️ Critical Success Factors
1. Always Verify the Trend Yourself
The indicator helps identify signals, but YOU must confirm the larger trend context. Check higher timeframes and overall market structure before entering.
2. Understand the "Big Players"
Strong candles in trend direction usually come from institutional money (banks, funds, algorithms). These create the momentum that retail traders can follow. The indicator catches these institutional moves.
3. Distance to Next Value Level
NEVER enter if price is too close to major resistance/support levels:
- Check distance to round numbers (1.1000, 1.1050, etc.)
- Ensure at least 20-30 pips room to next key level
- You need space for profit - tight levels = limited upside
4. Risk Management
- Stop Loss: 1-2 ATR from entry
- Take Profit: 2-3 ATR target (minimum 1:2 R/R)
- Position Size: Risk max 1-2% per trade
## 💡 Pro Tips
- Best Sessions: London open (8-12 UTC) and NY open (13-17 UTC)
- Avoid: Major news, low liquidity periods, choppy markets
- Multiple Timeframes: Confirm signals on higher timeframe
- Value Levels: Always check daily/weekly support/resistance before entering
## 🎯 Success Formula
Trend Confirmation + Strong Institutional Candle + Distance to Value Levels = High Probability Trade
*
Remember: The indicator finds the signals, but successful trading requires your analysis of trend context and value level positioning. Trade smart, not just frequent.
在腳本中搜尋"trend"

Trend Continuation Filter - 🚀 Trend Continuation Filter — Multi-Factor Overlay
This overlay plots bullish / bearish continuation labels & arrows only when the market has enough confluence behind the move. Think of it as your “trend gatekeeper” — cutting out weak setups and highlighting only those with real momentum + structure.
🔍 Built-in Filters
✔ Ichimoku Cloud → trend bias + Tenkan/Kijun confirmation
✔ MACD (12/26/9) → acceleration via histogram slope
✔ RSI / MFI (14) → momentum quality (≥60 bullish / ≤40 bearish)
✔ ADX (14) → strength check (≥20 and rising)
➕ EMA Alignment (9/21/55/233) (optional)
➕ ATR Slope (14) (optional)
🎯 How it works
✅ Prints a Bull Continuation label/arrow when ≥4 filters align to the upside
✅ Prints a Bear Continuation label/arrow when ≥4 filters align to the downside
⚙️ minChecks input lets you adjust the strictness:
• Normal Days → set to 4 (more frequent, flexible)
• Trend Days → raise to 5–6 (fewer, high-conviction setups)
📈 Best Practices
⏰ Focus on London & New York sessions for clean expectancy
🧩 Pair with a HUD/Dashboard panel to see exactly which filters are active

Trend Display Table (with Change Alerts)📌 Indicator: Trend Display Table (with Change Alerts)
This indicator helps identify trend direction based on a 15-minute 20 SMA compared against a 10 EMA applied to that SMA.
Trend Logic:
Bullish → 20 SMA crosses above 10 EMA (on SMA values)
Bearish → 20 SMA crosses below 10 EMA (on SMA values)
Neutral → No crossover (trend continues from previous state)
Display:
A compact trend table appears on the chart (top-right), showing the current trend with customizable colors, font size, and background.
Alerts:
Alerts are triggered only when the trend changes (from Bullish → Bearish or Bearish → Bullish).
This prevents repeated alerts on every bar.
✅ Useful for:
Confirming higher timeframe trend bias
Filtering trades in choppy markets
Getting notified instantly when the trend flips

Trend State ADX-DI v6This indicator combines the classic ADX (Average Directional Index) and DI+ / DI– (Directional Indicators) with a modern, easy-to-read visual approach. It highlights trend strength and direction directly on your chart background:
✅ Bullish Trend – DI+ crosses above DI– with ADX above threshold
✅ Bearish Trend – DI– crosses above DI+ with ADX above threshold
✅ Choppiness – ADX below threshold, indicating sideways or weak trend
✅ Transition – Optional highlight for periods near the threshold, signaling a potential trend change
Plots for ADX, DI+, and DI– help you track trend momentum, while customizable background colors make it easy to spot trading conditions at a glance. Alerts included for bullish and bearish trend signals.
Perfect for day traders and swing traders looking to identify strong directional moves and avoid choppy markets.
Created by ThomasO_777, updated for Pine Script v6 by ChatGPT.

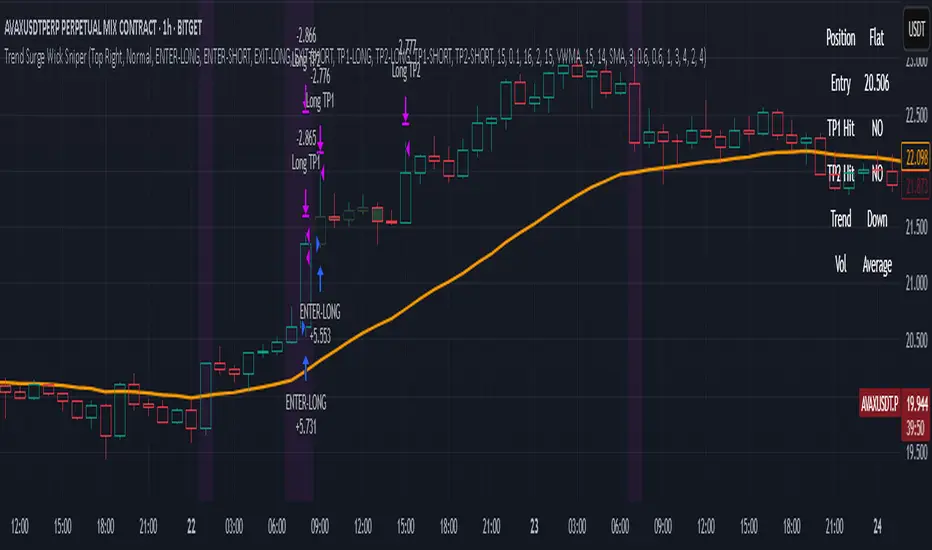
Trend Surge Wick SniperTrend Surge Wick Sniper | Non-Repainting Trend + Momentum Strategy with TP1/TP2 & Dashboard
Trend Surge Wick Sniper is a complete crypto trading strategy designed for high-precision entries, smart exits, and non-repainting execution. It combines trend slope, wick rejection, volume confirmation, and CCI momentum filters into a seamless system that works in real-time conditions — whether you're manual trading or sending alerts to multi-exchange bots.
🧩 System Architecture Overview
This is not just a mashup of indicators — each layer is tightly integrated to filter for confirmed, high-quality setups. Here’s a detailed breakdown:
📈 Trend Logic
1. McGinley Dynamic Baseline
A responsive moving average that adapts to market speed better than EMA or SMA.
Smooths price while staying close to real action, making it ideal for basing alignment or trend context.
2. Gradient Slope Filter (ATR-normalized)
Calculates the difference between current and past McGinley values, divided by ATR for normalization.
If the slope exceeds a configurable threshold, it confirms an active uptrend or downtrend.
Optional loosened sensitivity allows for more frequent but still valid trades.
🚀 Momentum Timing
3. Smoothed CCI (ZLEMA / Hull / VWMA options)
Traditional CCI is enhanced with smoothing for stability.
Signals trades only when momentum is strong and accelerating.
Optional settings let users tune how responsive or smooth they want the CCI behavior to be.
🔒 Entry Filtering & Rejection Logic
4. Wick Trap Detection
Prevents entry during manipulated candles (e.g. stop hunts, wick traps).
Measures wick-to-body ratio against a minimum body size normalized by ATR.
Only trades when the candle shows a clean body and no manipulation.
5. Price Action Filters (Optional)
Long trades require price to break above previous high (or skip this with a toggle).
Short trades require price to break below previous low (or skip this with a toggle).
Ensures you're trading only when price structure confirms the breakout.
6. McGinley Alignment (Optional)
Price must be on the correct side of the McGinley line (above for longs, below for shorts).
Ensures that trades align with baseline trend, preventing early or fading entries.
📊 Volume Logic
7. Volume Spike Detection
Confirms that a real move is underway by requiring volume to exceed a moving average by a user-defined multiplier.
Uses SMA / EMA / VWMA for customizable behavior.
Optional relative volume mode compares volume against typical volume at that same time of day.
8. Volume Trend Filter
Compares fast vs. slow EMA of the volume spike ratio.
Ensures volume is not just spiking, but also increasing overall.
Prevents trades during volume exhaustion or fading participation.
9. Volume Strength Label
Classifies each bar’s volume as: Low, Average, High, or Very High
Shown in the dashboard for context before entries.
🎯 Entry Conditions
An entry occurs when all of the following align:
✅ Trend confirmed via gradient slope
✅ Momentum confirmed via smoothed CCI
✅ No wick trap pattern
✅ Price structure & McGinley alignment (if toggled on)
✅ Volume confirms participation
✅ 1-bar cooldown since last exit
💰 TP1 & TP2 Exit System
TP1 = 50% of position closed using a limit order at a % profit (e.g., 2%)
TP2 = remaining 50% closed at a second profit level (e.g., 4%)
These are set as limit orders at the time of entry and work even on backtest.
Alerts are sent separately for TP1 and TP2 to allow bot handling of staggered exits.
🧠 Trade Logic Controls
✅ process_orders_on_close=true ensures non-repainting behavior
✅ 1-bar cooldown after any exit prevents same-bar reversals
✅ Built-in canEnter condition ensures trades are separated and clean
✅ Alerts use customizable strings for entry/exit/TP1/TP2 — ready for webhook automation
📊 Real-Time On-Chart Dashboard
Toggleable, movable dashboard shows live trading stats:
🔵 Current Position: Long / Short / Flat
🎯 Entry Price
✅ TP1 / TP2 Hit Status
📈 Trend Direction: Up / Down / Flat
🔊 Volume Strength: Low / Average / High / Very High
🎛 Size and corner are adjustable via input settings
⚠️ Designed For:
1H / 4H Crypto Trading
Manual Traders & Webhook-Connected Bots
Scalability across volatile market conditions
Full TradingView backtest compatibility (no repainting / no fake signals)
📌 Notes
You can switch CCI smoothing type, volume MA type, and other filters via the settings panel.
Default TP1/TP2 levels are set to 2% and 4%, but fully customizable.
🛡 Disclaimer
This script is for educational purposes only and not financial advice. Use with backtesting and risk management before live deployment.
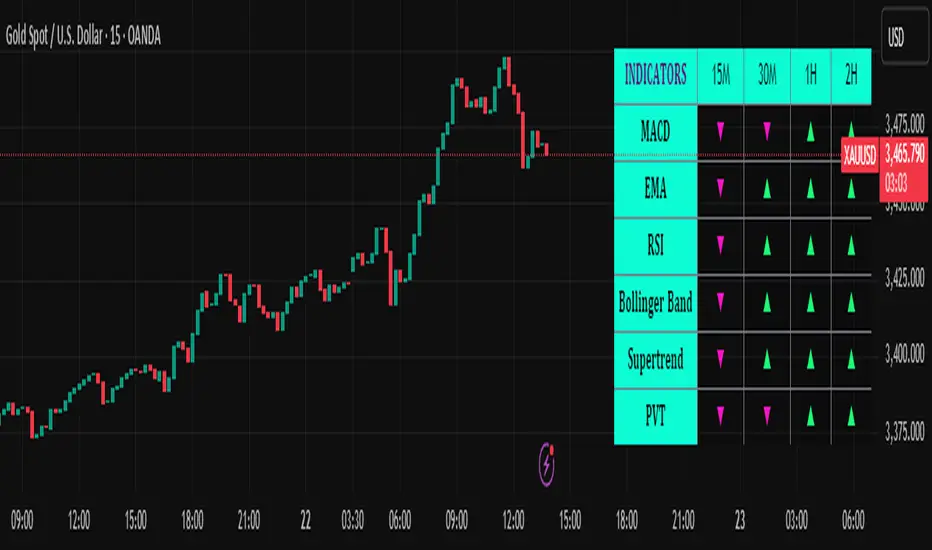
Trend Matrix Multi-Timeframe Dashboard(TechnoBlooms)Trend Matrix Multi-Timeframe Dashboard is a Minimalist Multi-Timeframe Trend Analyzer with Smart Indicator Integration. Trend Matrix MTF Dashboard is a clean, efficient, and visually intuitive trend analyzer built for traders who value simplicity without compromising on technical depth.
This dashboard empowers you to track trend direction across multiple timeframes using a curated set of powerful technical indicators—all from one compact visual panel. The design philosophy is simple: eliminate clutter, highlight trend clarity, and accelerate your decision-making process.
Key Features
✅ Minimalist Design with Maximum Insight
A compact dashboard view designed for clean charts and focused trading
Optimized layout shows everything you need—nothing you don’t
✅ Multi-Timeframe Access at a Glance
Instantly read the trend direction of selected indicators on multiple timeframes (e.g., 15m, 1h, 4h, 1D)
Customize the timeframe stack to fit scalping, intraday, swing, or positional strategies
✅ Robust Technical Indicators Built In
Each one is hand-picked for trend reliability:
MACD – Momentum and crossover confirmation
RSI – Overbought/oversold and directional shift
EMA – Dynamic support/resistance and trend bias
Bollinger Bands – Volatility structure and trend containment
PVT – Volume-Weighted Trend Confirmation
Supertrend – Price-following trend tracker
✅ Live Updates & Lightweight Performance
Built to update efficiently on every bar close
Minimal performance impact even with multiple timeframes active
By offering multi-timeframe (MTF) access to proven trend-following indicators, Trend Matrix helps you confidently align with the market’s dominant direction—without jumping between charts or analyzing indicators one by one.
This indicator offers customizable settings. The trader can choose the input parameters timeframes as per the choice.
Trend Matrix Multi-Timeframe Dashboard helps traders to identify trend based on technical indications. Trader can refer this while taking trading decisions.
🧠 Ideal For
Scalpers who need higher timeframe confirmation
Swing traders identifying clean entries aligned with the macro trend
Trend followers seeking clarity before committing capital
Price action & SMC traders validating market structure setups
Beginners who want a high-level trend guide without messy indicators
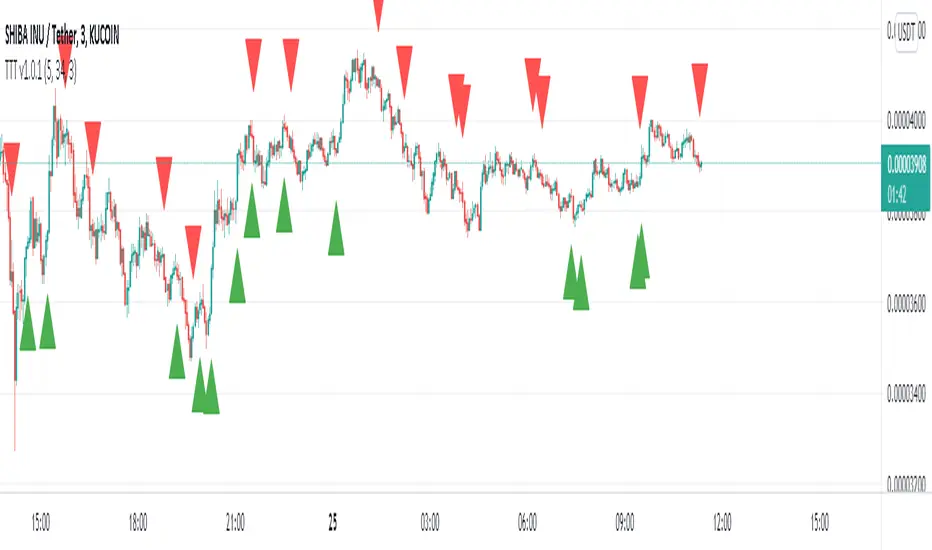
Trend Indicator with ArrowsTrend Indicator with arrows is a NoBrainer indicator to see the trend clearly.
UpTrend is defined as a candle closing above previous high. I
DownTrend is defined as a candle closing below previous low
A consolidation is defined as a candle closing inside previous candle high low.
UpTrend - Indicated with a green arrow below the candle with the current indicator.
DownTrend - ndicated with a red arrow above the candle with the current indicator.
So How to use this Indicator?
Identify zones of consolidation where the indicator doesn't show any arrows. Upon shift from consolidation to UpTrend or DownTrend take a entry. This is one way.
Second and most useful way is wait for Support or resistant hit.
If it's a support. Upon support hit wait for Consolidation, DownTrend and then UpTrend/(Consolidation again with uptrend) for long entry.
If its a resistance. Upon resistance hit wait for Consolidation, Uptrend and then DownTrend/(Consolidation again with DownTrend) for short Entry.

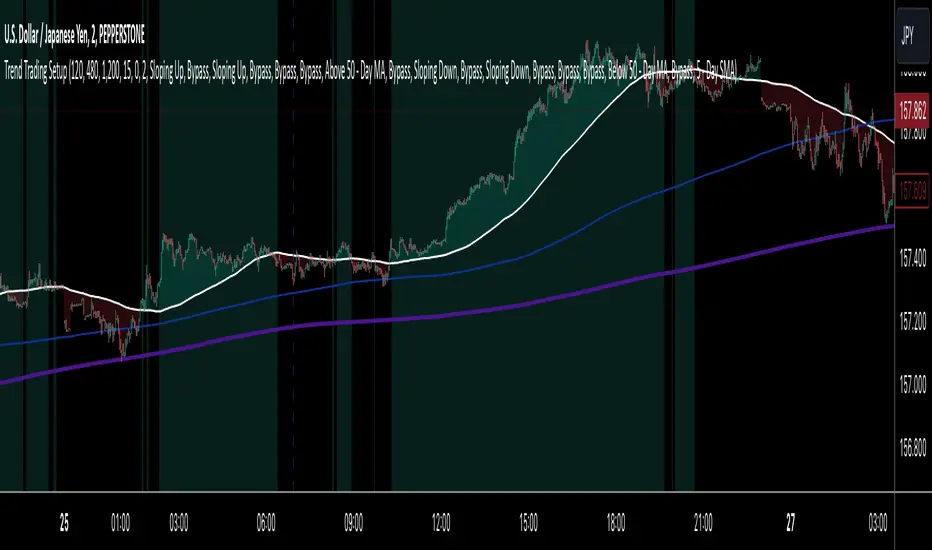
Trend Trading SetupTrend Trading Setup is an indicator that is designed to assist with trend trading by indicating when the basic conditions for a trade in either direction are met.
Note: Default values assume the 1-hour chart
The idea is that this will allow a trader to know for the first glance if a market is worthy of closer inspection or not.
Indicator Features:
1. Simple Moving Averages - defining the basic trade conditions
5 - Day Moving Average
20 - Day Moving Average
50 - Day Moving Average
2. Visualisation of The Price Location In Relation To The 5 - Day Moving Average
If price is above the 5-day Moving Average, the space between them is green. If price is below the 5-day Moving Average, the space between them is red.
3. Risk Management Section - calculates an ATR-based stop loss.
4. Indication When The Conditions Are Met
If the conditions for a bullish bias are met, the chart background is green. If the conditions for a bearish bias are met, the chart background is red. If none of the conditions are met, the chart background is left as is.
A user can adjust the length of any of the Moving Averages as well as the length of the ATR and the ATR Multiplier for the stop loss size. Default values assume the 1-hour chart, but surprisingly the settings seem to show logical results also on other time frames.
The Setup:
Bullish - 5-day Moving Average is above the 50-day Moving Average. The slope of both of the Moving Averages is positive and the price has to be above the 5-day Moving Average.
Bearish - Exactly the same as for the bullish bias, but opposite.
I do not recommend to take this Trend Trading Setup indicator as the only reason for a position. However, I believe it can be very useful to show when the overall conditions are in favour of a long position or in favour of a short position.
Trend Momentum Indicator with MACD ConfirmationTrend Momentum Indicator with MACD Confirmation
Overview: The Trend Momentum Indicator with MACD Confirmation is a versatile trading tool designed to help traders identify potential buy and sell signals in the market based on the interaction between price action, a Simple Moving Average (SMA), and the Moving Average Convergence Divergence (MACD) indicator. This strategy aims to enhance trading decisions by waiting for MACD confirmation before executing trades, thereby reducing false signals.
Components:
Simple Moving Average (SMA):
The SMA is calculated over a user-defined period (default: 20 bars) and serves as a trend indicator. It provides a smoothed representation of price action and helps traders identify the overall market direction.
MACD:
The MACD is calculated using standard parameters (12 for fast length, 26 for slow length, and 9 for signal length) but can be adjusted to suit individual trading preferences. The MACD consists of two lines:
MACD Line: The difference between the fast and slow EMAs.
Signal Line: An EMA of the MACD Line, which helps indicate buy and sell conditions.
Buy and Sell Signals:
Buy Signal: A buy signal is triggered when the price crosses above the SMA, coupled with the MACD line crossing above the signal line, indicating a bullish momentum.
Sell Signal: A sell signal occurs when the price crosses below the SMA, alongside the MACD line crossing below the signal line, indicating a bearish momentum.
Visual Features:
The SMA is plotted on the main price chart, allowing traders to easily visualize trend direction.
Buy signals are indicated by green triangle shapes below the price bars, while sell signals are shown by red triangle shapes above the price bars.
Optionally, a MACD histogram can be plotted to visualize the difference between the MACD line and the signal line, helping to confirm trade signals visually.
Usage:
This indicator is suitable for various trading styles, including day trading, swing trading, and trend-following strategies. It can be applied to any financial instrument, including stocks, forex, and cryptocurrencies.
Traders should consider combining this indicator with additional tools and analysis to enhance decision-making and manage risk effectively.

Trend Lines, Supports and Resistances█ OVERVIEW
This is a simple script that draws trend lines, supports and resistances based on the highs and lows of pivots and is developed solely for practice purposes while learning the Pine Script language.
█ FEATURES:
Ability to change pivot length and mark pivots on chart.
Ability to change amount of pivot points that used to generate trend lines or support and resistances.
Ability to set exception for last "n" bars for breaks.
Ability to set exception up to "n" times for breaks.
Ability to see broken trend lines as ghosts.
Ability to set alarms for breaks.
Ability to change colors and line widths.
And many more...
█ DISCLAIMER:
Trading is risky and most of the day traders lose money eventually. This indicator is only for educational purposes and should not be construed as financial advice. Past performances does not guarantee future results.

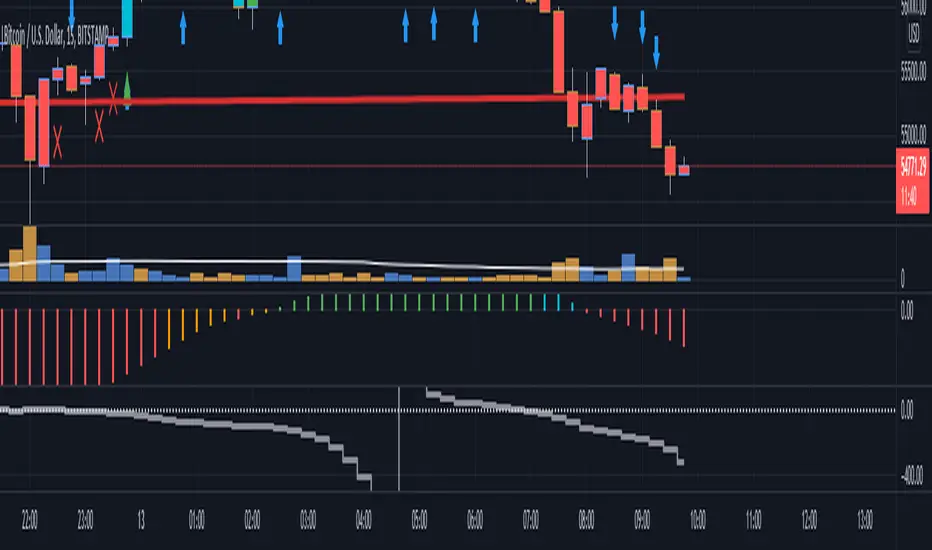
Trend Cloud [Tcs] | ALGO The TCS CLOUD has been developed to provide information about trend direction and potential buy/sell entry points in the market.
The cloud is a momentum and ATR-based indicator that removes all the noise that MAs usually provide, improving the simplicity of reading market direction. It can be adjusted based on a trader's own trading ideas through look-back adjustment and a multiplier.
Minor values are more indicated for scalpers.
It can be useful to find entry for trend continuation and has been designed to provide accurate points of retracement.
The middle line, based on Donchian concepts and plotted in dots, and candlestick color are based on the price action of highs and lows compared to past highs/lows.
Dots and candles can be green (strong bullish), light green (bullish), gray (non-directional), purple (strong bearish), and light purple (bearish).
Please note that this indicator is for educational purposes only and should not be used for trading without further testing and analysis.

Trend Identifier StrategyTrend Identifier Strategy for 1D BTC.USD
The indicator smoothens a closely following moving average into a polynomial like plot and assumes 4 staged cycles based on the first and the second derivatives. This is an optimized strategy for long term buying and selling with a Sortino Ratio above 3. It is designed to be a more profitable alternative to HODLing. It can be combined with 'Accumulation/Distribution Bands & Signals' and 'Exponential Top and Bottom Finder'.

Trend IdentifierTrend Identifier for 1D BTC.USD
It smoothens a closely following moving average into a polynomial like plot.
And assumes 4 stage cycles based on the first and second derivatives.
Green: Bull / Exponential Rise
Yellow: Distribution
Red: Bear / Exponential Drop
Blue: Accumulation
Red --> Blue --> Green: indicates the start of a bull market
Green --> Yellow --> Red: indicates the start of a bear market
Green --> Yellow: Start of a distribution phase, take profits
Red --> Blue: Start of a accumulation phase, DCA

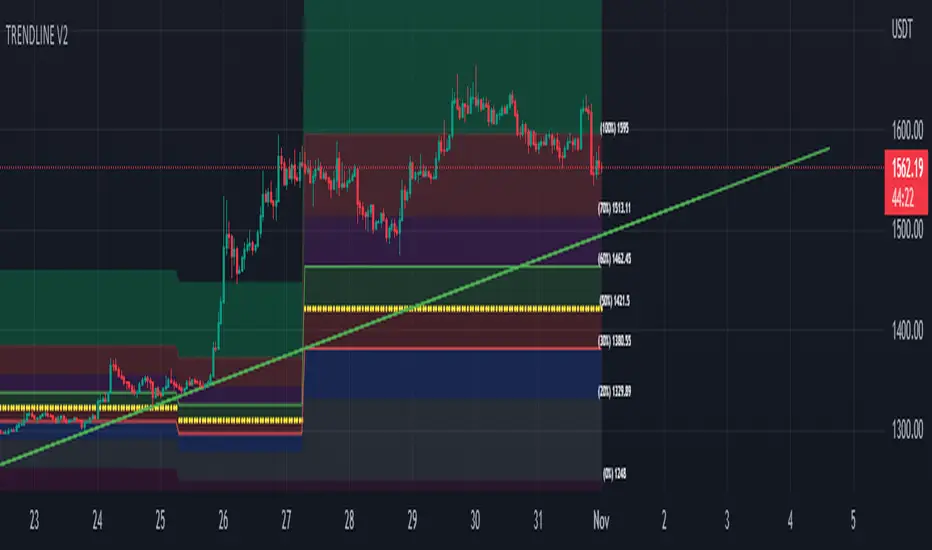
TRENDLINE V1Hello all ...
this is the source trendline of the three pivots
with adjustable resolution and length
function to find a breakout or breakdown
Trend Day IndentificationVolatility is cyclical, after a large move up or down the market typically "ranges" during the next session. Directional order flow that enters the market during this subsequent session tends not to persist, this non-persistency of transactions leads to a non-trend day which is when I trade intraday reversionary strategies.
This script finds trend days in BTC with the purpose of:
1) counting trend day frequency
2) predicting range contraction for the next 1-2 days so I can run intraday reversion strategies
Trend down is defined as daily bar opening within X% of high and closing within X% of low
Trend up is defined as daily bar opening within X% of low and closing within X% of high
default parameters are:
1) open range extreme = 15% (open is within 15% of high or low)
2) close range extreme = 15% (close is within 15% of high or low)
There is also an atr filter that checks that the trend day has a larger range than the previous 4 bars this is to make sure we find true range expansion vs recent ranges.
Notes:
If a trend day occurs after a prolonged sideways contraction it can signal a breakout - this is less common but is an exception to the rule. These types of occurrences can lead to the persistency of order flow and result in extended directional daily runs.
If a trend day occurs close to 20 days high or low (stopping just short OR pushing slightly through) then wait an additional day before trading intraday reversion strategies.

Trend Strength Oscillator [Lysergik]The Trend Strength Oscillator is a clever combination of some of the most common and useful indicators. Combining the:
- Directional Movement Index (DMI)
- Average Directional Index (ADX)
- Volume (optional)
In doing so, we get a much easier to appreciate indication of both trend direction and strength at a glance that is reliable on every timeframe!
The ADX is not only part of the resulting value but also affects how bright the colors appear on the indicator. Brighter being a stronger trend direction than lighter color.
Moreover, we can quickly see if a trend is strengthening or weakening by seeing if the indication is colored aqua/yellow or white, respectively.
In the above chart you can see the volume indicator, DMI, ADX, with the TSO (Trend Strength Oscillator) on the bottom for context and to show just how much more intuitive the TSO is.

Trend intensity 65 TI65––––History & Credit
This indicator has been inspired by public videos of StockBee and his community. Stockbee is a famous successful trader, who has approach to detail and backtesting. The TI65 is a great confirmation tool for the trend strenght.
–––––What it does
TI65 is an indicator that measures trend and momentum over 65 days.
When there is a green cloud we have a confirmed uptrend with certain velocity.
The calculation is simple as it measures the ratio between the 7d SMA over the 65D sma.
–––––How to use it
Look for entry points when during green trade intensity.

Trend Tracking Trader v1.0.1 [by Hajixde]How it works:
This indicator works based on finding the trend lines of time-shifted MACD signals.
Time frame:
The performance of the indicator highly depends on the time frame you choose and the input parameters. Please the following details carefully.
Parameters:
The default values for "Fast Length", "Slow Length", and "Signal smoothing" have been tested for several coins and tokens but you are more than welcome to choose your own numbers.
Fast Length & Slow Length:
The higher values of these lengths, the slower but more accurate trade entry and exit points.
Signal Smoothing:
By increasing this parameter, you are getting rid of cyclical noise but may also miss some low pivots. Don't choose a very high value.
Alerting:
When you add this indicator to your chart, you can enable the alerts by choosing the indicator in the alerts section and then "Buy" and "Sell" options can be selected and you'll be notified of the signals.
Tips:
Based on what I've experimented, it works great on SHIBA for a 3-min TF and the default values. ETH has shown a fantastic result on a 6-Hr TF.
- This is an original, public, and protected script which belongs to user Hajixde
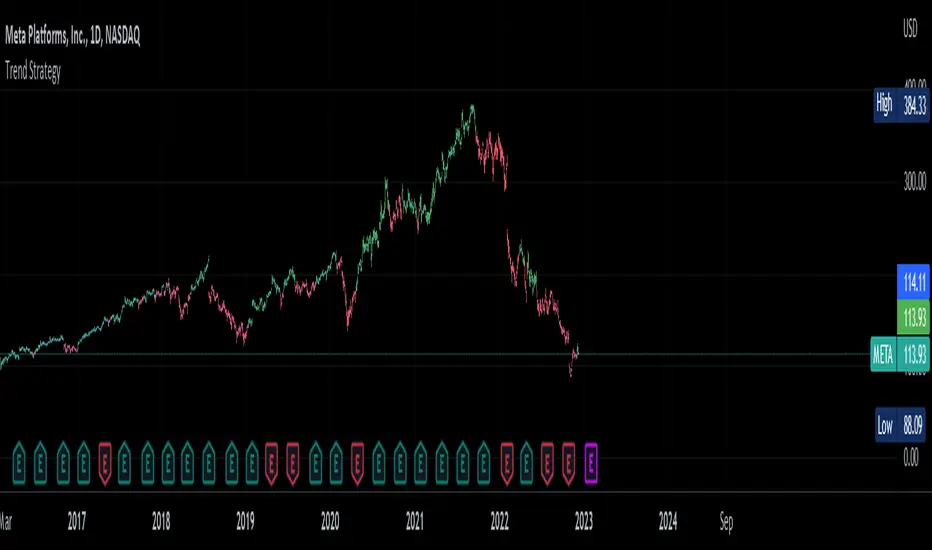
Trend Strategy by zdmreThis Strategy is a trend following indicator. It is plotted on price and the current trend can be determined by its placement vis-a-vis price. It is constructed with just three parameters: Period, Multiplier and Entry/Exit Point with Superformula.
The default parameters are 14 for Average True Range (ATR) and 4 for its multiplier. The average true range (ATR) plays a key role in ‘Trend’ as the indicator uses ATR to compute its value and it signals the degree of price volatility. You should note that any changes to these numbers can affect the use of the Trend indicator.
While you using this indicator, you should not avoid putting your stop loss.
For a long position, you can put stop loss right at the red indicator line. For a short position, you can put it at the green indicator line. You can insert your own settings as well.
Using Trend Strategy along with a stop loss pattern is the best way for earning the best wealth in trading.
There is no best setting for any trading indicator.
TREND Follow 4WMA What is TREND FOLLOW 4WMA ? TREND FOLLOW 4WMA is max 4 ta.wma moving average can tell the trend
Strategy: 2 big moving average control of average trend and 2 small moving average can tell market going
TREND UP : The letters in yellow can indicate the average market trend UP , You can trade on the support or trade on the signal of the word BUY.
TREND DOWN : The letters in yellow can indicate the average market trend DOWN , You can trade on the Reistance or trade on the signal of the word SELL.
TEXT BUY: Make from 2 ta.wma moving average cross up can tell the average that will occur over time of the trend, to say that the current average is a percentage of the uptrend.
TEXT SELL: make from 2 ta.wma moiving average cross down can tell the average that will occur over time of the trend down, to say that the current average is a percentage of the downtrend.
How to use ?
Waiting Yellow TEXT prepare Open Position LONG or BUY when TEXT show and you can Take profits by Resistance of market or Take profits when TEXT Show

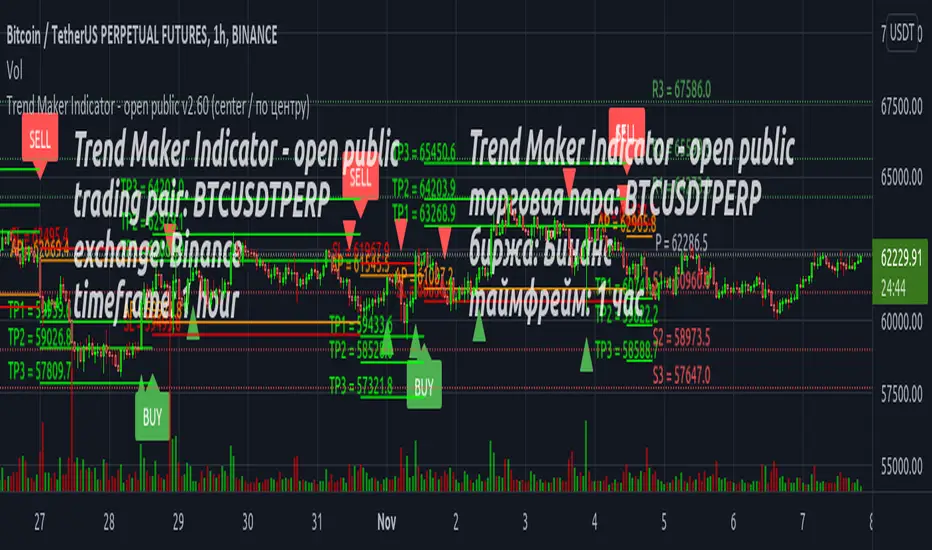
Trend Maker Indicator - open publicThe Trend Maker indicator is an advanced technical analysis tool. A feature of the indicator is simple and user-friendly conclusions drawn from a variety of data, including the market price, buy and sell volumes, short-term and long-term trend and corridor, estimated support and resistance levels, and pivot points .
The result of the indicator's operation is the constructed probabilistic forecast of the market price. The forecast contains expectations for price levels, level of risk and level of consolidation. Depending on the selected trading pair and timeframe, the Trend Maker indicator builds a forecast automatically.
There are two types of forecast: forecast of market growth and forecast of market decline. Each forecast contains its own calculated data, indication of the candle on which it was opened, digital and graphical values of expectations.
The Trend Maker indicator has a simple user interface and settings. The indicator is designed to work on the crypto currency market, but it is also suitable for working on the stock and foreign exchange markets.
At the moment, the indicator is optimized for working with the BTCUSDTFUTURES pair on the Binance exchange, and on timeframes of 15 minutes and 1 hour. As the indicator develops and updates, new trading pairs and timeframes will be indicated in the indicator's update log.
The Trend Maker indicator is not financial advice and is not a "loot button". This is a technical analysis tool that is an assistant in trading, but you make all decisions yourself at your own peril and risk.
**********************
Индикатор Trend Maker - это продвинутый инструмент технического анализа. Особенность индикатора - простые и понятные пользователю выводы, сделанные из разнообразных данных, включая цену рынка, объемы купли и продажи, краткосрочные и долгосрочные тренд и коридор, расчетные уровни поддержки и сопротивления, разворотные точки.
Результатом работы индикатора является построенный вероятностный прогноз цены рынка. Прогноз содержит ожидания по ценовым уровням, уровню риска и уровню консолидации. В зависимости от выбранных торговой пары и таймфрейма, индикатор Trend Maker строит прогноз автоматически.
Прогноз бывает двух видов: прогноз рост рынка и прогноз падения рынка. Каждый прогноз содержит свои расчетные данные, индикацию свечи, на которой он был открыт, цифровые и графические значения ожиданий.
Индикатор Trend Maker миеет простой пользовательский интерфейс и настройки. Индикатор предназначен для работы на крипто валютном рынке, однако подходит и для работы на фондовом и валютном рынках.
В настоящий момент индикатор оптимизирован для работы с парой BTCUSDTFUTURES на бирже Бинанс, и на таймфреймах 15 минут и 1 час. По мере развития и обновления индикатора, новые торговые пары и таймфреймы будут указываться в журнале обновлений данного индикатора.
Индикатор Trend Maker не является финансовым советом и не является "кнопкой бабло". Это инструмент технического анализа, являющийся помощником в торговле, но все решения вы принимаете самостоятельно на ваш страх и риск.
Trend Line © MBY_LABHello.
This indicator uses the intersection of the moving average to output a trend line.
In general, the price at which the moving average crosses is interpreted as a meaningful point.
This indicator can be used by anyo ne.
This indicator outputs three lines.
1. Intersection
This intersection is marked by a horizontal line and can be used as an appropriate stop loss section.
2. Trend line (upper)
This trend line reflects the trend line that reflects the maximum increase. In general, a breakout of this trend line means that the medium-term trend has been broken.
3. Trend line (lower)
This trend line reflects the trend line with the largest decline. In general, a deviation from this trend line is interpreted as a dead cat.
4. Color
The green color appears at the golden cross of the moving average, and the black color appears at the dead cross.

PBK Trend Band with EntryTrend band with background coloring of the trend.
Use 5, 15 for fast detection on EMAs
Additional arrows show under some favorable conditions.
This is work in progress, I release this version so that some good friend can make use of it.