Trend Trader Bands This is plots the indicator developed by Andrew Abraham
in the Trading the Trend article of TASC September 1998
It was modified, result values wass averages.
And draw two bands above and below TT line.
在腳本中搜尋"trend"

Trend Trader AVR Backtest This is plots the indicator developed by Andrew Abraham
in the Trading the Trend article of TASC September 1998
It was modified, result values wass averages.

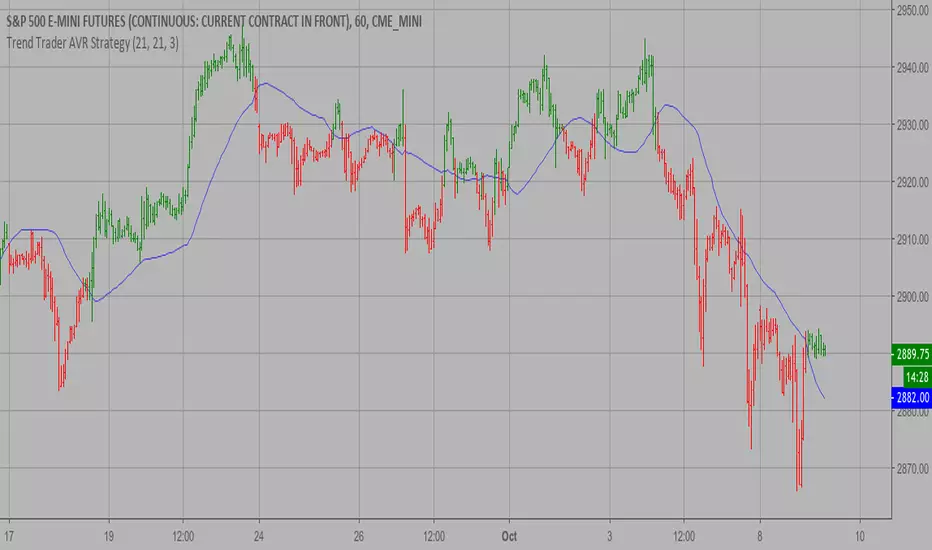
Trend Trader AVR Strategy This is plots the indicator developed by Andrew Abraham
in the Trading the Trend article of TASC September 1998
It was modified, result values wass averages.
Trend Trader AVR This is plots the indicator developed by Andrew Abraham
in the Trading the Trend article of TASC September 1998
It was modified, result values wass averages.

trend searchYou can know chart trend by this indicator. SMA theory is using for search trend.
Green back color = Uptrend start
Red back color = Downtrend start

Trend Hunter BETAThis is the Trend Hunter Alert Companion study. A trend following/breakout strategy with profit percentage targets.

Leonard-15M Trend Following SystemTrend Following System
Leonard
Build 4555525553442d31354d
Copyright Exonumia Fund

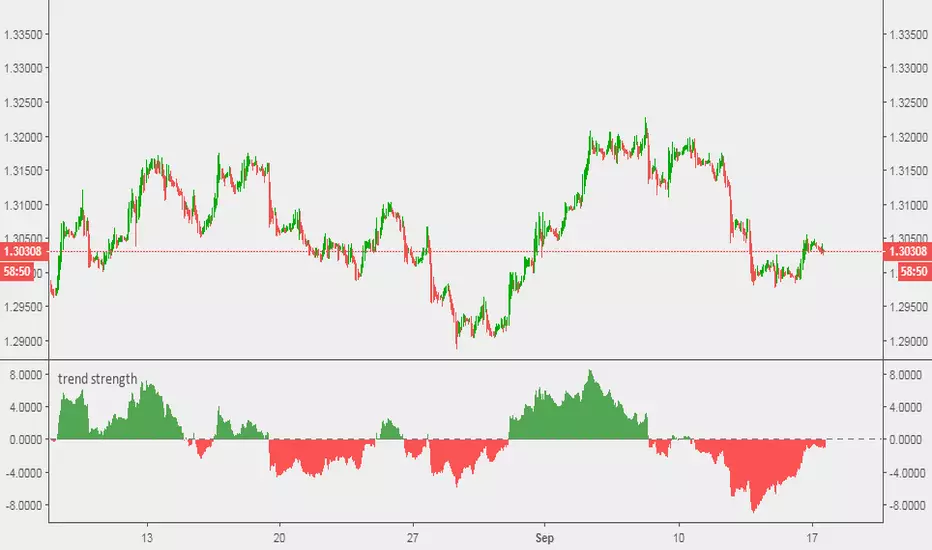
trend Strength Oscillatortrend strength is a column bar oscillators which shows power of trend according to EMA and signal period inputs
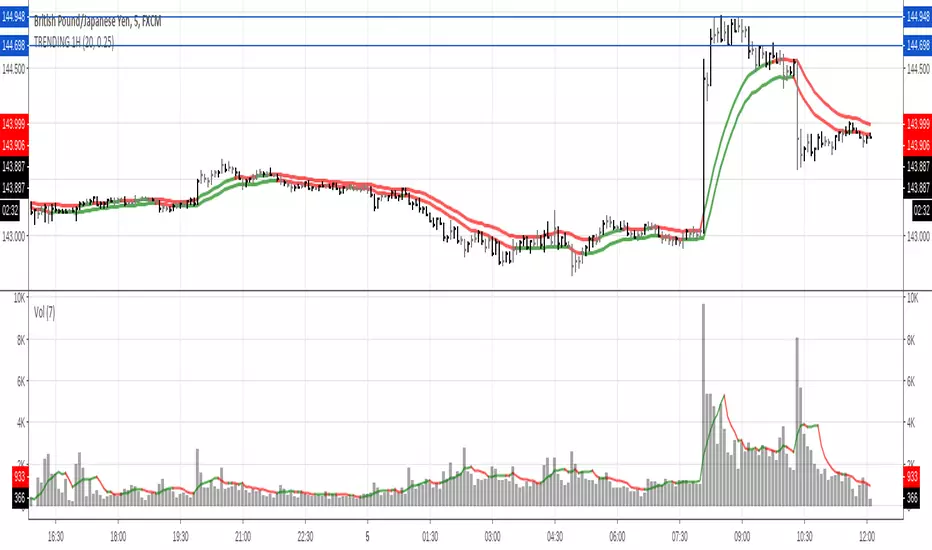
TRENDING high / low 20s EMA with GRAY Bars / Black BarsColored 20 default EMAs describing the trend
Black bars showing strength or weakness on 25% default.
Gray bars showing uncertainty
check volume to take decisions.
trend show(lir)
trend show is a powerful indicator which shows dominant trend in different time franmes

Trend Strength Indicator - "Tren"The Tren indicator is a combination of Trend Strength Indicators that I combined in an attempt to better aid position taking. It utilizes certain conditions amongst trend strength indicators and plots numbers 0-12 above (if bullish) or below (if bearish) depending on the conditions. The higher the number, the stronger the Trend Strength is. If one wanted to go long or short, but the trend strength was weak - a trader might want to reconsider their position. If a trader was currently in a position and experienced a retrace, but the trend strength was high and in their favor, a trader might use this indicator to reconsider exiting a trade - therefore maximzing profits.
This indicator is not currently for sale, and is in its beta stages. Follow me for more updates and indicators.


TREND CROSSES ALERTThe crossing of moving averages can help you determine the tendency of an instrument to trade.
The script has two configurable moving averages that will help you determine the trend and then take advantage of it in your strategy.
Remember to use the alerts.

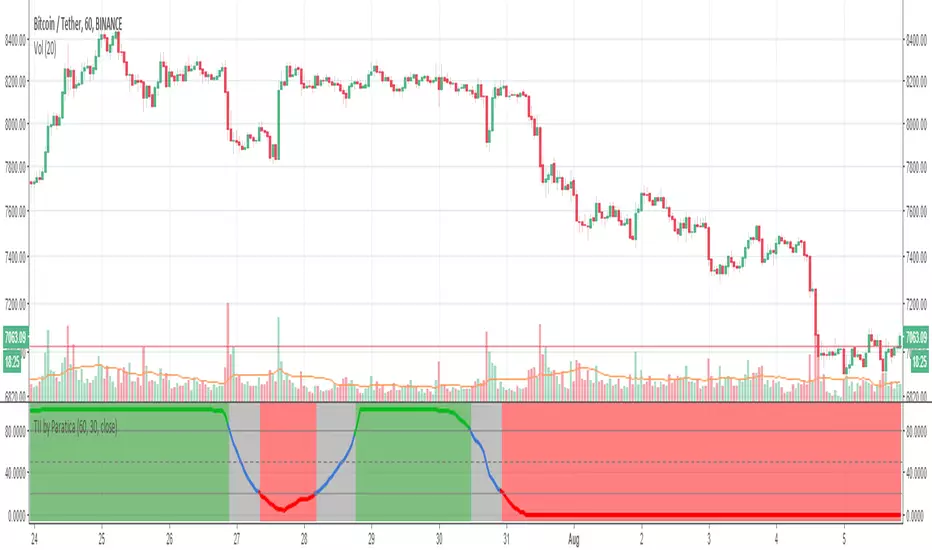
Trend Intensity Index by ParaticaTrend Intensity Index is very strong. It can see next coming trend very early

Trend Cross StrategyMoving average cross strategy with a custom trend line that allows for better positioning when buying and selling.
1. Shorts positions at ideal times to protect from large drops
2. Captures full gains when the price is mooning.
3. Makes small gains while the market is sideways and trending downward
*Intended for Bot Trading, but can be used on larger time frames for manual trading.
**Use Heikin-Ashi Candlesticks

Trend Continuation FactorTrend Continuation Factor indicator script.
This indicator was originally developed by M.H. Pee (Stocks & Commodities V. 20:3 (58-64): Trend Continuation Factor).

Trend Trigger FactorTrend Trigger Factor indicator script. This indicator was originally developed by M. H. Pee (Stocks & Commodities V.22:12 (28-36): Trend Trigger Factor).

Trend StrengthTrend Analysis and Divergence Filter
This tool helps you to read trend strength and spot divergences, to be ready for a reversal.
All the tool is based on a colorcode:
- bright colors = impulse bars.
- hard colors = consolidation / continuation bars.
- light colors = weakness bars.
=> You can choose to use barcolor, or not, and simply use the indicator. Divergences occured on the histogram, when the price makes a local high/low, but the histogram in the black zone.
Also, the reason why i created is that it is insanely accurate to spot divergences in an established trend.
#In an uptrend:
- If prices makes a higher high,
- But bar color is green light (or histogram is in the blackzone), it's probably the end of the move and a regular bearish divergence is happening.
=> Take profit and open a short.
#In a downtrend :
- If price makes a lower low,
- But bar color is red light (or histogram is in the blackzone), it's probably the end of the move and a regular bullish divergence is happening.
=> Take profit and open a long.
To sum up:
- when you see light bars, or if the histogram is in the blackzone, be prepared for a move.
- To choose the direction, check for divergences before entering.
To get the most benefit of this indicator, use it in a multi timeframe strategy :
The indicator will give you the best results in the subordinate timeframe, considering you trade using a macro trend, a parent and a subordinate one.

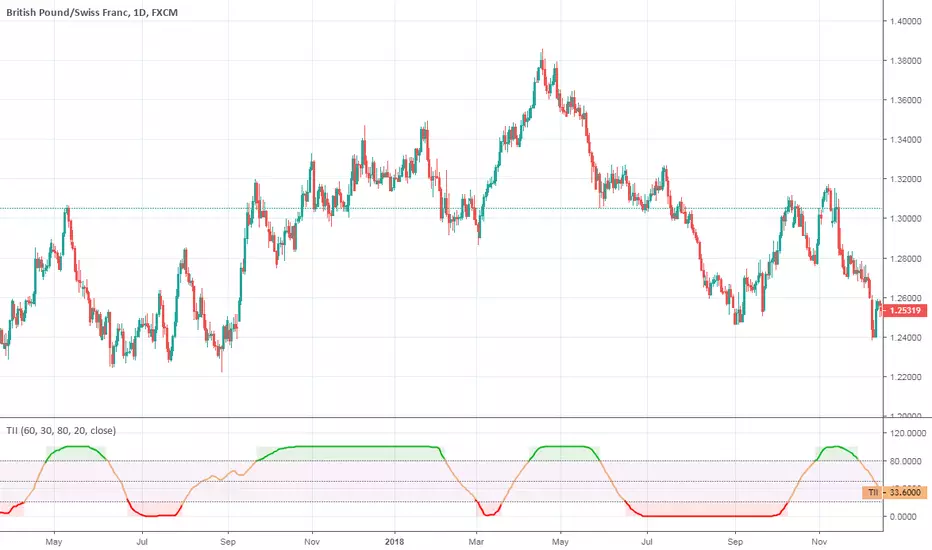
Trend Intensity IndexTrend Intensity Index indicator script. This indicator was originally developed by M. H. Pee (06/2002 issue of Stocks and Commodities Magazine)
Trend Intensity Index [DW]This study is a simple variation of M. H. Pee's Trend Intensity Index that includes two signal lines rather than one for additional trend confirmation.

Trend-following Microprofit w/ Smart DCA BACKTESTING VERSIONCompanion to the alert script:
Tradingview doesn't like backtesting with too little capital or trade sizes less than 1 share, so the "Net Profit" number may not be accurate right off the bat. To get a better idea, change the order size or initial capital so the strategy is trading the appropriate % of initial capital. For example, if your personal capital is $2000 and you are making $100 trades, your trades are 5% of initial capital. That is roughly equivalent to the defaults using orders of 1 BTC with $100,000 capital.
Tightening the stop level will improve the Net Profit to Max Drawdown ratio, making the strategy more suitable for large trade sizes.
This script does not provide alerts for Gunbot. Find the settings you like using this strategy script, then plug those values into the alert script.
If you like this you can buy me chocolate below. Cheers!

Trend Trading StrategyThis indicator identifies trade setup for my Trend Trading Strategy. Leave a like/comments!
